
USD/CHF Price Forecast: Breakdown below 0.7800 extends downtrend
작성자 Christian Borjon Valencia
수정됨: 20 Apr 2026


인기 기사

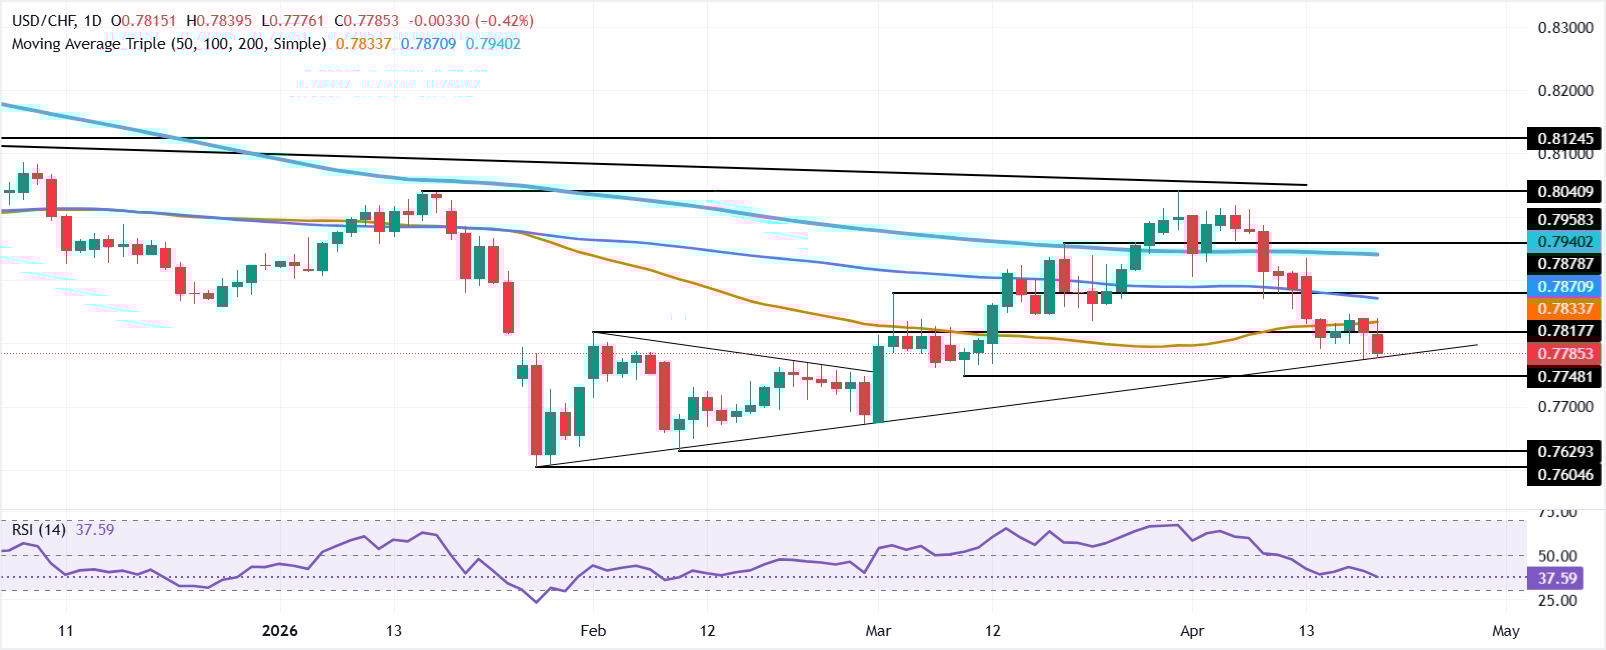
The USD/CHF tests key support at a trendline after clearing the 50-day Simple Moving Average (SMA) at 0.7828 which exacerbated the breach of the 0.7800 figure, and testing last week’s lows of 0.7775.
- USD/CHF breaks below 0.7800, testing critical trendline support zone.
- RSI weakens further, confirming sellers remain firmly in control.
- Break below 0.7747 exposes 0.7668 and deeper downside levels.
The USD/CHF tests key support at a trendline after clearing the 50-day Simple Moving Average (SMA) at 0.7828 which exacerbated the breach of the 0.7800 figure, and testing last week’s lows of 0.7775. At the time of writing, the pair is down 0.37%, poised to extend its losses on a breach of key support at 0.7747.
USD/CHF Price Forecast: Technical outlook
The technical picture shows the USD/CHF downtrend remains intact, with sellers gathering momentum as depicted in the Relative Strength Index (RSI). The RSI is aiming lower, clearing the last throut of 39. That said, the last line of demand threatened by sellers at 0.7775 might be at risk of getting cleared, clearing the path towards the March 10 low of 0.7747. On further weakness, the next area of interest would be the March 2 low of 0.7668.
Conversely, for a recovery, bulls must clear 0.7800 and also the 50-day SMA. Once those two areas are taken down, the next key resistance would be the 100-day SMA at 0.7868, ahead of the 20-day SMA at 0.7906.
USD/CHF Price Chart – Daily
Swiss Franc Price Today
The table below shows the percentage change of Swiss Franc (CHF) against listed major currencies today. Swiss Franc was the strongest against the Japanese Yen.
| USD | EUR | GBP | JPY | CAD | AUD | NZD | CHF | |
|---|---|---|---|---|---|---|---|---|
| USD | -0.16% | -0.14% | 0.08% | -0.37% | -0.05% | -0.11% | -0.39% | |
| EUR | 0.16% | 0.02% | 0.19% | -0.21% | 0.11% | 0.06% | -0.25% | |
| GBP | 0.14% | -0.02% | 0.17% | -0.22% | 0.06% | 0.04% | -0.29% | |
| JPY | -0.08% | -0.19% | -0.17% | -0.41% | -0.11% | -0.20% | -0.46% | |
| CAD | 0.37% | 0.21% | 0.22% | 0.41% | 0.31% | 0.23% | -0.04% | |
| AUD | 0.05% | -0.11% | -0.06% | 0.11% | -0.31% | -0.06% | -0.35% | |
| NZD | 0.11% | -0.06% | -0.04% | 0.20% | -0.23% | 0.06% | -0.30% | |
| CHF | 0.39% | 0.25% | 0.29% | 0.46% | 0.04% | 0.35% | 0.30% |
The heat map shows percentage changes of major currencies against each other. The base currency is picked from the left column, while the quote currency is picked from the top row. For example, if you pick the Swiss Franc from the left column and move along the horizontal line to the US Dollar, the percentage change displayed in the box will represent CHF (base)/USD (quote).

100만 명이 넘는 사용자가 FXStreet를 통해 실시간 시장 데이터, 차트 도구, 전문가 인사이트, 포렉스 뉴스를 이용합니다. 포괄적인 경제 캘린더와 교육 웨비나는 트레이더가 정보를 유지하고 신중한 결정을 내리도록 돕습니다. FXStreet는 바르셀로나 본사와 전 세계 지역에 걸쳐 약 60명의 팀으로 구성되어 있습니다.
더 읽기


