
USD/CHF Price Forecast: Climbs past 0.7900, eyes on 200-day SMA
작성자 Christian Borjon Valencia
수정됨: 25 Mar 2026


인기 기사

The USD/CHF advances for the second day of the week, up by nearly 0.45% after bouncing off the 100-day Simple Moving Average (SMA), slightly above the 0.7900 figure. At the time of writing, the pair trades at 0.7915 as the US Dollar remains boosted by geopolitical uncertainty.
- USD/CHF rebounds from 100-day SMA, extending gains for second day.
- RSI above 50 signals bullish momentum building toward overbought territory.
- Break above 0.8000 exposes YTD high and 0.8124 resistance.
The USD/CHF advances for the second day of the week, up by nearly 0.45% after bouncing off the 100-day Simple Moving Average (SMA), slightly above the 0.7900 figure. At the time of writing, the pair trades at 0.7915 as the US Dollar remains boosted by geopolitical uncertainty.
USD/CHF Price Forecast: Technical outlook
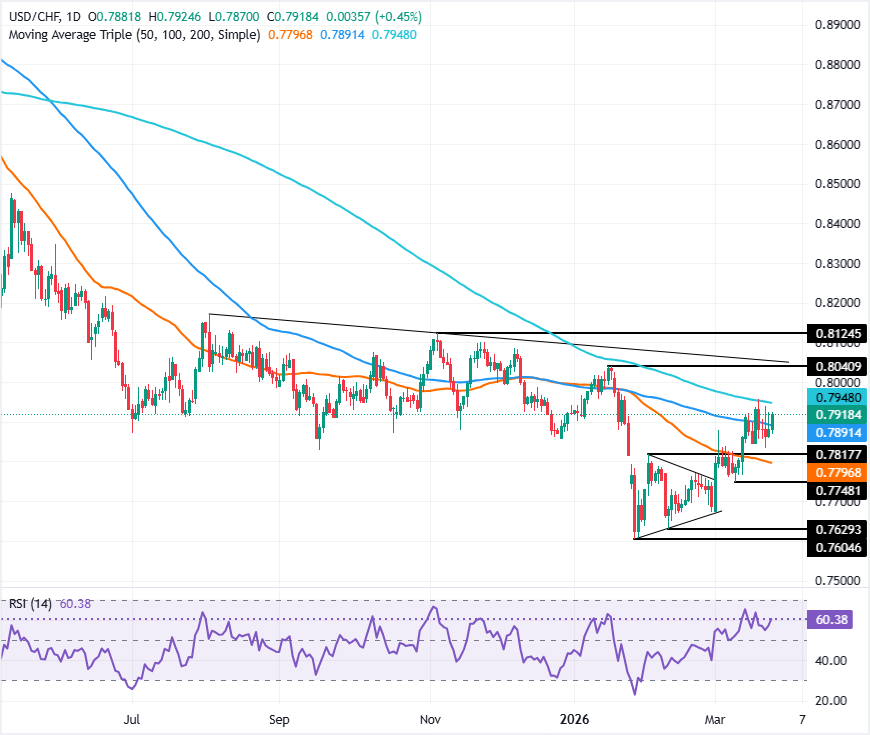
Recently, the USD/CHF has been trading sideways amid a lack of a clear catalyst amid the Middle East war. Still, over the last two days, buyers seem to be pressing towards clearing the 200-day Simple Moving Average (SMA) at 0.7946, a key resistance level on the buyers’ path towards 0.8000.
Momentum confirms that bulls are in charge, as the Relative Strength Index (RSI) is above its 50-neutral level and heading towards overbought territory.
With that said, the USD/CHF needs to surpass the key resistance levels mentioned in the second paragraph. If buyers reclaim 0.8000, it opens the door to challenging the year-to-date (YTD) high of 0.8046. Once surpassed, the next stop would be the November 5 swing high at 0.8124.
USD/CHF Price Chart — Daily
Swiss Franc Price Today
The table below shows the percentage change of Swiss Franc (CHF) against listed major currencies today. Swiss Franc was the strongest against the Australian Dollar.
| USD | EUR | GBP | JPY | CAD | AUD | NZD | CHF | |
|---|---|---|---|---|---|---|---|---|
| USD | 0.40% | 0.35% | 0.48% | 0.35% | 0.69% | 0.48% | 0.47% | |
| EUR | -0.40% | -0.05% | 0.09% | -0.03% | 0.29% | 0.10% | 0.06% | |
| GBP | -0.35% | 0.05% | 0.13% | -0.00% | 0.33% | 0.16% | 0.11% | |
| JPY | -0.48% | -0.09% | -0.13% | -0.13% | 0.20% | 0.03% | -0.02% | |
| CAD | -0.35% | 0.03% | 0.00% | 0.13% | 0.34% | 0.17% | 0.12% | |
| AUD | -0.69% | -0.29% | -0.33% | -0.20% | -0.34% | -0.18% | -0.22% | |
| NZD | -0.48% | -0.10% | -0.16% | -0.03% | -0.17% | 0.18% | -0.04% | |
| CHF | -0.47% | -0.06% | -0.11% | 0.02% | -0.12% | 0.22% | 0.04% |
The heat map shows percentage changes of major currencies against each other. The base currency is picked from the left column, while the quote currency is picked from the top row. For example, if you pick the Swiss Franc from the left column and move along the horizontal line to the US Dollar, the percentage change displayed in the box will represent CHF (base)/USD (quote).

100만 명이 넘는 사용자가 FXStreet를 통해 실시간 시장 데이터, 차트 도구, 전문가 인사이트, 포렉스 뉴스를 이용합니다. 포괄적인 경제 캘린더와 교육 웨비나는 트레이더가 정보를 유지하고 신중한 결정을 내리도록 돕습니다. FXStreet는 바르셀로나 본사와 전 세계 지역에 걸쳐 약 60명의 팀으로 구성되어 있습니다.
더 읽기


