
USD/CHF Price Forecast: Hits 11-month high above 0.8100
작성자 Christian Borjon Valencia
수정됨: 24 Jun 2026


인기 기사

The USD/CHF extends its rally for the third straight day this week and refreshes year-to-date (YTD) highs, peaking at 0.8139, which is also an 11-month high. At the time of writing, the pair trades at 0.8124, up 0.34%.
- USD/CHF refreshes YTD highs as rally extends six days.
- RSI enters overbought territory, signaling powerful bullish momentum persists.
- Break above 0.8200 exposes 0.8215 and 0.8300 resistance.
The USD/CHF extends its rally for the third straight day this week and refreshes year-to-date (YTD) highs, peaking at 0.8139, which is also an 11-month high. At the time of writing, the pair trades at 0.8124, up 0.34%.
USD/CHF Price Forecast: Technical outlook
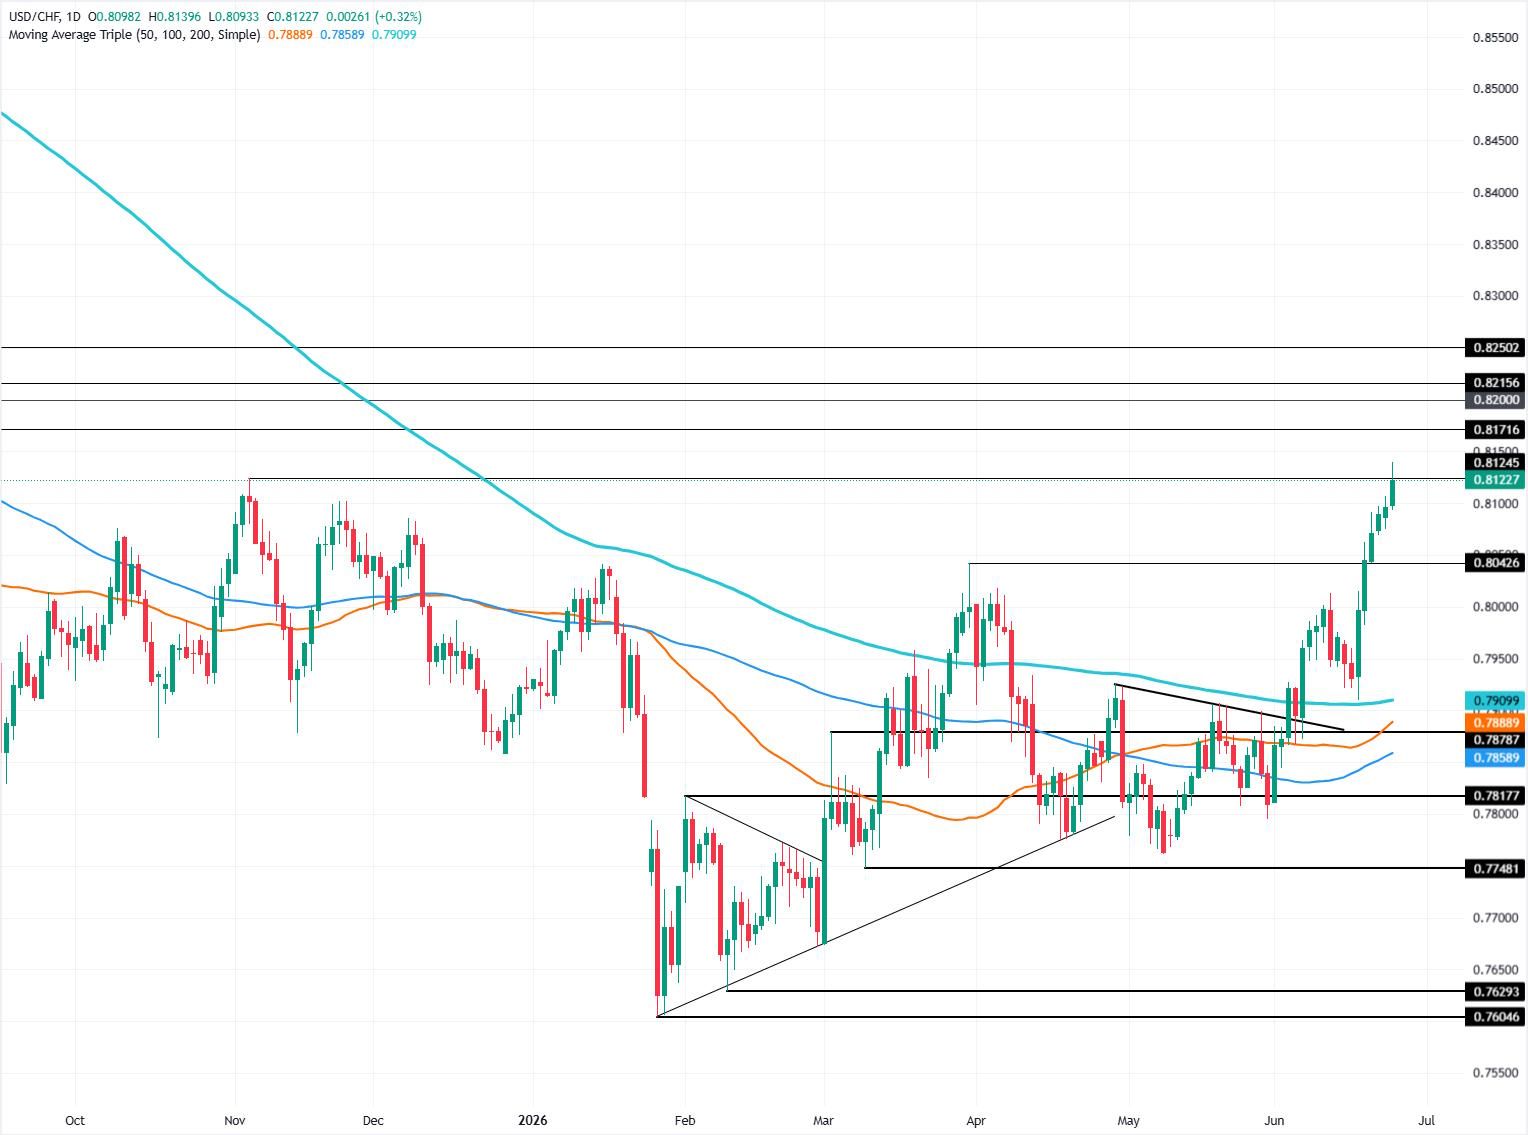
The USD/CHF has been rallying for six days, and if it closes Wednesday’s session above 0.8100, bulls could reach the 0.8200 level rather sooner than later.
The Relative Strength Index (RSI) shows the pair is overbought, but it is short of the 80 level, considered the most extreme. When RSI is between 70 and 80, the uptrend is at its strongest; hence, readings above 80 are most precise for indicating market tops.
If USD/CHF clears 0.8200, the next resistance would be the June 19, 2025, daily high at 0.8215, ahead of 0.8250. A breach of the latter will expose 0.8300. On the other hand, if bears drive the pair below 0.8100, the next support would be the March 31 swing high of 0.8042. Below this level is 0.8000.
USD/CHF Price Chart – Daily
Swiss Franc Price This week
The table below shows the percentage change of Swiss Franc (CHF) against listed major currencies this week. Swiss Franc was the strongest against the New Zealand Dollar.
| USD | EUR | GBP | JPY | CAD | AUD | NZD | CHF | |
|---|---|---|---|---|---|---|---|---|
| USD | 0.93% | 0.21% | 0.26% | 0.47% | 1.58% | 1.69% | 0.60% | |
| EUR | -0.93% | -0.73% | -0.61% | -0.41% | 0.69% | 0.77% | -0.32% | |
| GBP | -0.21% | 0.73% | -0.13% | 0.26% | 1.38% | 1.36% | 0.38% | |
| JPY | -0.26% | 0.61% | 0.13% | 0.13% | 1.29% | 1.27% | 0.28% | |
| CAD | -0.47% | 0.41% | -0.26% | -0.13% | 1.16% | 1.20% | 0.11% | |
| AUD | -1.58% | -0.69% | -1.38% | -1.29% | -1.16% | -0.03% | -0.94% | |
| NZD | -1.69% | -0.77% | -1.36% | -1.27% | -1.20% | 0.03% | -0.94% | |
| CHF | -0.60% | 0.32% | -0.38% | -0.28% | -0.11% | 0.94% | 0.94% |
The heat map shows percentage changes of major currencies against each other. The base currency is picked from the left column, while the quote currency is picked from the top row. For example, if you pick the Swiss Franc from the left column and move along the horizontal line to the US Dollar, the percentage change displayed in the box will represent CHF (base)/USD (quote).

100만 명이 넘는 사용자가 FXStreet를 통해 실시간 시장 데이터, 차트 도구, 전문가 인사이트, 포렉스 뉴스를 이용합니다. 포괄적인 경제 캘린더와 교육 웨비나는 트레이더가 정보를 유지하고 신중한 결정을 내리도록 돕습니다. FXStreet는 바르셀로나 본사와 전 세계 지역에 걸쳐 약 60명의 팀으로 구성되어 있습니다.
더 읽기


