
USD/CHF Price Forecast: Hits new YTD high, past 0.8050
작성자 Christian Borjon Valencia
수정됨: 18 Jun 2026


인기 기사

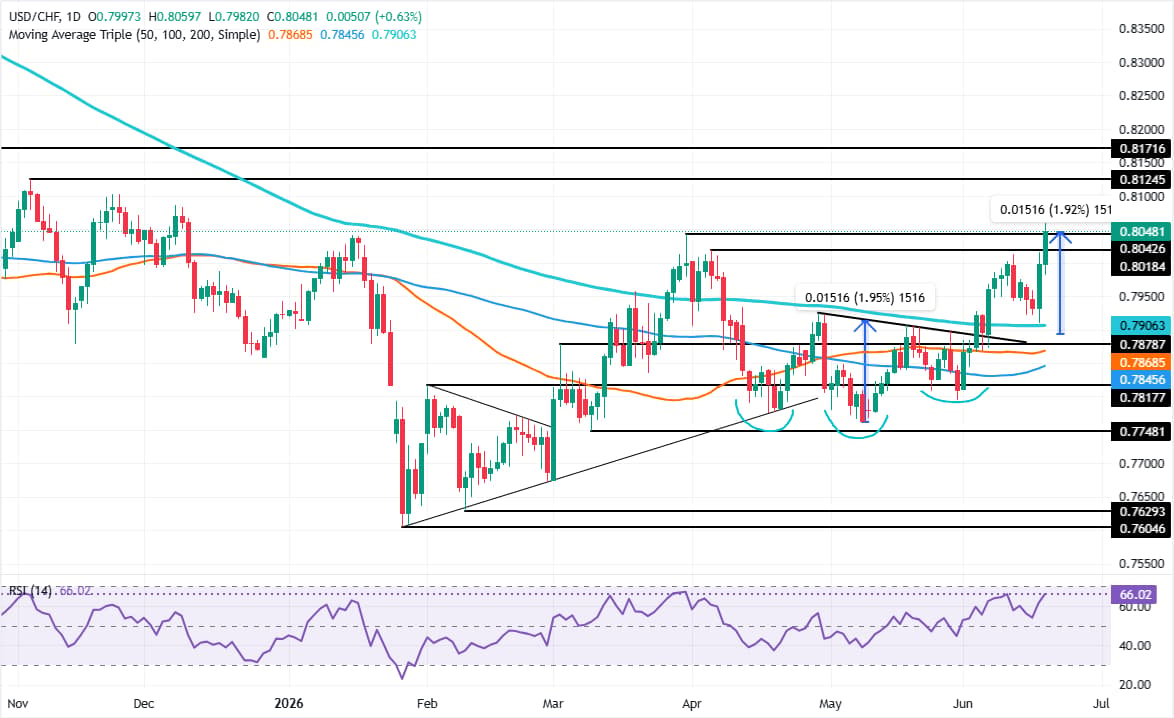
The USD/CHF rallies to a new yearly high of 0.8059, surpassing March’s 31 previous peak of 2026 at 0.8042 as the Greenback stages a recovery due to hawkish Fed policy expectations, which drove the pair to reach the ‘inverted head-and-shoulders,’ price target.
- USD/CHF clears previous YTD high, confirming bullish continuation structure.
- RSI breaks latest peak, signaling buyers are gaining momentum.
- Break above 0.8100 exposes 0.8124 and 0.8171 resistance.
The USD/CHF rallies to a new yearly high of 0.8059, surpassing March’s 31 previous peak of 2026 at 0.8042 as the Greenback stages a recovery due to hawkish Fed policy expectations, which drove the pair to reach the ‘inverted head-and-shoulders,’ price target.
USD/CHF Price Forecast: Technical outlook
Price action shows the pair is upwardly biased after clearing its previous yearly peak. USD/JPY buyers are shifting towards challenging the 0.8100 milestone, ahead of the November 2025 peak of 0.8124.
The Relative Strength Index (RSI) cleared its latest peak, signalling that buyers are gaining momentum.
Therefore, if USD/CHF clears 0.8100, the 0.8124 high is up next. Once breached, the next area of interest would be the August 2025 high at 0.8171, before buyers test the 0.8200 figure.
On the downside, the USD/CHF first support would be June’s 17 high, turned support at 0.8015. Once cleared, 0.8000 is up next, followed by the 200-day SMA at 0.7906.
USD/CHF Price Chart – Daily
Swiss Franc Price Today
The table below shows the percentage change of Swiss Franc (CHF) against listed major currencies today. Swiss Franc was the strongest against the British Pound.
| USD | EUR | GBP | JPY | CAD | AUD | NZD | CHF | |
|---|---|---|---|---|---|---|---|---|
| USD | 0.36% | 0.65% | 0.40% | 0.21% | -0.04% | 0.27% | 0.65% | |
| EUR | -0.36% | 0.30% | 0.07% | -0.15% | -0.41% | -0.14% | 0.29% | |
| GBP | -0.65% | -0.30% | -0.26% | -0.45% | -0.69% | -0.43% | -0.03% | |
| JPY | -0.40% | -0.07% | 0.26% | -0.19% | -0.47% | -0.20% | 0.21% | |
| CAD | -0.21% | 0.15% | 0.45% | 0.19% | -0.28% | -0.00% | 0.42% | |
| AUD | 0.04% | 0.41% | 0.69% | 0.47% | 0.28% | 0.27% | 0.71% | |
| NZD | -0.27% | 0.14% | 0.43% | 0.20% | 0.00% | -0.27% | 0.43% | |
| CHF | -0.65% | -0.29% | 0.03% | -0.21% | -0.42% | -0.71% | -0.43% |
The heat map shows percentage changes of major currencies against each other. The base currency is picked from the left column, while the quote currency is picked from the top row. For example, if you pick the Swiss Franc from the left column and move along the horizontal line to the US Dollar, the percentage change displayed in the box will represent CHF (base)/USD (quote).

100만 명이 넘는 사용자가 FXStreet를 통해 실시간 시장 데이터, 차트 도구, 전문가 인사이트, 포렉스 뉴스를 이용합니다. 포괄적인 경제 캘린더와 교육 웨비나는 트레이더가 정보를 유지하고 신중한 결정을 내리도록 돕습니다. FXStreet는 바르셀로나 본사와 전 세계 지역에 걸쳐 약 60명의 팀으로 구성되어 있습니다.
더 읽기


