
USD/CHF Price Forecast: Rejected at SMA cluster, bears target 0.78
작성자 Christian Borjon Valencia
수정됨: 5 May 2026


인기 기사

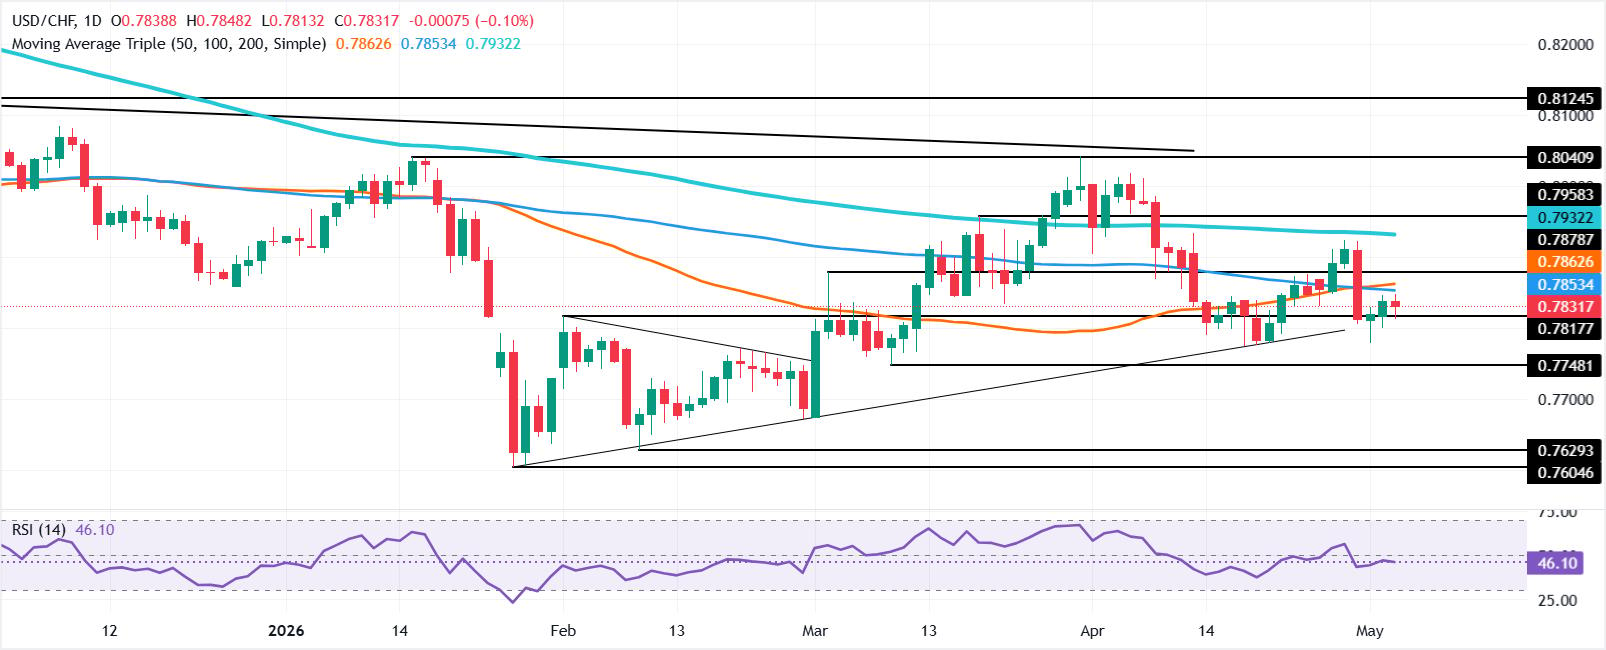
USD/CHF retreats during the North American session, yet extends edges lower 0.12% as the pair clashes with the confluence of a key resistance area comprised by the 20-, 100- and 50-day Simple Moving Averages (SMAs) at around 0.7842-57. At the time of writing, the pair trades at 0.7830.
- USD/CHF capped by 20-, 50-, and 100-day SMA confluence.
- RSI improves, but broader structure remains tilted to downside.
- Break below 0.7800 exposes 0.7775 and 0.7748 support levels.
USD/CHF retreats during the North American session, yet extends edges lower 0.12% as the pair clashes with the confluence of a key resistance area comprised by the 20-, 100- and 50-day Simple Moving Averages (SMAs) at around 0.7842-57. At the time of writing, the pair trades at 0.7830.
USD/CHF Price Forecast: Technical outlook
The USD/CHF's Monday recovery seems short-lived, as it faced a key resistance area that could push the pair down towards the 0.7800 mark. Market structure remains bearishly biased, but momentum suggests buyers are stepping in, as indicated by the Relative Strength Index (RSI).
In the short term, the USD/CHF might consolidate within the 0.7800-0.7860 range. A breach of the top of the range could open the door for further upside. The first resistance would be 0.7900, followed by the 200-day SMA at 0.7929. Overhead lies 0.7950, followed by the psychological 0.8000 mark.
Downwards, if sellers clear the key support trendline around 0.7800, it would pave the way for a test of the April 17 daily low at 0.7775, ahead of the March 10 daily low at 0.7748. Up next lies the March 2 cycle low of 0.7668.
USD/CHF Price Chart – Daily
Swiss Franc Price Today
The table below shows the percentage change of Swiss Franc (CHF) against listed major currencies today. Swiss Franc was the strongest against the Japanese Yen.
| USD | EUR | GBP | JPY | CAD | AUD | NZD | CHF | |
|---|---|---|---|---|---|---|---|---|
| USD | -0.04% | -0.07% | 0.41% | -0.02% | -0.21% | -0.25% | -0.12% | |
| EUR | 0.04% | -0.05% | 0.46% | 0.02% | -0.19% | -0.21% | -0.07% | |
| GBP | 0.07% | 0.05% | 0.49% | 0.05% | -0.14% | -0.16% | -0.02% | |
| JPY | -0.41% | -0.46% | -0.49% | -0.42% | -0.64% | -0.65% | -0.50% | |
| CAD | 0.02% | -0.02% | -0.05% | 0.42% | -0.21% | -0.24% | -0.10% | |
| AUD | 0.21% | 0.19% | 0.14% | 0.64% | 0.21% | -0.02% | 0.12% | |
| NZD | 0.25% | 0.21% | 0.16% | 0.65% | 0.24% | 0.02% | 0.14% | |
| CHF | 0.12% | 0.07% | 0.02% | 0.50% | 0.10% | -0.12% | -0.14% |
The heat map shows percentage changes of major currencies against each other. The base currency is picked from the left column, while the quote currency is picked from the top row. For example, if you pick the Swiss Franc from the left column and move along the horizontal line to the US Dollar, the percentage change displayed in the box will represent CHF (base)/USD (quote).

100만 명이 넘는 사용자가 FXStreet를 통해 실시간 시장 데이터, 차트 도구, 전문가 인사이트, 포렉스 뉴스를 이용합니다. 포괄적인 경제 캘린더와 교육 웨비나는 트레이더가 정보를 유지하고 신중한 결정을 내리도록 돕습니다. FXStreet는 바르셀로나 본사와 전 세계 지역에 걸쳐 약 60명의 팀으로 구성되어 있습니다.
더 읽기


