
USD/CHF Price Forecast: Traders eye 0.7800 as RSI turns bullish
작성자 Christian Borjon Valencia
수정됨: 11 Mar 2026


인기 기사

USD/CHF posted back-to-back bullish days on Wednesday, rising by over 0.25% after the latest US inflation report and as high energy prices pushed US Treasury yields higher, consequently the US Dollar (USD). At the time of writing, the pair trades near 0.7800.
- USD/CHF gains 0.25% as US yields climb following steady inflation data.
- Break above 0.7817 could target 0.7850 and the 0.7878 resistance zone.
- Drop below 0.7750 risks a slide toward 0.7700 and the 0.7601 support.
USD/CHF posted back-to-back bullish days on Wednesday, rising by over 0.25% after the latest US inflation report and as high energy prices pushed US Treasury yields higher, consequently the US Dollar (USD). At the time of writing, the pair trades near 0.7800.
USD/CHF Price Forecast: Technical outlook
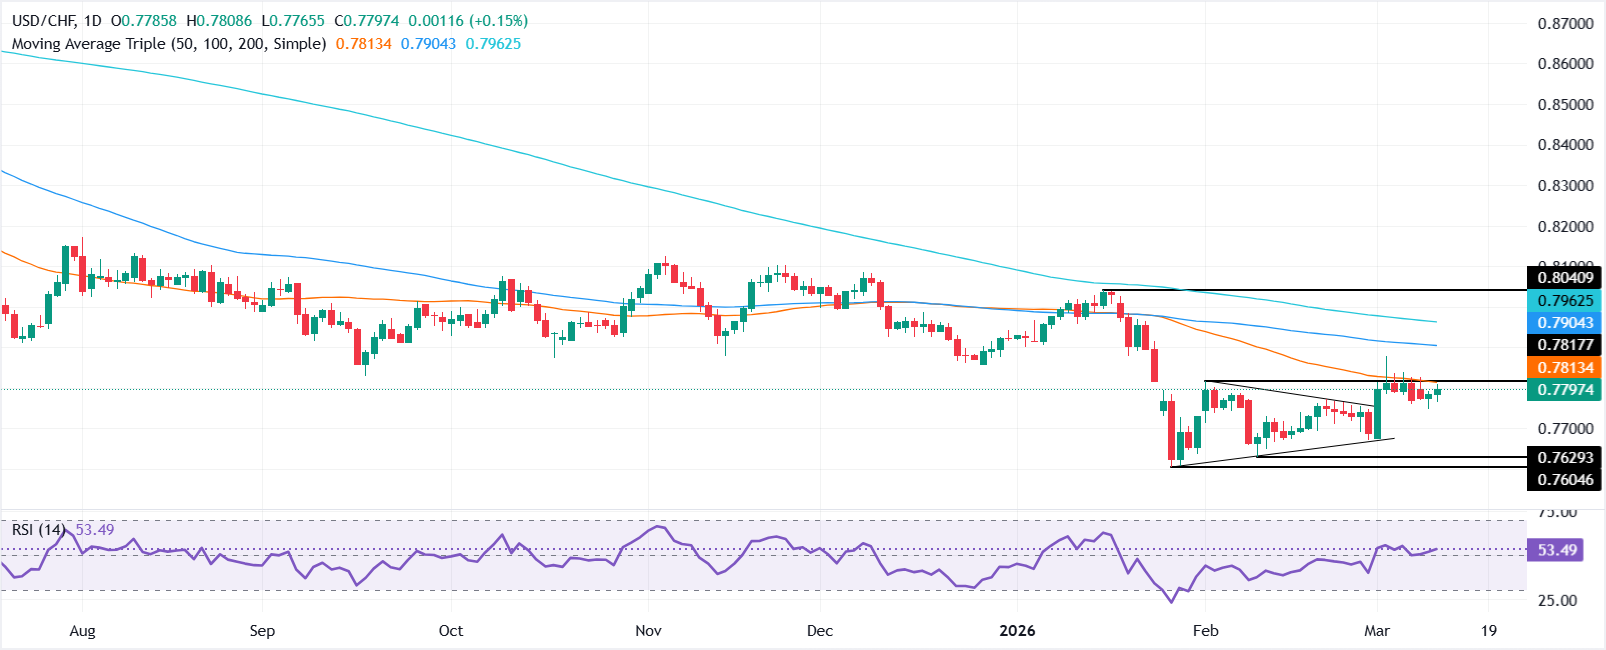
Further consolidation lies ahead, even though buyers pushed USD/CHF to a fresh two-day high past 0.7800. Nevertheless, momentum continues to favour sellers as buyers have remained unable to clear key resistance at 0.7817, the latest cycle high.
The Relative Strength Index (RSI) shows that bulls are gathering some strength, outweighing bears.
With that said, USD/CHF must finish the session above 0.7800 on a daily basis. In that outcome, the next resistance would be the March 3 high at 0.7817. Once cleared, the next stop would be 0.7850, ahead of the March 3 high of 0.7878. Up next lie 0.7900 and 0.8000.
On the flip side, the USD/CHF first support would be the March 6 daily low of 0.7750. If surpassed, the next area of interest would be a support trendline drawn from current-year lows around 0.7601, which passed near the 0.7670-0.7700 range. A breach of the latter will expose the January 28 swing low of 0.7601.
USD/CHF Price Chart – Daily
Swiss Franc Price This week
The table below shows the percentage change of Swiss Franc (CHF) against listed major currencies this week. Swiss Franc was the strongest against the Japanese Yen.
| USD | EUR | GBP | JPY | CAD | AUD | NZD | CHF | |
|---|---|---|---|---|---|---|---|---|
| USD | -0.21% | -0.55% | 0.52% | -0.08% | -2.30% | -0.80% | 0.02% | |
| EUR | 0.21% | -0.36% | 0.75% | 0.11% | -2.11% | -0.62% | 0.21% | |
| GBP | 0.55% | 0.36% | 1.13% | 0.46% | -1.76% | -0.26% | 0.57% | |
| JPY | -0.52% | -0.75% | -1.13% | -0.59% | -2.80% | -1.28% | -0.49% | |
| CAD | 0.08% | -0.11% | -0.46% | 0.59% | -2.23% | -0.71% | 0.10% | |
| AUD | 2.30% | 2.11% | 1.76% | 2.80% | 2.23% | 1.53% | 2.38% | |
| NZD | 0.80% | 0.62% | 0.26% | 1.28% | 0.71% | -1.53% | 0.83% | |
| CHF | -0.02% | -0.21% | -0.57% | 0.49% | -0.10% | -2.38% | -0.83% |
The heat map shows percentage changes of major currencies against each other. The base currency is picked from the left column, while the quote currency is picked from the top row. For example, if you pick the Swiss Franc from the left column and move along the horizontal line to the US Dollar, the percentage change displayed in the box will represent CHF (base)/USD (quote).

100만 명이 넘는 사용자가 FXStreet를 통해 실시간 시장 데이터, 차트 도구, 전문가 인사이트, 포렉스 뉴스를 이용합니다. 포괄적인 경제 캘린더와 교육 웨비나는 트레이더가 정보를 유지하고 신중한 결정을 내리도록 돕습니다. FXStreet는 바르셀로나 본사와 전 세계 지역에 걸쳐 약 60명의 팀으로 구성되어 있습니다.
더 읽기


