
USD/INR strengthens as US Dollar pares recent losses ahead of Nonfarm Payrolls
작성자 Akhtar Faruqui
게시일: 11 Feb 2026 | 수정일: 11 Feb 2026


인기 기사

USD/INR appreciates on Wednesday after registering modest losses in the previous session. However, the upside of the pair could be restrained as the Indian Rupee (INR) is supported by equity inflows. INR gains may be limited as persistent Greenback demand from local corporates caps the upside.
- USD/INR edges higher despite equity inflows into Indian markets.
- Foreign investors bought ₹694.5 million ($7.67 million) in Indian equities on Tuesday, extending inflows to a third straight session.
- Markets expect Nonfarm Payrolls to show 70,000 jobs added, with Unemployment Rate steady at 4.4% in January.
USD/INR appreciates on Wednesday after registering modest losses in the previous session. However, the upside of the pair could be restrained as the Indian Rupee (INR) is supported by equity inflows. INR gains may be limited as persistent Greenback demand from local corporates caps the upside.
Reuters cited provisional data suggesting foreign investors purchased Indian equities worth 694.5 million rupees ($7.67 million) on Tuesday, marking a third straight session of inflows. Market participants are also monitoring corporate earnings, with the December-quarter reporting season drawing to a close.
The INR found support around the 90.70–90.80 zone on Tuesday, a key level seen as critical to sustaining momentum following the US–India trade deal. Meanwhile, traders highlighted continued dollar demand from importers hedging liabilities, with buying interest increasing whenever the Rupee strengthens.
Investor sentiment strengthened further due to robust domestic liquidity conditions. Substantial liquidity injections by the Reserve Bank of India pushed the overnight borrowing rate nearly 100 basis points below the policy benchmark, generating the largest liquidity surplus in six months. The RBI chose not to conduct short-term liquidity tightening operations, keeping overnight rates low and sustaining the surplus at around INR 3 trillion, supported by government expenditure and ongoing fund infusions.
The US Dollar Index (DXY), which measures the value of the US Dollar (USD) against six major currencies, extends its losses for the fourth successive session and is trading near 96.60 at the time of writing. Traders await the delayed US employment report scheduled to be released on Wednesday for more hints about the US interest rate outlook. Markets expect the Nonfarm Payrolls (NFP) to show 70,000 jobs added in the US economy in January, while the Unemployment Rate is projected to remain steady at 4.4% during the same period.
The US Census Bureau reported Tuesday that US Retail Sales were flat at $735 billion in December, following a 0.6% rise in November and missing expectations for a 0.4% increase. On a YoY basis, Retail Sales rose 2.4%, while total sales for October–December 2025 increased 3.0% (±0.4%) compared with the same period a year earlier.
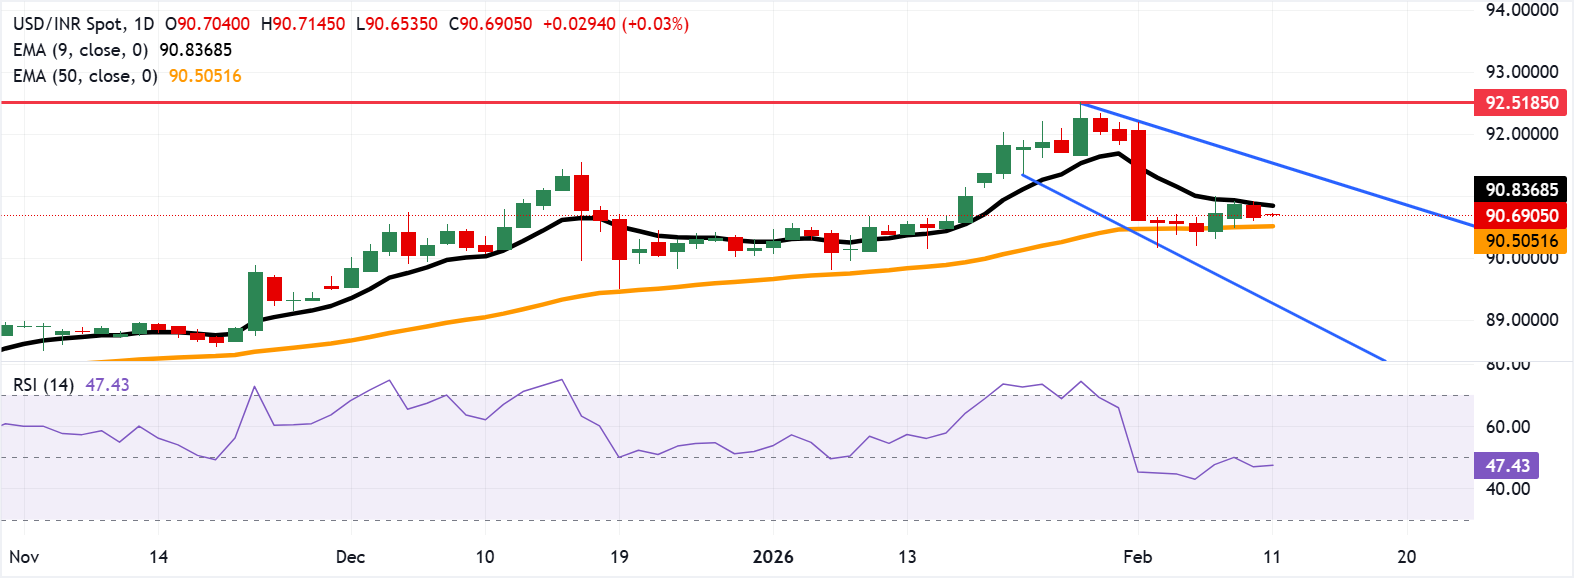
USD/INR falls to near 90.50 after pulling back from nine-day EMA
USD/INR is trading around 90.70 at the time of writing. Daily chart analysis suggests a prevailing bearish bias, with the pair moving within a descending channel. The 14-day Relative Strength Index (RSI) at 47 indicates neutral-to-bearish momentum, easing after recent overbought conditions.
Initial support is located at the 50-day Exponential Moving Average (EMA) near 90.50. A decisive break below this level could weaken medium-term momentum and open the door toward the channel’s lower boundary around 89.30. On the upside, immediate resistance stands at the nine-day EMA near 90.83. A sustained move higher may target the upper boundary of the channel around 91.60, followed by the record high of 92.51 reached on January 28.
US Dollar Price Today
The table below shows the percentage change of US Dollar (USD) against listed major currencies today. US Dollar was the strongest against the Indian Rupee.
| USD | EUR | GBP | JPY | CAD | AUD | NZD | INR | |
|---|---|---|---|---|---|---|---|---|
| USD | -0.14% | -0.17% | -0.70% | -0.19% | -0.44% | -0.18% | 0.14% | |
| EUR | 0.14% | -0.03% | -0.58% | -0.05% | -0.30% | -0.04% | 0.26% | |
| GBP | 0.17% | 0.03% | -0.57% | -0.02% | -0.27% | -0.02% | 0.31% | |
| JPY | 0.70% | 0.58% | 0.57% | 0.55% | 0.29% | 0.55% | 0.86% | |
| CAD | 0.19% | 0.05% | 0.02% | -0.55% | -0.25% | 0.00% | 0.33% | |
| AUD | 0.44% | 0.30% | 0.27% | -0.29% | 0.25% | 0.26% | 0.59% | |
| NZD | 0.18% | 0.04% | 0.02% | -0.55% | -0.00% | -0.26% | 0.31% | |
| INR | -0.14% | -0.26% | -0.31% | -0.86% | -0.33% | -0.59% | -0.31% |
The heat map shows percentage changes of major currencies against each other. The base currency is picked from the left column, while the quote currency is picked from the top row. For example, if you pick the US Dollar from the left column and move along the horizontal line to the Japanese Yen, the percentage change displayed in the box will represent USD (base)/JPY (quote).
Indian Rupee FAQs
The Indian Rupee (INR) is one of the most sensitive currencies to external factors. The price of Crude Oil (the country is highly dependent on imported Oil), the value of the US Dollar – most trade is conducted in USD – and the level of foreign investment, are all influential. Direct intervention by the Reserve Bank of India (RBI) in FX markets to keep the exchange rate stable, as well as the level of interest rates set by the RBI, are further major influencing factors on the Rupee.
The Reserve Bank of India (RBI) actively intervenes in forex markets to maintain a stable exchange rate, to help facilitate trade. In addition, the RBI tries to maintain the inflation rate at its 4% target by adjusting interest rates. Higher interest rates usually strengthen the Rupee. This is due to the role of the ‘carry trade’ in which investors borrow in countries with lower interest rates so as to place their money in countries’ offering relatively higher interest rates and profit from the difference.
Macroeconomic factors that influence the value of the Rupee include inflation, interest rates, the economic growth rate (GDP), the balance of trade, and inflows from foreign investment. A higher growth rate can lead to more overseas investment, pushing up demand for the Rupee. A less negative balance of trade will eventually lead to a stronger Rupee. Higher interest rates, especially real rates (interest rates less inflation) are also positive for the Rupee. A risk-on environment can lead to greater inflows of Foreign Direct and Indirect Investment (FDI and FII), which also benefit the Rupee.
Higher inflation, particularly, if it is comparatively higher than India’s peers, is generally negative for the currency as it reflects devaluation through oversupply. Inflation also increases the cost of exports, leading to more Rupees being sold to purchase foreign imports, which is Rupee-negative. At the same time, higher inflation usually leads to the Reserve Bank of India (RBI) raising interest rates and this can be positive for the Rupee, due to increased demand from international investors. The opposite effect is true of lower inflation.

100만 명이 넘는 사용자가 FXStreet를 통해 실시간 시장 데이터, 차트 도구, 전문가 인사이트, 포렉스 뉴스를 이용합니다. 포괄적인 경제 캘린더와 교육 웨비나는 트레이더가 정보를 유지하고 신중한 결정을 내리도록 돕습니다. FXStreet는 바르셀로나 본사와 전 세계 지역에 걸쳐 약 60명의 팀으로 구성되어 있습니다.
더 읽기


