
USD/JPY Price Forecast: Rebounds towards 159.00 as bulls target 160.00
작성자 Christian Borjon Valencia
게시일: 24 Mar 2026 | 수정일: 24 Mar 2026


인기 기사

The USD/JPY resumes its upward trajectory after testing the 20-day Simple Moving Average (SMA) at 158.10 on Monday, rising towards 159.00, posting gains of over 0.14%.
- USD/JPY rebounds from 20-day SMA, resuming short-term bullish trajectory
- RSI turns higher above 50, signaling renewed upside momentum strength
- Break above 159.00 opens path toward 159.50 and 160.00 levels
The USD/JPY resumes its upward trajectory after testing the 20-day Simple Moving Average (SMA) at 158.10 on Monday, rising towards 159.00, posting gains of over 0.14%.
USD/JPY Price Forecast: Technical Outlook
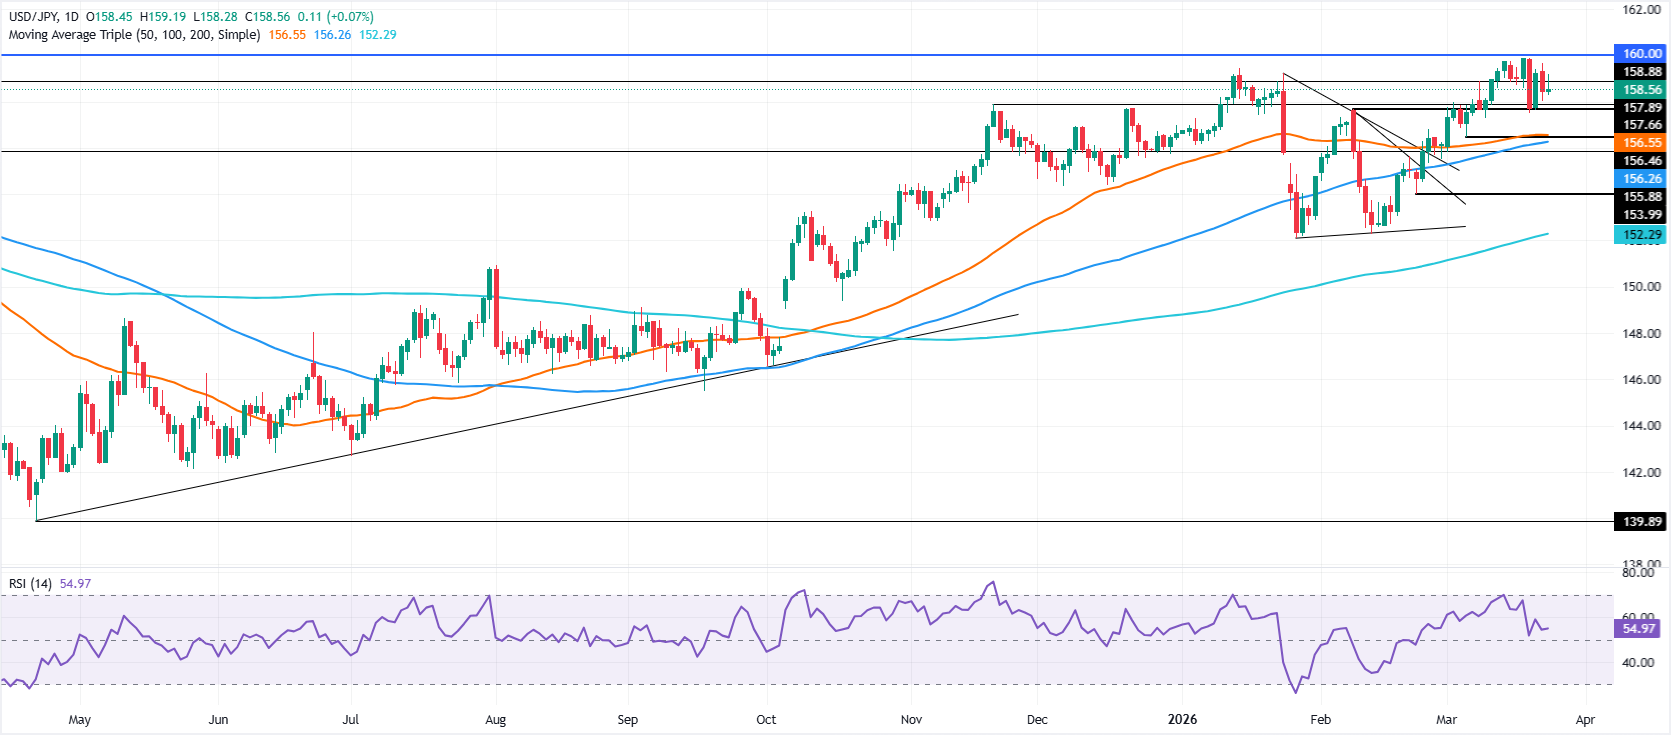
The USD/JPY remains bullish-biased, even though Monday’s reversal opened the door to testing lower prices, such as the March 5 pivot low at 156.45. A day ago, bullish momentum was fading, but as of writing, the Relative Strength Index (RSI) is aiming higher, above its neutral 50-neutral level.
If USD/JPY ends the day above 159.00, expect a test of 159.50, followed by 160.00. Nevertheless, fears of a possible intervention by Japanese authorities could keep the pair trading sideways.
On the downside, the USD/JPY first support would be the 20-day SMA at 158.10. A breach of the latter will expose 157.50, followed by the 157.00 figure, and the March 5 cycle low at 156.45. Once those two levels are taken out, the next support is the 100-day SMA at 156.20.
USD/JPY Price Chart – Daily
Japanese Yen Price This week
The table below shows the percentage change of Japanese Yen (JPY) against listed major currencies this week. Japanese Yen was the strongest against the Canadian Dollar.
| USD | EUR | GBP | JPY | CAD | AUD | NZD | CHF | |
|---|---|---|---|---|---|---|---|---|
| USD | -0.70% | -0.83% | -0.52% | 0.20% | -0.11% | -0.45% | -0.08% | |
| EUR | 0.70% | -0.12% | 0.18% | 0.92% | 0.58% | 0.27% | 0.63% | |
| GBP | 0.83% | 0.12% | 0.26% | 1.04% | 0.73% | 0.38% | 0.68% | |
| JPY | 0.52% | -0.18% | -0.26% | 0.70% | 0.41% | 0.05% | 0.35% | |
| CAD | -0.20% | -0.92% | -1.04% | -0.70% | -0.29% | -0.65% | -0.29% | |
| AUD | 0.11% | -0.58% | -0.73% | -0.41% | 0.29% | -0.34% | -0.04% | |
| NZD | 0.45% | -0.27% | -0.38% | -0.05% | 0.65% | 0.34% | 0.30% | |
| CHF | 0.08% | -0.63% | -0.68% | -0.35% | 0.29% | 0.04% | -0.30% |
The heat map shows percentage changes of major currencies against each other. The base currency is picked from the left column, while the quote currency is picked from the top row. For example, if you pick the Japanese Yen from the left column and move along the horizontal line to the US Dollar, the percentage change displayed in the box will represent JPY (base)/USD (quote).

100만 명이 넘는 사용자가 FXStreet를 통해 실시간 시장 데이터, 차트 도구, 전문가 인사이트, 포렉스 뉴스를 이용합니다. 포괄적인 경제 캘린더와 교육 웨비나는 트레이더가 정보를 유지하고 신중한 결정을 내리도록 돕습니다. FXStreet는 바르셀로나 본사와 전 세계 지역에 걸쳐 약 60명의 팀으로 구성되어 있습니다.
더 읽기


