
USD/JPY Price Forecast: Reclaims 158.00 as bulls target intervention area
작성자 Christian Borjon Valencia
수정됨: 14 May 2026


인기 기사

USD/JPY rallies past the 158.00 figure and also above the 20-day Simple Moving Average of 158.23, up by over 0.32% on Thursday as buyers target the 50-day SMA at 158.75 as the next key resistance.
- USD/JPY clears 20-day SMA, confirming buyers are gaining traction.
- RSI breaks above 50, signaling renewed bullish momentum strength.
- Move past 158.75 exposes 159.00 and intervention risk zone.
USD/JPY rallies past the 158.00 figure and also above the 20-day Simple Moving Average of 158.23, up by over 0.32% on Thursday as buyers target the 50-day SMA at 158.75 as the next key resistance.
USD/JPY Price Forecast: Technical outlook
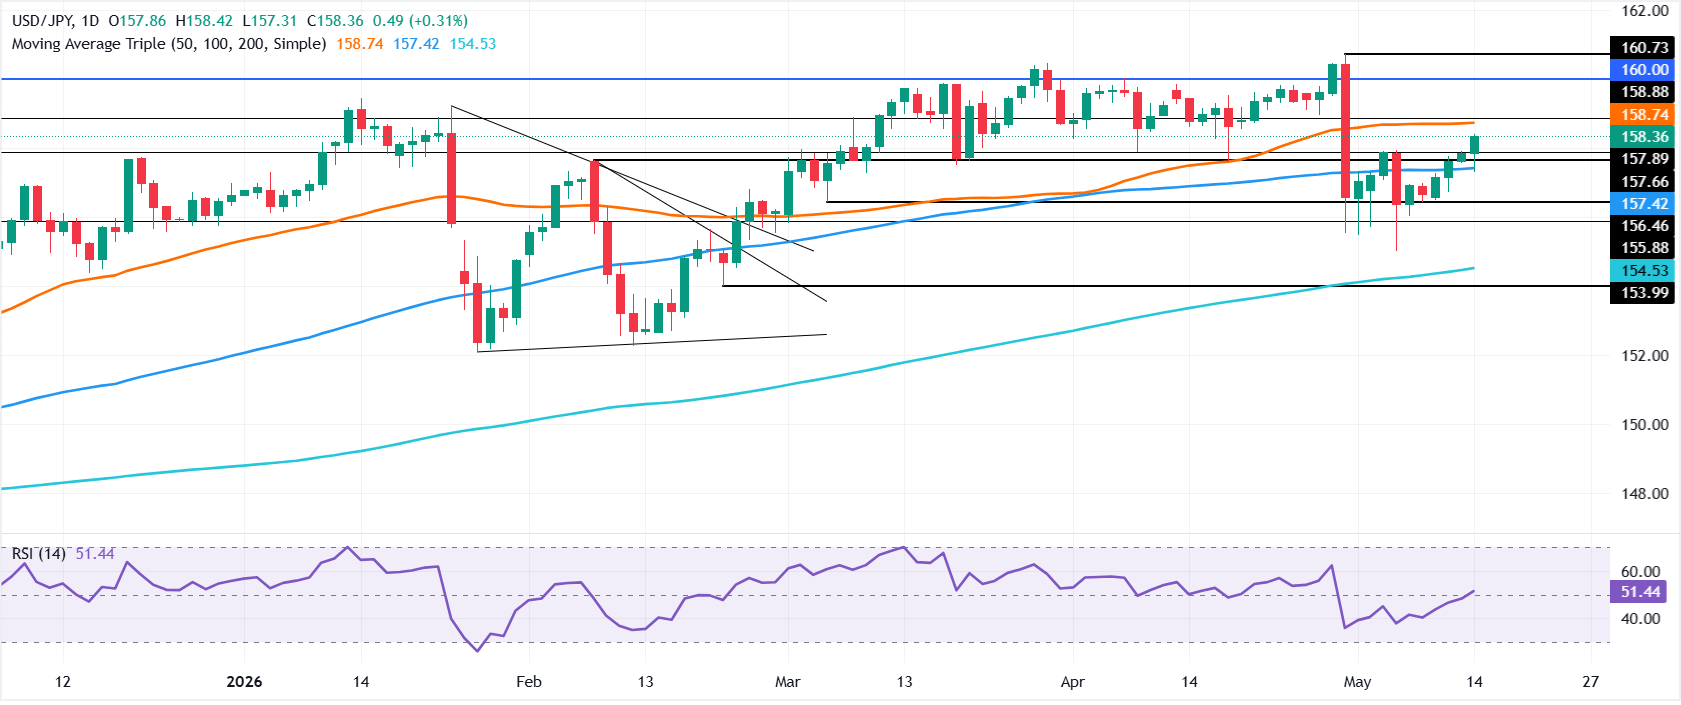
Price action shows that buyers are moving in, as USD/JPY printed a higher high over the last four trading days, clearing the path to reclaim 158.00. Momentum is bullish, as seen in the Relative Strength Index (RSI), which has cleared the 50-neutral level, an indication that buyers are gaining steam.
On the upside, the next resistance is the 50-day SMA, which lies ahead of the 159.00 figure. Traders should be aware that the pair is near the Japanese authorities' intervention zone, so a move within the 159.00-160.00 area would open the door for renewed action by the Bank of Japan (BoJ).
Downwards, if USD/JPY drops below 158.00, this clears the path to challenge the 100-day SMA at 157.43. On further weakness, the 157.00 milestone emerges as the next key support, followed by the May 6 cycle low of 155.03.
USD/JPY Price Chart – Daily
Japanese Yen Price This week
The table below shows the percentage change of Japanese Yen (JPY) against listed major currencies this week. Japanese Yen was the strongest against the British Pound.
| USD | EUR | GBP | JPY | CAD | AUD | NZD | CHF | |
|---|---|---|---|---|---|---|---|---|
| USD | 0.67% | 1.16% | 1.09% | 0.26% | 0.01% | 0.43% | 0.74% | |
| EUR | -0.67% | 0.48% | 0.48% | -0.42% | -0.66% | -0.28% | 0.07% | |
| GBP | -1.16% | -0.48% | -0.51% | -0.92% | -1.16% | -0.75% | -0.40% | |
| JPY | -1.09% | -0.48% | 0.51% | -0.88% | -1.09% | -0.67% | -0.31% | |
| CAD | -0.26% | 0.42% | 0.92% | 0.88% | -0.17% | 0.22% | 0.48% | |
| AUD | -0.01% | 0.66% | 1.16% | 1.09% | 0.17% | 0.42% | 0.74% | |
| NZD | -0.43% | 0.28% | 0.75% | 0.67% | -0.22% | -0.42% | 0.32% | |
| CHF | -0.74% | -0.07% | 0.40% | 0.31% | -0.48% | -0.74% | -0.32% |
The heat map shows percentage changes of major currencies against each other. The base currency is picked from the left column, while the quote currency is picked from the top row. For example, if you pick the Japanese Yen from the left column and move along the horizontal line to the US Dollar, the percentage change displayed in the box will represent JPY (base)/USD (quote).

100만 명이 넘는 사용자가 FXStreet를 통해 실시간 시장 데이터, 차트 도구, 전문가 인사이트, 포렉스 뉴스를 이용합니다. 포괄적인 경제 캘린더와 교육 웨비나는 트레이더가 정보를 유지하고 신중한 결정을 내리도록 돕습니다. FXStreet는 바르셀로나 본사와 전 세계 지역에 걸쳐 약 60명의 팀으로 구성되어 있습니다.
더 읽기


