
USD/JPY Price Forecast: Slips below 155.00, upper descending channel pattern
작성자 Akhtar Faruqui
게시일: 2 Feb 2026 | 수정일: 2 Feb 2026


인기 기사

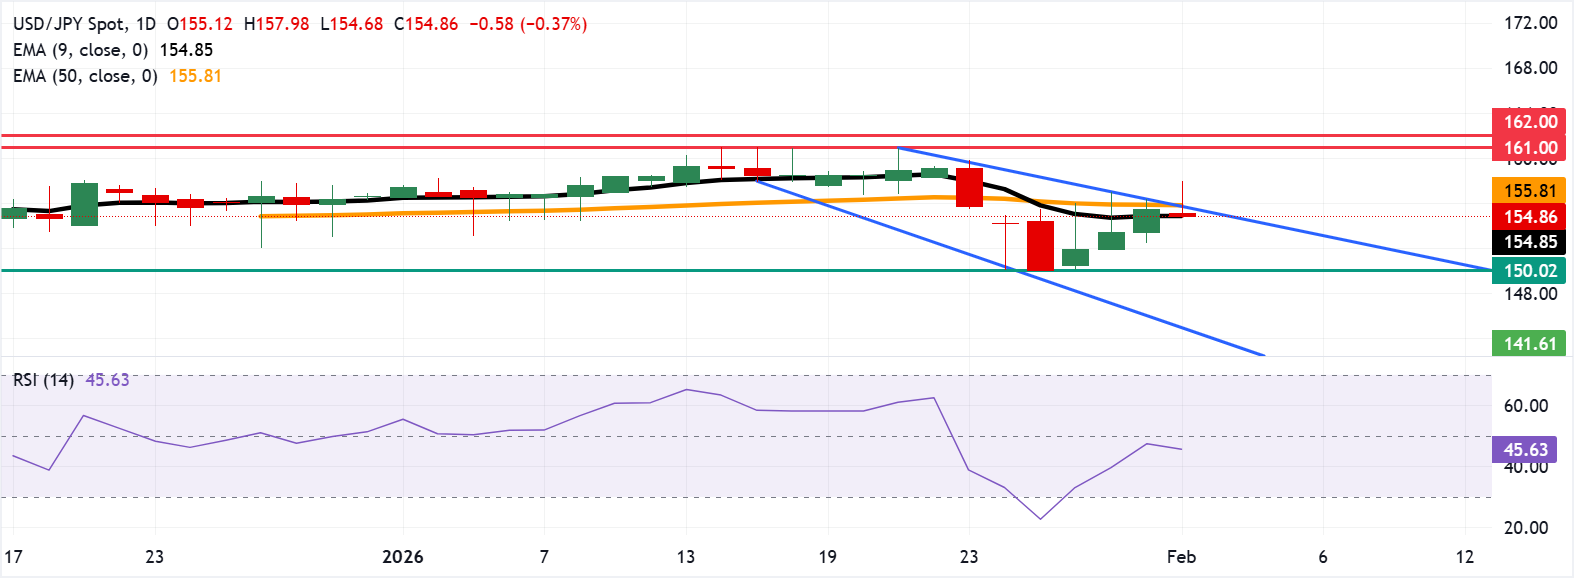
USD/JPY loses ground after three days of gains, trading around 154.90 during the European hours on Monday. On the daily chart, technical analysis indicates a potential bullish reversal as the pair is testing the upper boundary of the descending channel pattern.
- USD/JPY tests the immediate support at the nine-day EMA of 154.85.
- The 14-day Relative Strength Index near 46 suggests neutral conditions and stabilizing momentum.
- The primary resistance lies at the upper boundary of the descending channel around 156.00.
USD/JPY loses ground after three days of gains, trading around 154.90 during the European hours on Monday. On the daily chart, technical analysis indicates a potential bullish reversal as the pair is testing the upper boundary of the descending channel pattern.
The USD/JPY pair steadies around the nine-day Exponential Moving Average (EMA) and remains capped beneath the 50-day EMA at 155.63. The 50-day EMA has begun to roll over, limiting recovery attempts. A daily close above the 50-day EMA could open room toward resistance, while failure to reclaim the short-term average keeps the tone heavy.
The 14-day Relative Strength Index (RSI) at 46 (neutral) points to stabilizing momentum. RSI recovering from 23 toward the mid-40s suggests fading bearish pressure; a move above 50 would improve the setup.
Near-term trend bias is fragile as the nine-day EMA has flattened. A close below the short-term average at 154.85 would extend the corrective phase toward the three-month low at 150.02, reached on January 27, followed by the lower boundary of the descending channel around 149.20.
The immediate resistance lies at the upper boundary of the descending channel around 156.00. A break above the channel would cause the emergence of the bullish bias and support the pair to explore the region around the six-month high of 161.00, followed by the all-time of 162.00, recorded in July 2024.
(The technical analysis of this story was written with the help of an AI tool.)
Japanese Yen Price Today
The table below shows the percentage change of Japanese Yen (JPY) against listed major currencies today. Japanese Yen was the strongest against the Australian Dollar.
| USD | EUR | GBP | JPY | CAD | AUD | NZD | CHF | |
|---|---|---|---|---|---|---|---|---|
| USD | -0.05% | -0.09% | 0.11% | 0.11% | 0.15% | 0.10% | 0.06% | |
| EUR | 0.05% | -0.03% | 0.18% | 0.18% | 0.21% | 0.16% | 0.11% | |
| GBP | 0.09% | 0.03% | 0.19% | 0.21% | 0.25% | 0.19% | 0.15% | |
| JPY | -0.11% | -0.18% | -0.19% | 0.02% | 0.05% | 0.00% | -0.04% | |
| CAD | -0.11% | -0.18% | -0.21% | -0.02% | 0.04% | -0.02% | -0.06% | |
| AUD | -0.15% | -0.21% | -0.25% | -0.05% | -0.04% | -0.05% | -0.10% | |
| NZD | -0.10% | -0.16% | -0.19% | -0.00% | 0.02% | 0.05% | -0.04% | |
| CHF | -0.06% | -0.11% | -0.15% | 0.04% | 0.06% | 0.10% | 0.04% |
The heat map shows percentage changes of major currencies against each other. The base currency is picked from the left column, while the quote currency is picked from the top row. For example, if you pick the Japanese Yen from the left column and move along the horizontal line to the US Dollar, the percentage change displayed in the box will represent JPY (base)/USD (quote).

100만 명이 넘는 사용자가 FXStreet를 통해 실시간 시장 데이터, 차트 도구, 전문가 인사이트, 포렉스 뉴스를 이용합니다. 포괄적인 경제 캘린더와 교육 웨비나는 트레이더가 정보를 유지하고 신중한 결정을 내리도록 돕습니다. FXStreet는 바르셀로나 본사와 전 세계 지역에 걸쳐 약 60명의 팀으로 구성되어 있습니다.
더 읽기


