
Worldcoin Price Forecast: WLD tests breakout rally as market-wide downside pressure eases
작성자 Vishal Dixit
수정됨: 14 Apr 2026


인기 기사

Worldcoin (WLD) extends gains above $0.3000 at press time on Tuesday after a roughly 8% rise the previous day. The recovery aligns with the broader market's rising risk appetite linked to the US-Iran peace negotiations, prompting traders to turn to WLD derivatives.
- Worldcoin extends gains above $0.30 on Tuesday, testing the breakout of a descending resistance trendline.
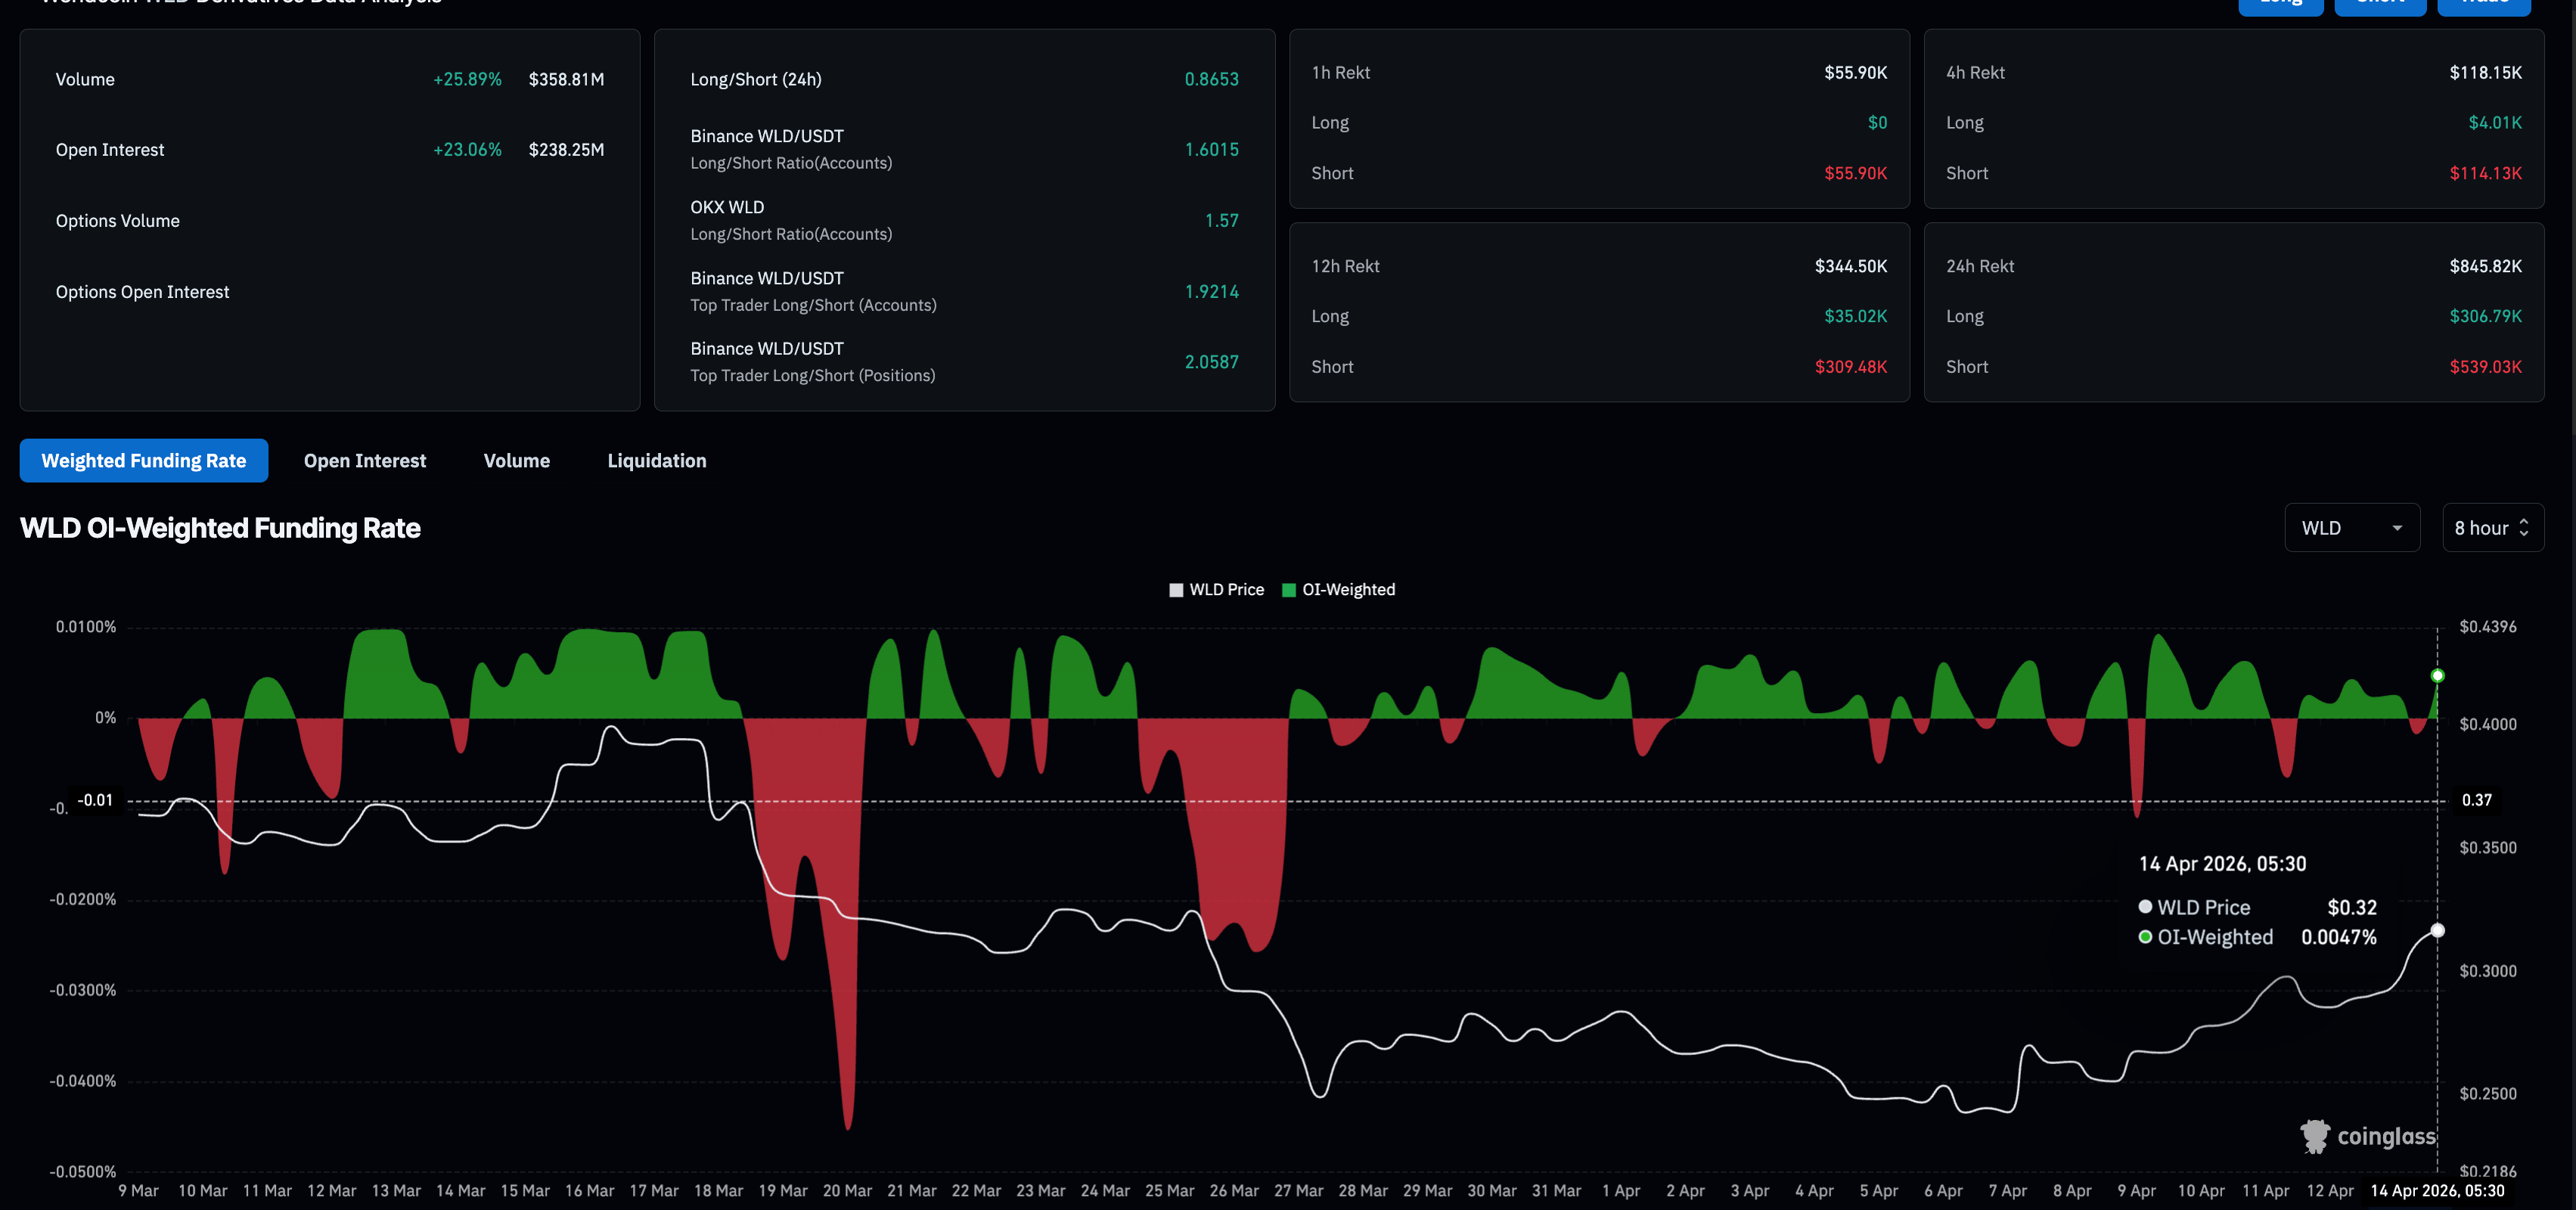
- Derivatives data shows renewed demand for Worldcoin, with Open Interest rising over 20% in 24 hours.
- Worldcoin must reclaim the 50-day EMA to extend the rally toward $0.40.
Worldcoin (WLD) extends gains above $0.3000 at press time on Tuesday after a roughly 8% rise the previous day. The recovery aligns with the broader market's rising risk appetite linked to the US-Iran peace negotiations, prompting traders to turn to WLD derivatives. Technically, the recovery run in Worldcoin tests the breakout of a falling wedge pattern, which could extend gains toward $0.4000.
Worldcoin regains strength as the broader market recovers
Worldcoin shows a steady recovery since the announcement of US-Iran peace talks on April 7, resulting in 15% gains last week. CoinGlass data shows a 23% rise in WLD futures Open Interest (OI) over the last 24 hours, suggesting a positional buildup amid growing anticipation among traders. Meanwhile, the OI-weighted funding rate turns positive to 0.0047%, from -0.0017% the previous day, suggesting near-term buy-side inclination.
Worldcoin is poised for a breakout rally
Worldcoin holds a near-term bullish bias with a recovery within a falling wedge pattern on the daily chart. The 50-day Exponential Moving Average (EMA) at $0.3259 is the first overhead cap, with the 23.6% Fibonacci retracement of the downswing from $0.6539 to $0.2389 at $0.3368, reinforcing a nearby resistance band.
As long as price trades beneath this moving average and Fibonacci barrier, rallies are likely to be treated as corrective within a broader bearish context, with sellers expected to fade strength into the clustered resistance levels above. A break above this zone could target the 100-day EMA at $0.4141 and the 50% retracement level at $0.4460.
The Relative Strength Index around 56 and a positive, rising Moving Average Convergence Divergence (MACD) histogram hint that short-term upside attempts could persist within this still-dominant downtrend structure.
On the downside, initial support is seen near the prior trendline break area around $0.3151; a daily close back below this level would expose the recent swing low zone anchored by the 0.0% Fibonacci level at $0.2389.
(The technical analysis of this story was written with the help of an AI tool.)

100만 명이 넘는 사용자가 FXStreet를 통해 실시간 시장 데이터, 차트 도구, 전문가 인사이트, 포렉스 뉴스를 이용합니다. 포괄적인 경제 캘린더와 교육 웨비나는 트레이더가 정보를 유지하고 신중한 결정을 내리도록 돕습니다. FXStreet는 바르셀로나 본사와 전 세계 지역에 걸쳐 약 60명의 팀으로 구성되어 있습니다.
더 읽기


