
WTI Price Forecast: RSI points lower as prices remain below key SMAs
작성자 Vishal Chaturvedi
수정됨: 12 Jun 2026


인기 기사

West Texas Intermediate (WTI) pares some part of earlier losses on Friday as markets seek confirmation of a possible US-Iran agreement, prompting traders to refrain from placing aggressive bearish bets.
- WTI recovers from its lowest level since April 17 as traders await clarity on a possible US-Iran agreement.
- Iran says the proposed agreement does not require Tehran to transfer control of the Strait of Hormuz.
- Technically, WTI's near-term tone remains bearish, with RSI signaling weak upside momentum.
West Texas Intermediate (WTI) pares some part of earlier losses on Friday as markets seek confirmation of a possible US-Iran agreement, prompting traders to refrain from placing aggressive bearish bets.
At the time of writing, WTI trades around $83.80 per barrel after recovering from an intraday low of $81.80, its lowest level since April 17.
Crude Oil prices came under heavy selling pressure on Thursday after US President Donald Trump said the US and Iran could sign a peace deal as soon as this weekend that would reopen the Strait of Hormuz, a critical chokepoint for around 20% of global Oil flows.
However, questions remain over the future management of the Strait of Hormuz. According to IRNA, "the future administration of the Strait will be resolved as a regional matter through dialogue and joint decision-making between Tehran and Oman."
IRNA also reported that the proposed agreement with the United States does not require Iran to transfer control of the strategic waterway.
Until the details of any agreement become clearer, a geopolitical risk premium is likely to remain embedded in Oil prices. However, the technical outlook remains fragile, with prices trading below key moving averages and momentum indicators pointing lower.
Technical analysis:
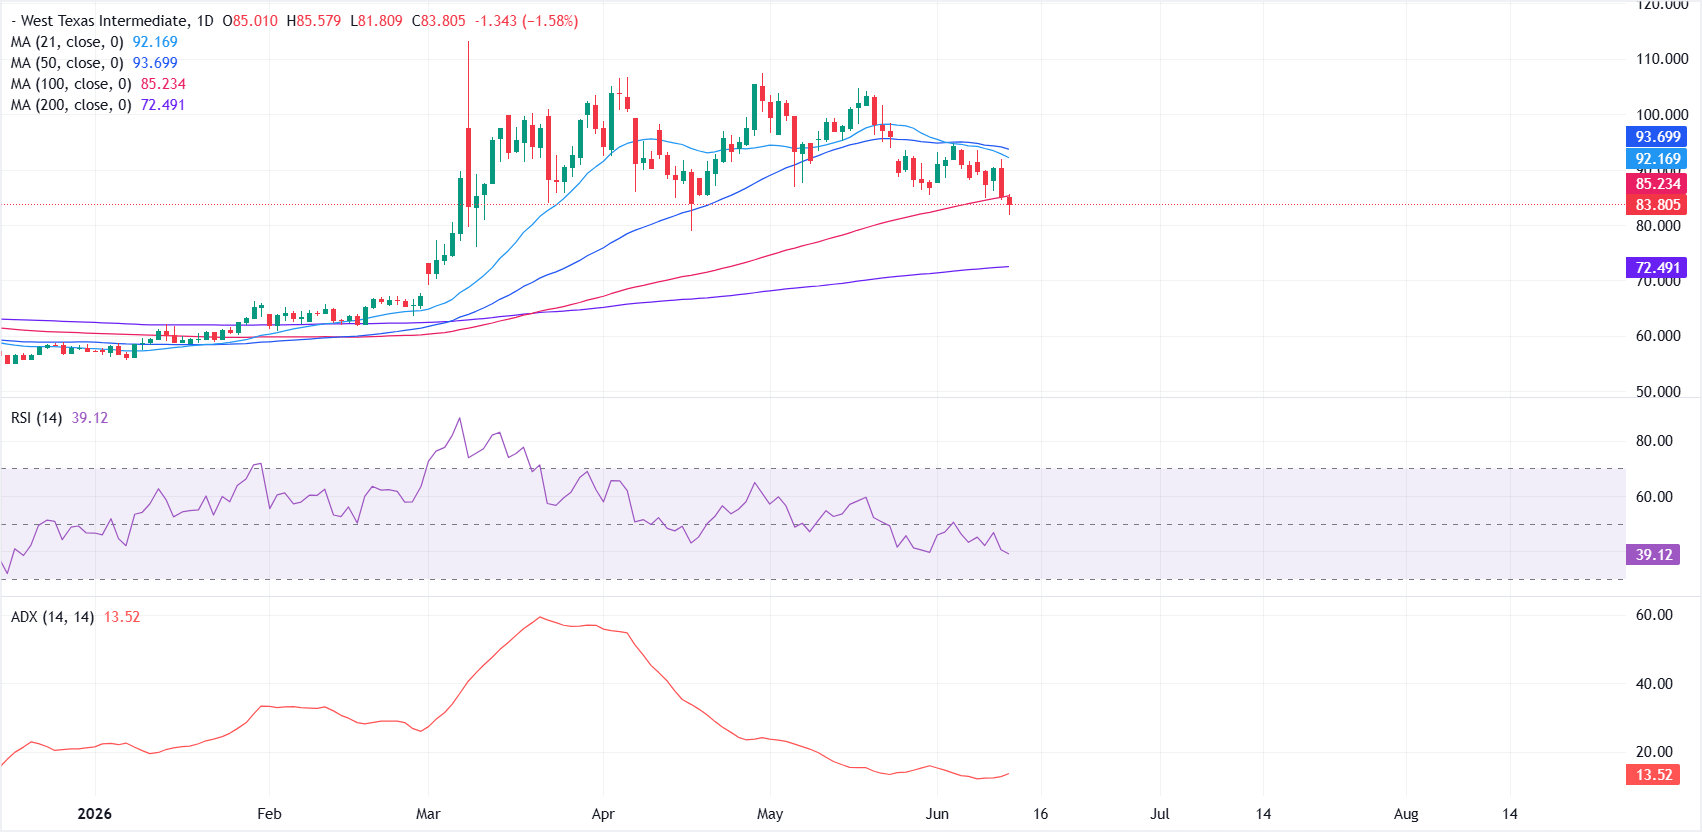
WTI retains a bearish near-term bias, with price holding below the 100-, 50- and 21-day simple moving averages (SMAs) clustered between roughly $85 and $94, which cap any recovery attempts for now.
The Relative Strength Index (RSI) on the daily chart is near 39 and keeps a downside bias in momentum, while the subdued Average Directional Index (ADX) around 14 hints at a weak directional trend.
On the topside, initial resistance is seen at the 100-day SMA at $85.23, with further barriers at the 21-day SMA near $92.17 and the 50-day SMA around $93.70, where sellers would likely re-emerge if a bounce extends.
On the downside, immediate support is seen at the $80 psychological mark near the lower end of the war-driven trading range, followed by the 200-day SMA at $72.49.

100만 명이 넘는 사용자가 FXStreet를 통해 실시간 시장 데이터, 차트 도구, 전문가 인사이트, 포렉스 뉴스를 이용합니다. 포괄적인 경제 캘린더와 교육 웨비나는 트레이더가 정보를 유지하고 신중한 결정을 내리도록 돕습니다. FXStreet는 바르셀로나 본사와 전 세계 지역에 걸쳐 약 60명의 팀으로 구성되어 있습니다.
더 읽기


