
XRP and XLM outlook: Bears in control of the momentum
작성자 Manish Chhetri
수정됨: 19 May 2026


인기 기사

Ripple (XRP) and Stellar (XLM) remain under pressure on Tuesday as bearish momentum continues to dominate after correcting nearly 5% and 12%, respectively, in the previous week. XRP and XLM both trade beneath all major Exponential Moving Averages (EMAs), reflecting sustained selling pressure.
- XRP trades below the 50-day EMA at $1.41, suggesting a downside move ahead.
- XLM extends its decline beneath all major EMAs, keeping selling pressure intact.
- The momentum indicators for both altcoins remain bearish, and derivatives traders increasingly build short positions.
Ripple (XRP) and Stellar (XLM) remain under pressure on Tuesday as bearish momentum continues to dominate after correcting nearly 5% and 12%, respectively, in the previous week. XRP and XLM both trade beneath all major Exponential Moving Averages (EMAs), reflecting sustained selling pressure. In addition, weakening momentum indicators and rising short positioning among traders for these altcoins suggest the downside bias could persist in the near term.
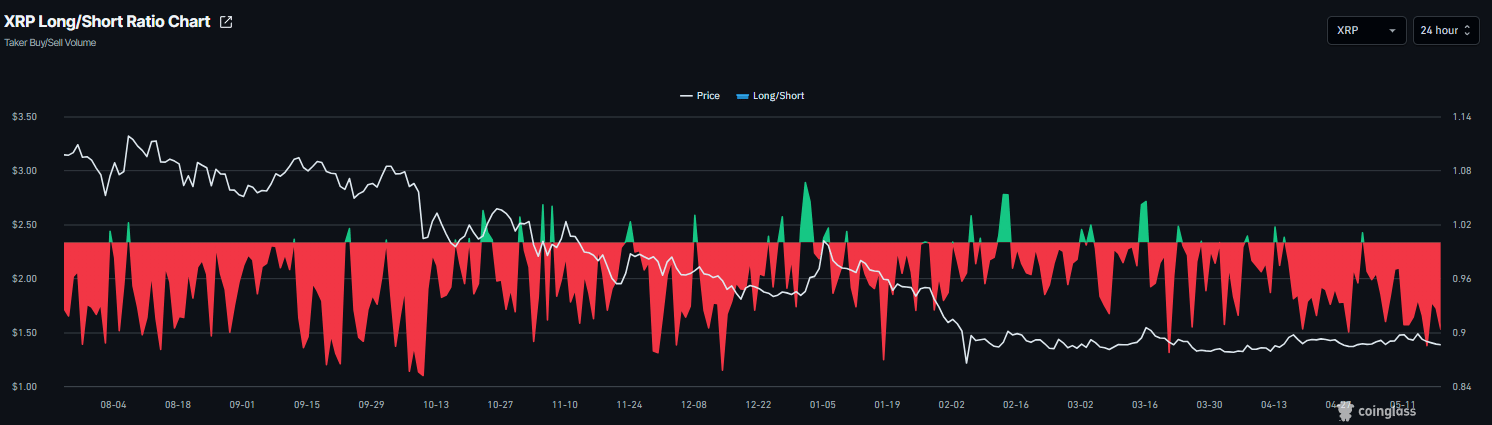
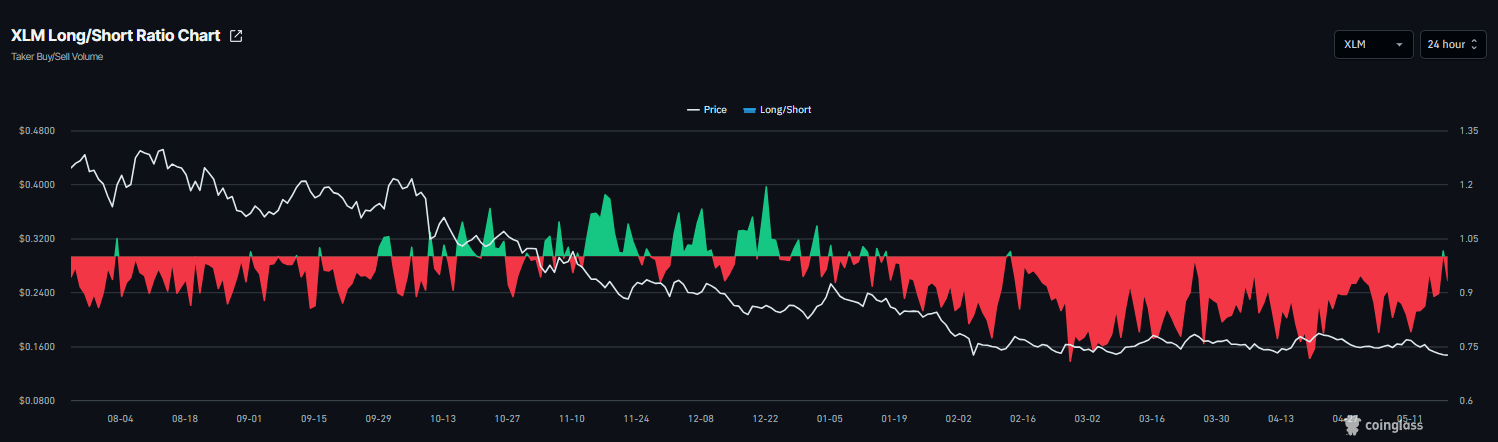
Short bets rise among XRP and XLM traders
CoinGlass’ long-to-short ratios for XRP and XLM are 0.90 and 0.93, respectively, on Tuesday, both near their lowest levels over the month. This ratio, below 1, reflects bearish sentiment in the market, as more traders are betting the asset’s price will fall.
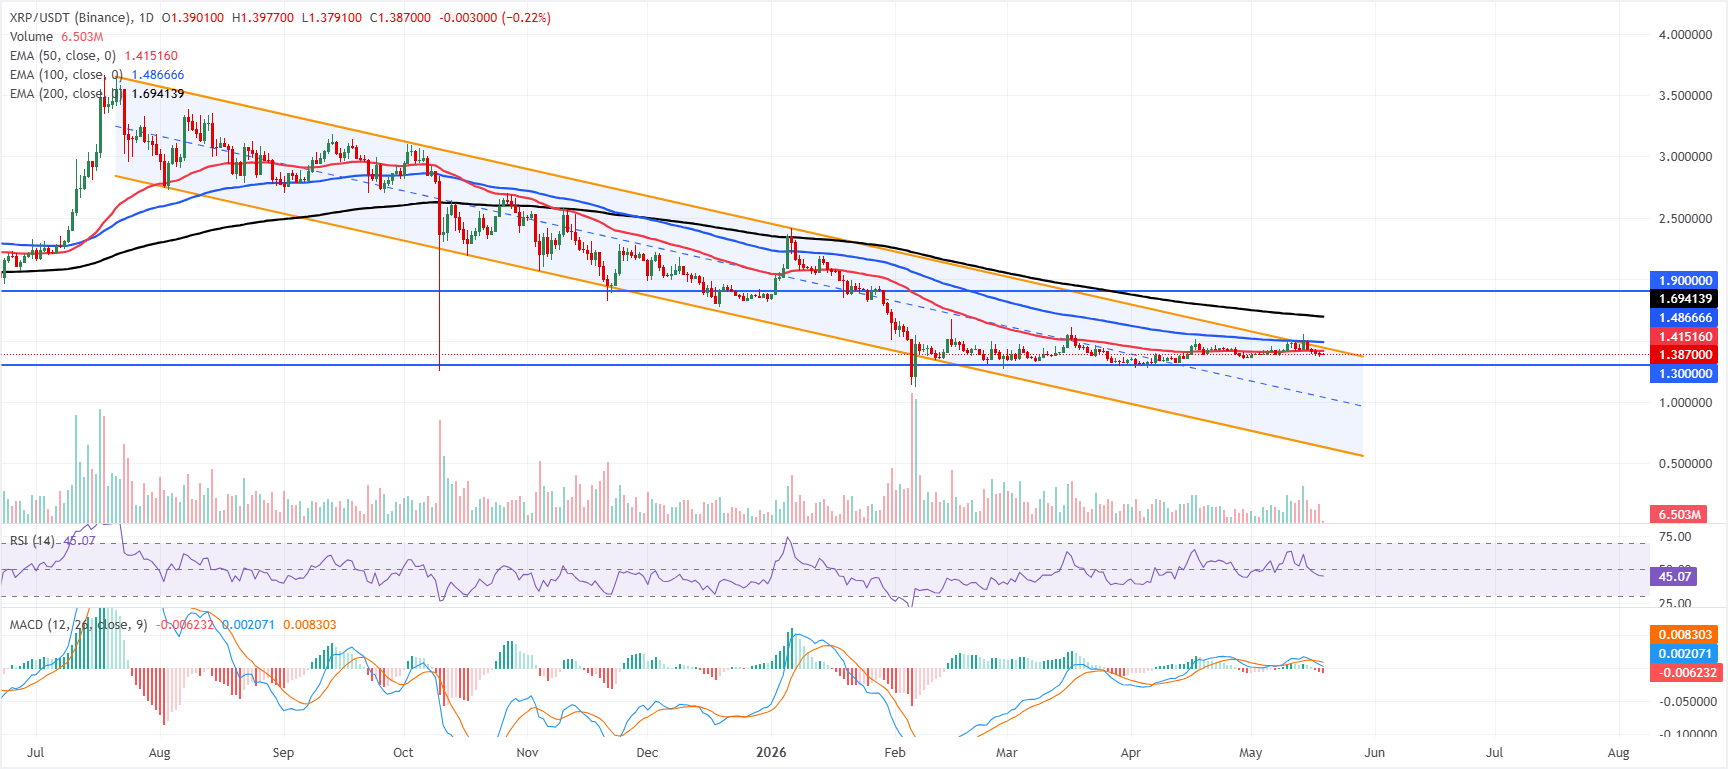
XRP technical outlook: Deeper correction ahead
XRP is trading at $1.387, maintaining a bearish near‑term bias as it trades beneath the main EMAs. The 50‑day EMA at $1.415 is the first cap overhead, with the upper boundary of the prevailing downward parallel channel around $1.442 reinforcing supply above spot. The 100‑day and 200‑day EMAs, at $1.486 and $1.694, respectively, extend a broader topside ceiling, while a Relative Strength Index (RSI) reading near 45 and a negative Moving Average Convergence Divergence (MACD) histogram both hint that downside pressure still outweighs buying interest.
On the downside, the next notable cushion aligns with horizontal support near $1.300, where buyers could attempt to slow the decline if selling resumes.
On the topside, immediate resistance is seen at the 50‑day EMA at $1.415, followed by the channel boundary around $1.442; a daily close above these levels would be needed to ease the current bearish tone and expose the higher EMA barriers at $1.486 and $1.694, ahead of the more distant horizontal resistance around $1.900.
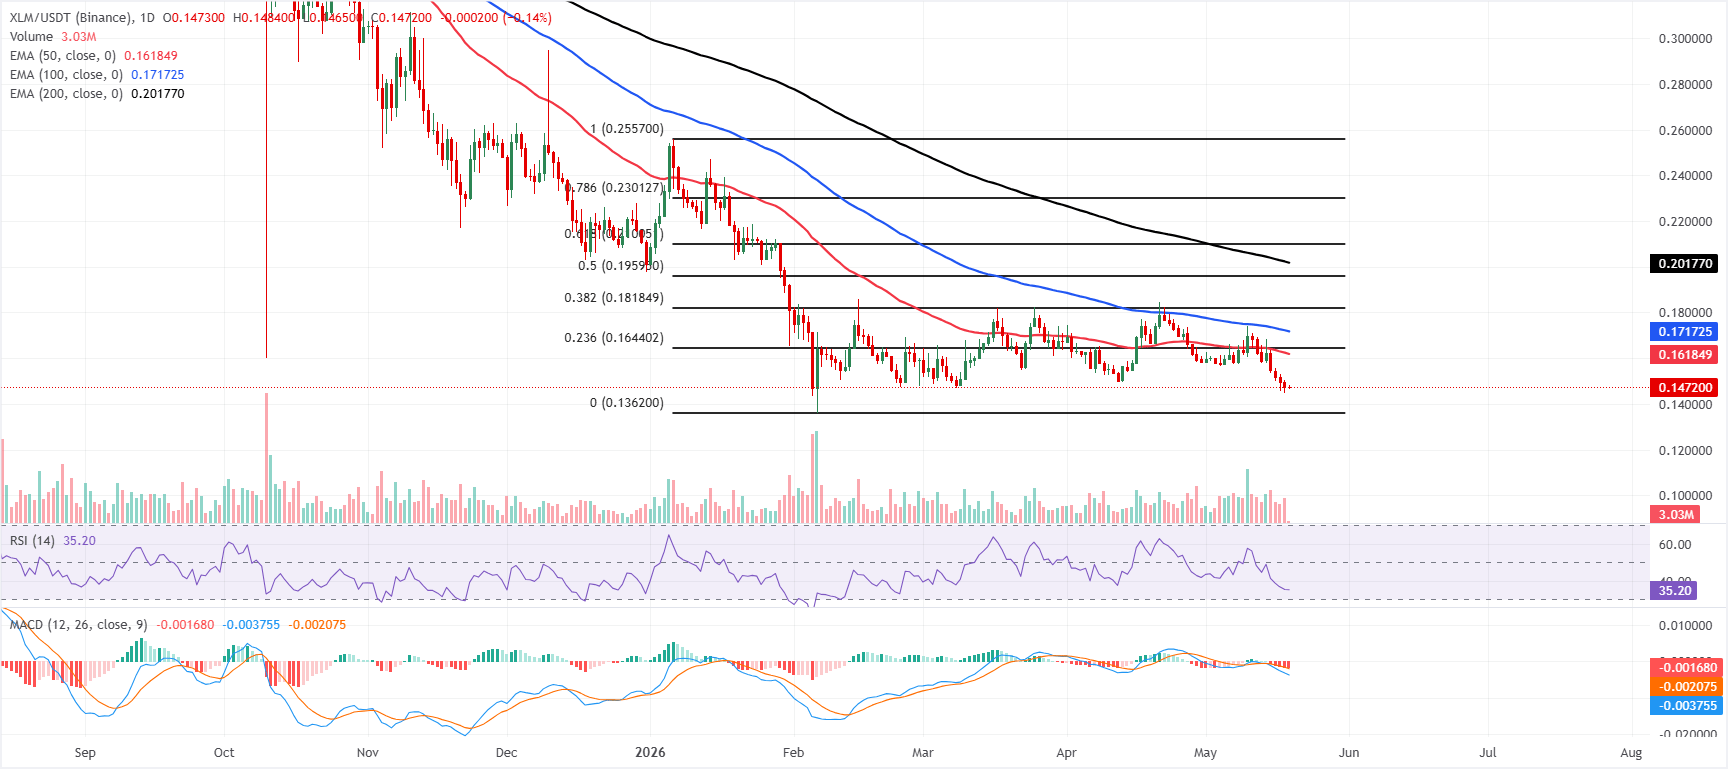
XLM technical outlook: Slips below key EMAs
Stellar price trades at $0.147, extending its slide beneath all the key EMAs and keeping the near‑term bias bearish. The 50‑day EMA at $0.161, together with the 23.6% Fibonacci retracement of the latest cycle at $0.164 and the 100‑day EMA at $0.171, now sit overhead and suggest the pair remains capped while below this cluster.
The RSI on the daily chart at 35 hovers just above oversold territory, and the MACD indicator remains negative, both reinforcing persistent downside pressure rather than a completed bottom.
On the topside, initial resistance is located at the 50‑day EMA near $0.161, followed by the 23.6% Fibonacci retracement at $0.164; a daily close above these would be needed to ease immediate selling pressure. Further up, the 100‑day EMA at $0.171 and the 38.2% Fibonacci retracement at $0.181 precede a more substantial barrier at the 50% retracement level near $0.195, with the 200‑day EMA at $0.201 reinforcing broader bearish control while price holds below it.
On the downside, the only nearby structural support is the February low at $0.136, where buyers could attempt to stem the decline if bearish momentum persists.
(The technical analysis of this story was written with the help of an AI tool.)

100만 명이 넘는 사용자가 FXStreet를 통해 실시간 시장 데이터, 차트 도구, 전문가 인사이트, 포렉스 뉴스를 이용합니다. 포괄적인 경제 캘린더와 교육 웨비나는 트레이더가 정보를 유지하고 신중한 결정을 내리도록 돕습니다. FXStreet는 바르셀로나 본사와 전 세계 지역에 걸쳐 약 60명의 팀으로 구성되어 있습니다.
더 읽기


