
XRP and XLM outlook: Momentum indicators signal growing strength as bulls eye breakout
작성자 Manish Chhetri
수정됨: 12 May 2026


인기 기사

Ripple (XRP) and Stellar (XLM) prices trade cautiously at the time of writing on Tuesday, with improving momentum indicators and supportive on-chain metrics keeping hopes alive for an upside breakout for both altcoins.
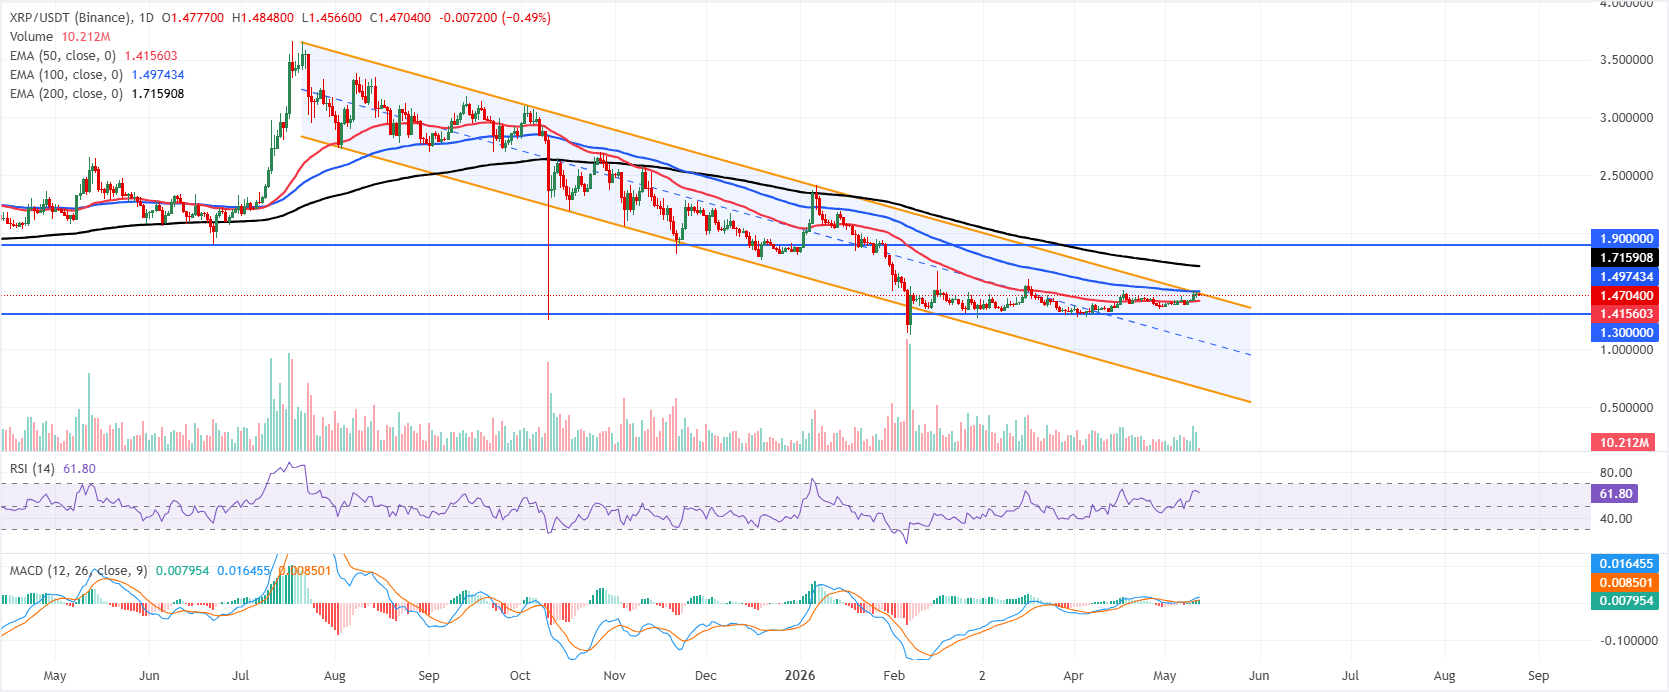
- XRP nears the upper boundary of the downward parallel channel at $1.48, a breakout suggests a bullish move ahead.
- XLM consolidates between 50-day and 100-day EMAs, signaling indecision ahead of a directional move.
- On-chain data shows mild bullish bias for both altcoins, while momentum indicators suggest bullish strength is gradually building.
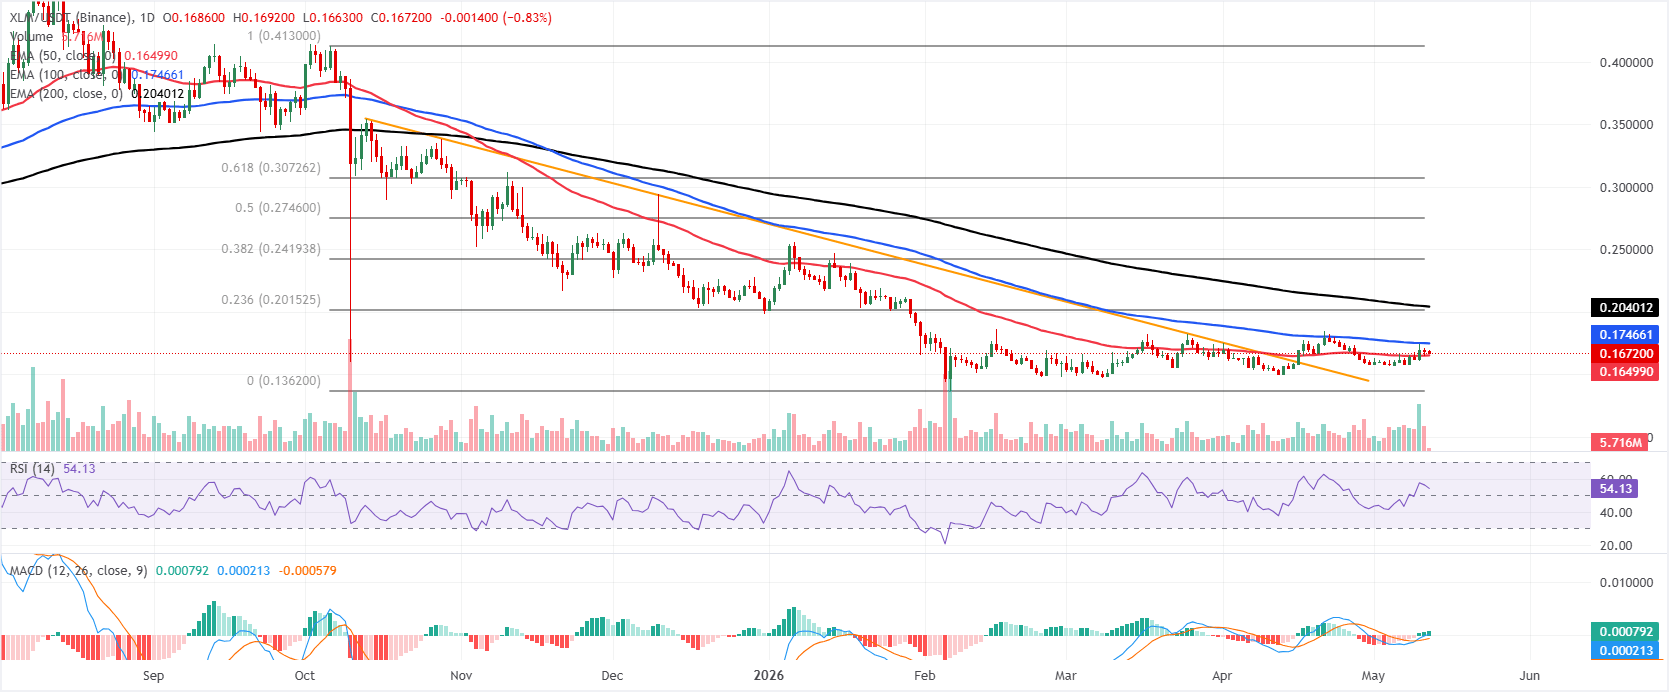
Ripple (XRP) and Stellar (XLM) prices trade cautiously at the time of writing on Tuesday, with improving momentum indicators and supportive on-chain metrics keeping hopes alive for an upside breakout for both altcoins. XRP is testing the upper boundary of its descending parallel channel, where a break above suggests a fresh rally. Meanwhile, XLM continues to consolidate between its key 50-day and 100-day Exponential Moving Averages (EMAs), signaling indecision ahead of a directional move.
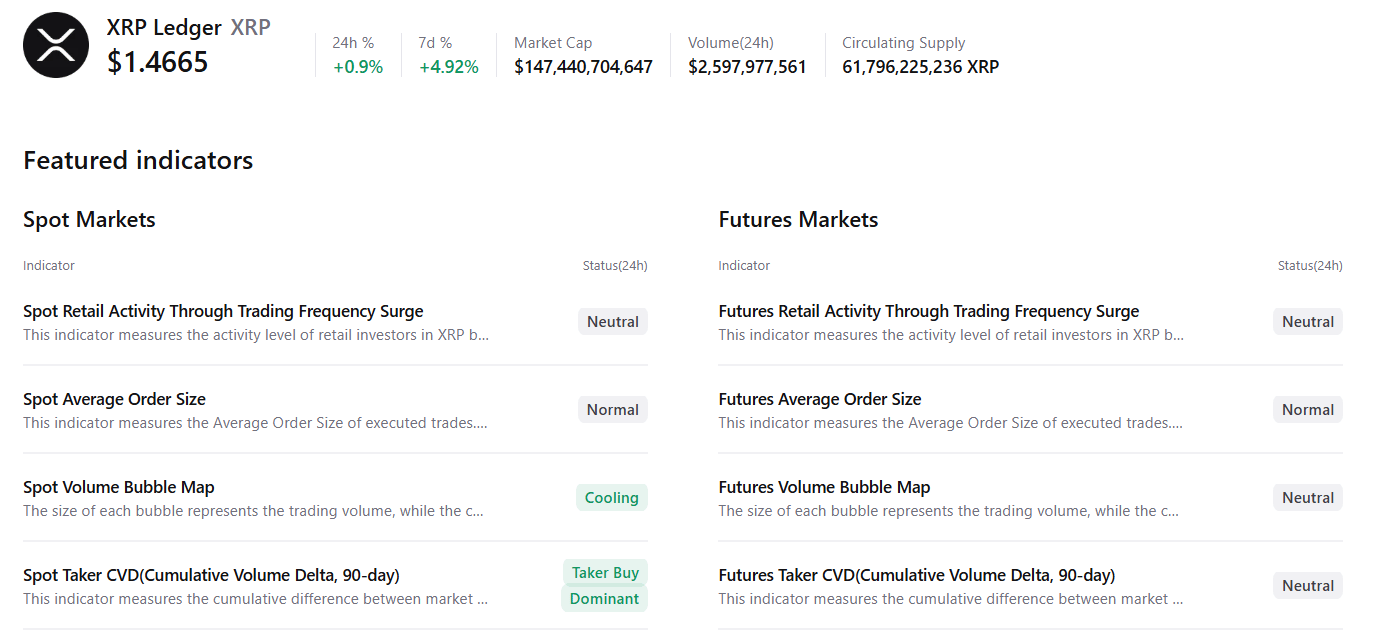
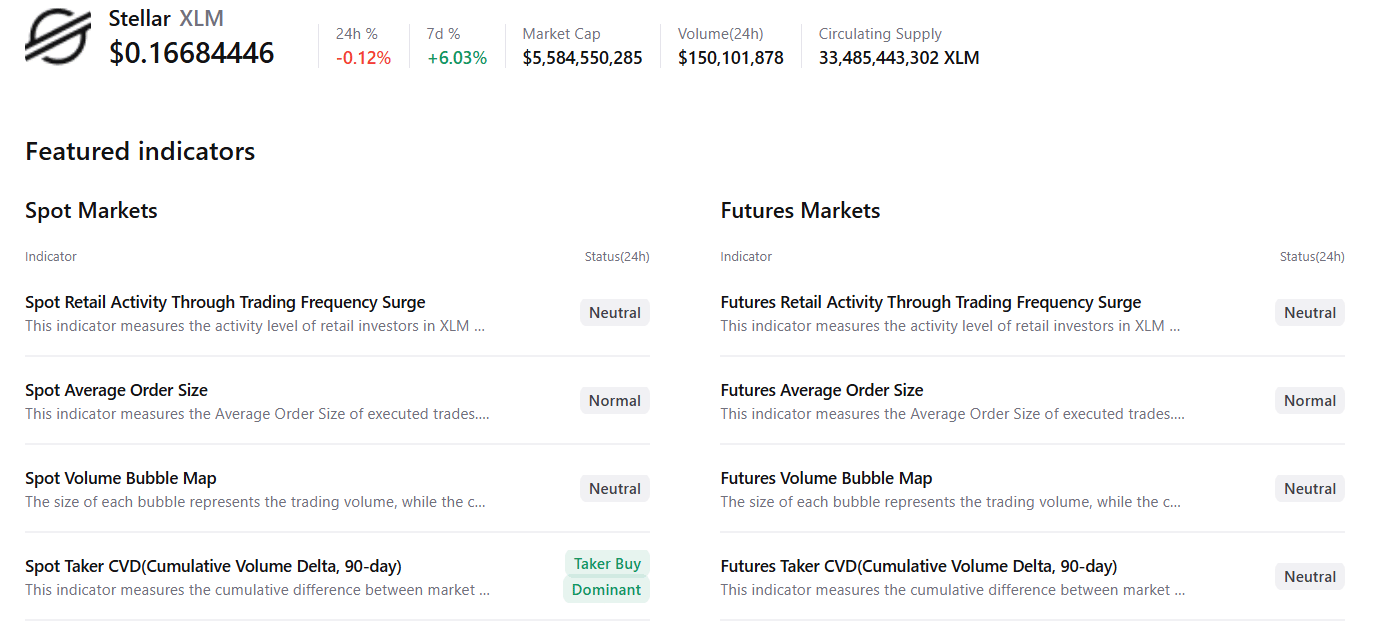
On-chain data shows a mild bullish bias
CryptoQuant summary data suggests a neutral to slightly bullish outlook for XRP and XLM. XRP’s spot markets show cooling conditions and buy-side dominance, with mostly neutral conditions across other metrics, suggesting a potential upside move. Meanwhile, for XLM, the data shows buy-side dominance with largely neutral conditions across other metrics, suggesting mild bullish signs.
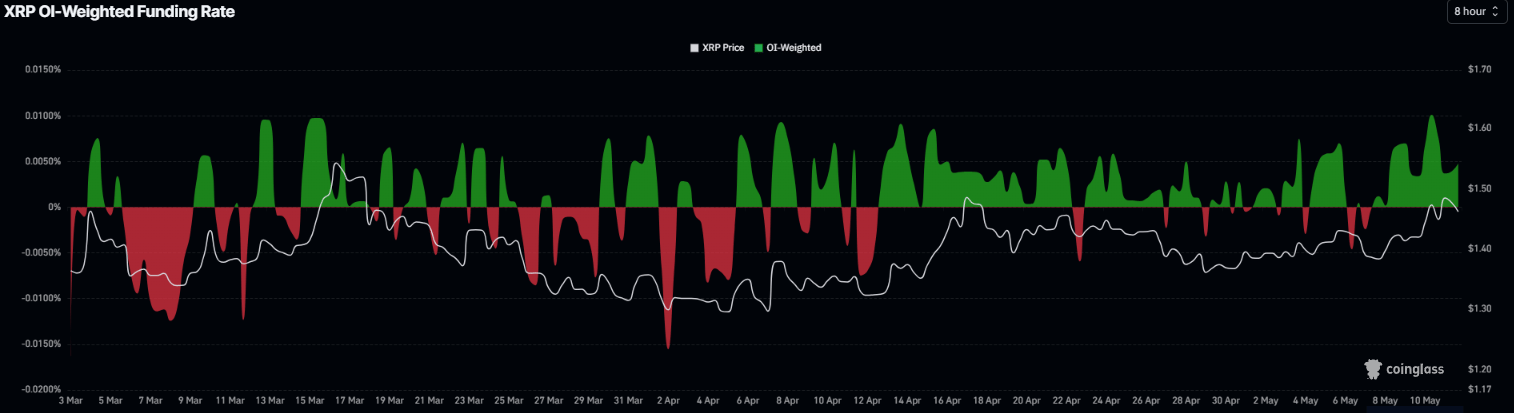
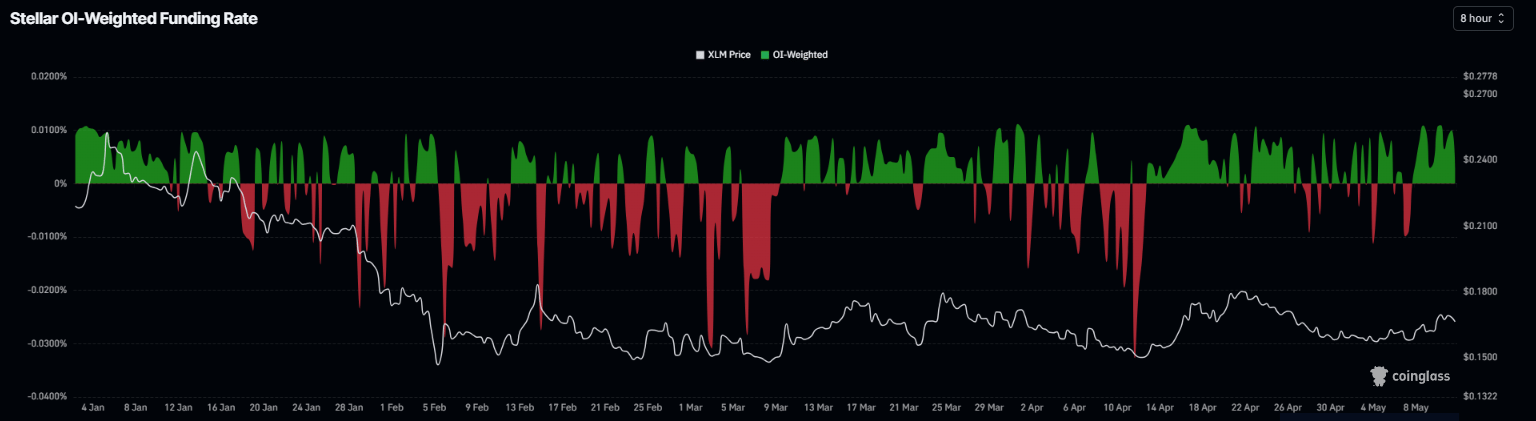
On the derivatives side, Ripple and Stellar data show a positive outlook. The funding rates data for both altcoins support improving sentiment. CoinGlass’ OI-Weighted Funding Rate data for XRP and XLM flipped positive on Friday, reading 0.0048% and 0.0030%, respectively, on Tuesday. This positive rate indicates that longs are paying shorts and projecting a bullish sentiment.
XRP technical outlook: Fresh rally if breaks above the upper boundary of the downward parallel channel
XRP is trading at $1.47 on Tuesday and holds above the 50-day EMA around $1.41, but remains capped by the upper boundary of the prevailing downward parallel channel near $1.48 and the 100-day EMA at $1.49, keeping the broader tone neutral despite the latest rebound.
The Relative Strength Index (RSI) on the daily chart hovers in the low 60s. At the same time, the Moving Average Convergence Divergence (MACD) remains above the zero line, suggesting improving bullish momentum, yet remains constrained by the nearby cluster of overhead EMAs and channel resistance.
On the downside, immediate support emerges at the 50-day EMA around $1.41, with the next notable floor at the horizontal level of $1.30, ahead of the lower boundary of the broader descending channel near $0.66.
On the topside, initial resistance is seen at the channel top around $1.48, followed by the 100-day EMA at $1.49; a sustained break above these levels would expose the 200-day EMA near $1.71 and, beyond that, the major horizontal barrier around $1.90.
XLM technical outlook: Consolidates between key EMAs
Stellar price is trading at $0.167 on Tuesday, keeping a capped bias as price holds above the 50-day EMA around $0.165 but remains firmly below the 100-day EMA at $0.174 and the 200-day EMA near $0.204, as well as broader descending trendline resistance.
The RSI on the daily chart hovers just above the midline near 54, and the MACD line edges slightly above zero, hinting at mild bullish momentum that has yet to overcome the dominant overhead structure.
On the topside, initial resistance is seen at the 100-day EMA around $0.174, with the 23.6% Fibonacci retracement of the broader downswing aligning near $0.201 just ahead of the 200-day EMA at about $0.204 to form a dense supply zone. In contrast, higher up, the 38.2% Fibonacci retracement stands near $0.241 and deeper levels at $0.274 and $0.307 cap the medium-term recovery path.
On the downside, immediate support is provided by the 50-day EMA at $0.165, with a more important structural floor emerging at the 0.0% Fibonacci anchor near $0.136, where a break would likely reopen the broader bearish phase despite the current stabilization in momentum indicators.
(The technical analysis of this story was written with the help of an AI tool.)

100만 명이 넘는 사용자가 FXStreet를 통해 실시간 시장 데이터, 차트 도구, 전문가 인사이트, 포렉스 뉴스를 이용합니다. 포괄적인 경제 캘린더와 교육 웨비나는 트레이더가 정보를 유지하고 신중한 결정을 내리도록 돕습니다. FXStreet는 바르셀로나 본사와 전 세계 지역에 걸쳐 약 60명의 팀으로 구성되어 있습니다.
더 읽기


