
XRP and XLM outlook: On-chain and technical signals point to upside for both altcoins
작성자 Manish Chhetri
수정됨: 21 Apr 2026


인기 기사

Ripple (XRP) and Stellar (XLM) are trading above their key resistance levels on Tuesday after XRP closed above, while XLM found support around its respective resistance zones the previous day.
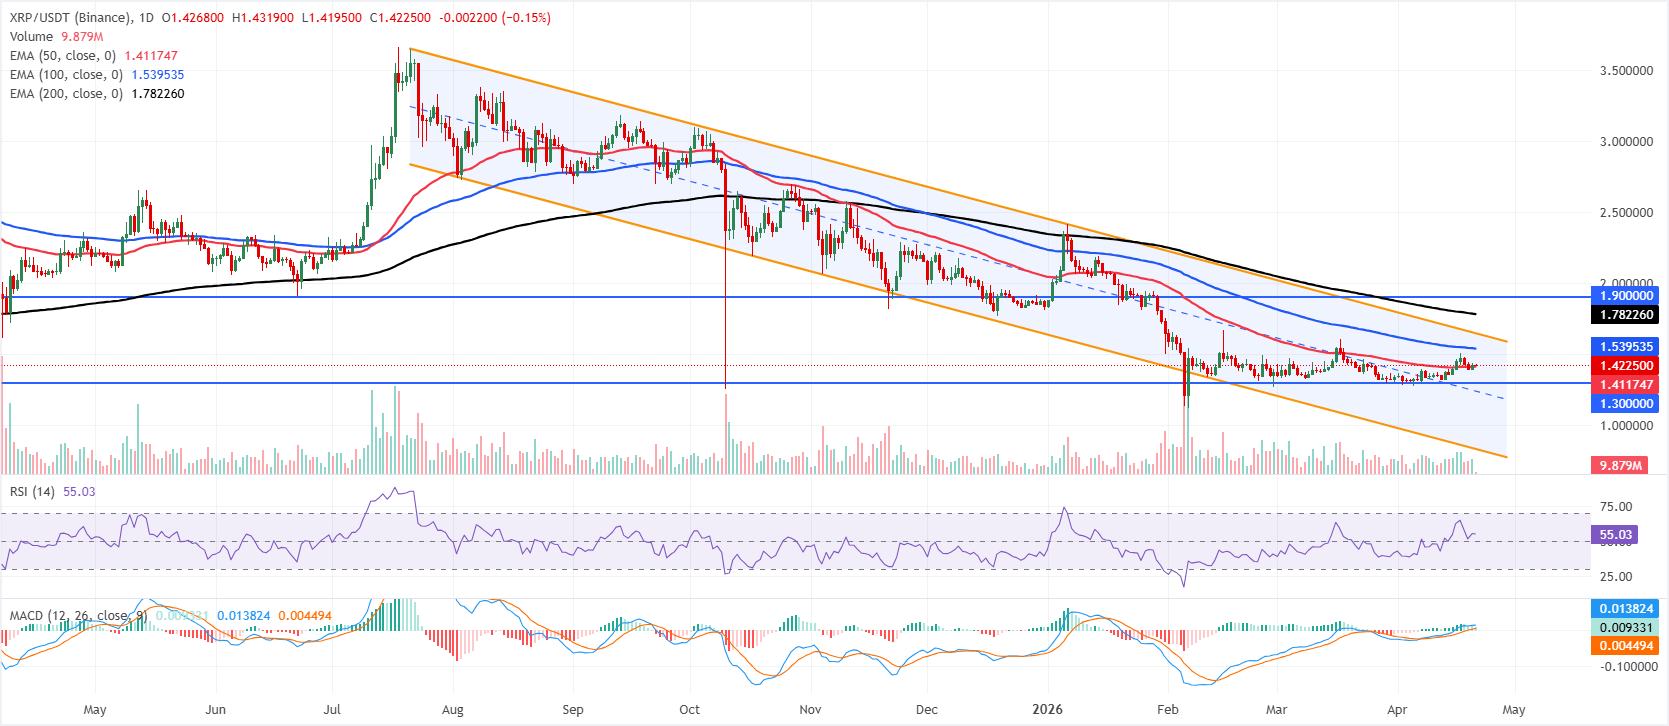
- XRP price hovers at $1.42 on Tuesday after closing above the key 50-day EMA resistance the previous day.
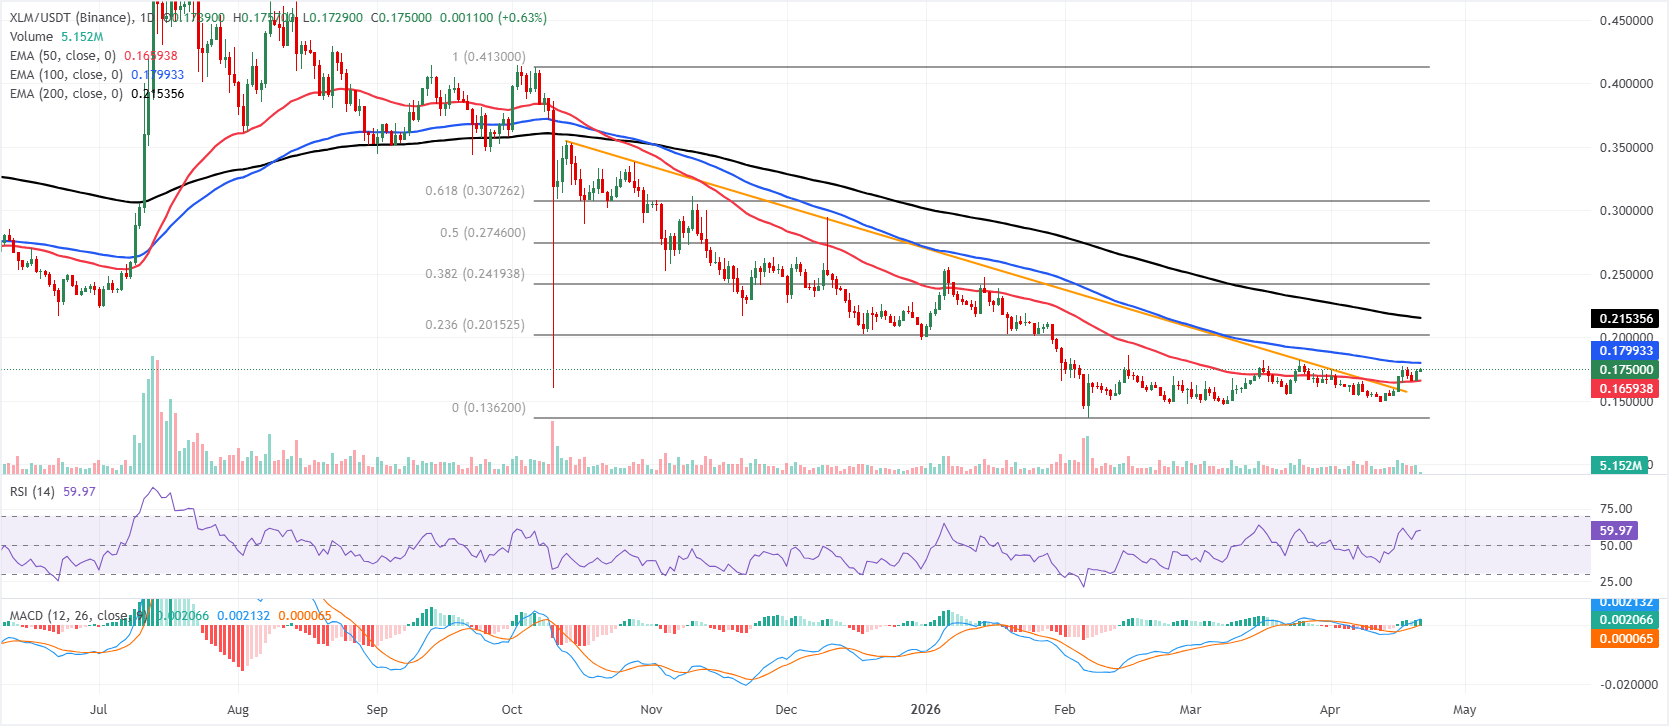
- XLM rebounds after finding support at a crucial technical level.
- On-chain data, derivatives metrics and momentum indicators collectively support a positive outlook, hinting at further upside potential for both altcoins.
Ripple (XRP) and Stellar (XLM) are trading above their key resistance levels on Tuesday after XRP closed above, while XLM found support around its respective resistance zones the previous day. Strengthening on-chain activity, improving derivatives data, and bullish momentum indicators collectively support a positive outlook for both altcoins, setting the stage for a potential upside move.
On-chain and derivatives data show a bullish bias
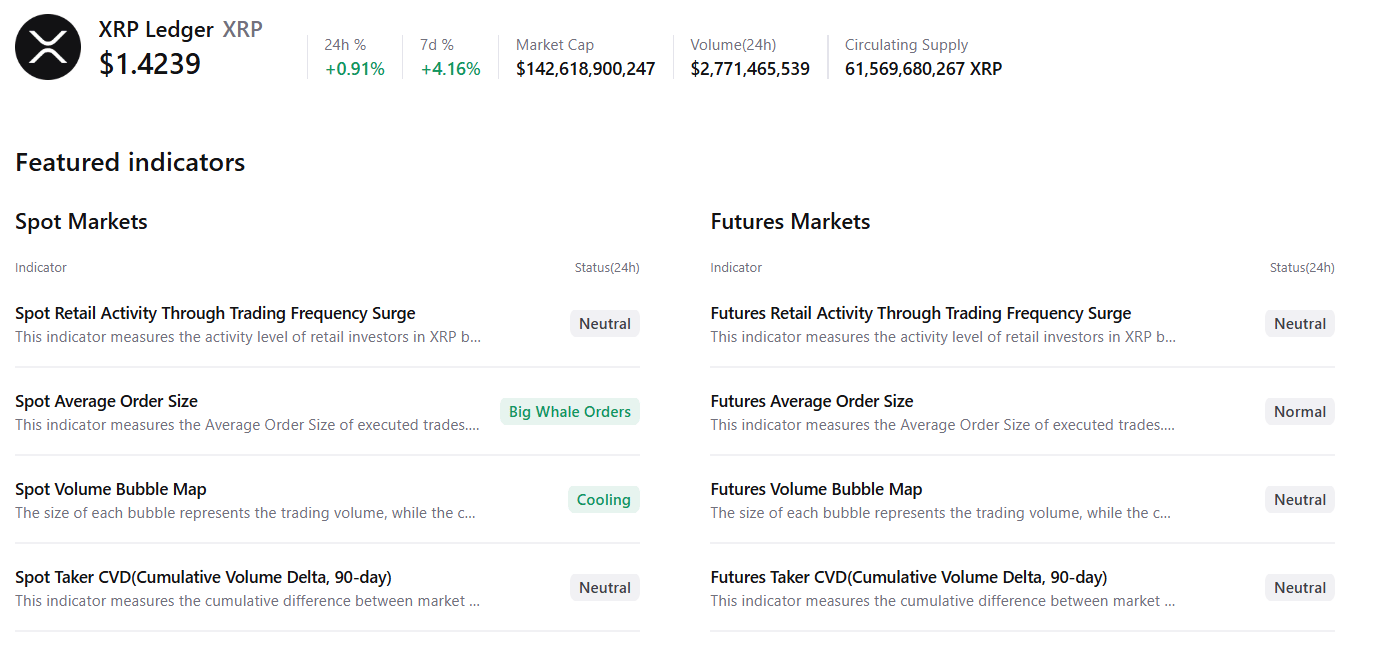
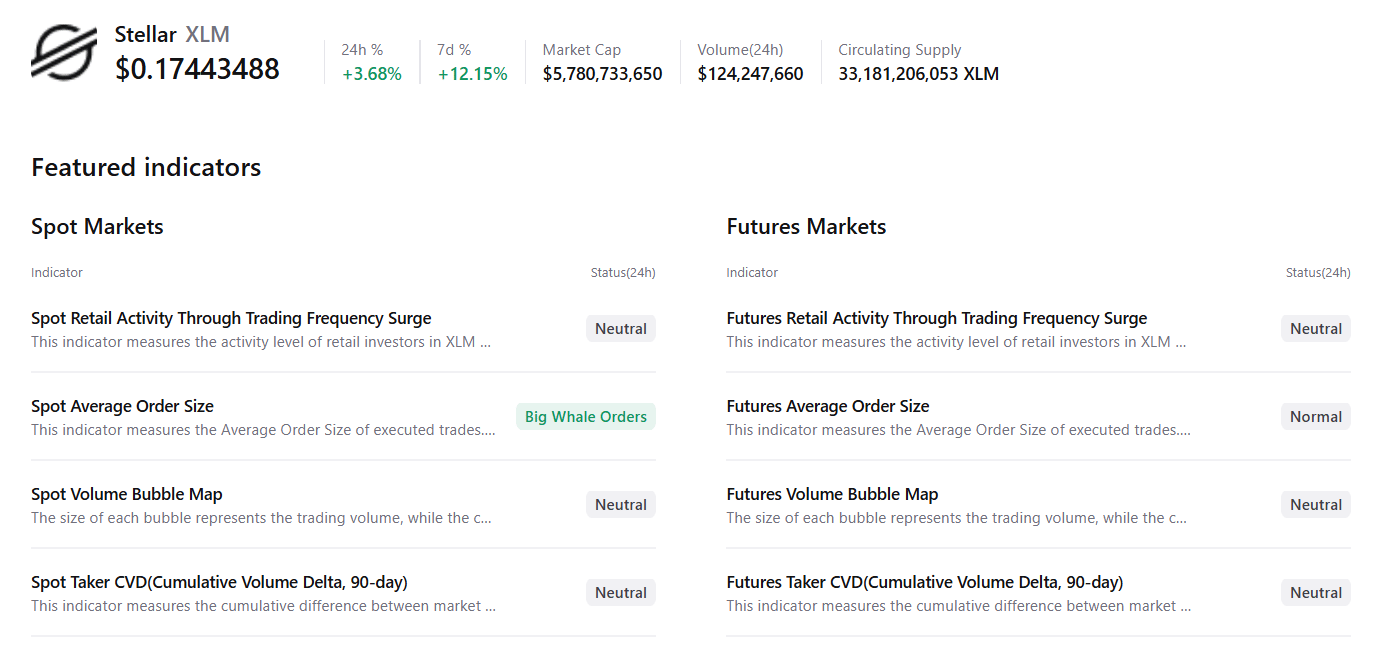
CryptoQuant summary data suggests a neutral to bullish outlook for XRP and XLM.
XRP’s spot markets show large whale orders and cooling conditions, with mostly neutral conditions across other metrics, suggesting a potential upside move. Similarly, for XLM, spot markets show large whale orders under mostly neutral conditions across other metrics, suggesting a bullish outlook.
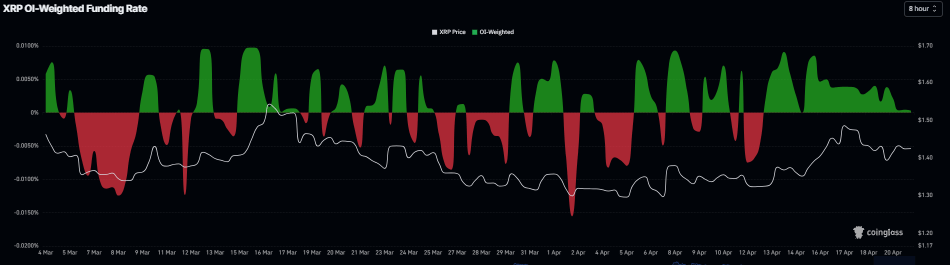
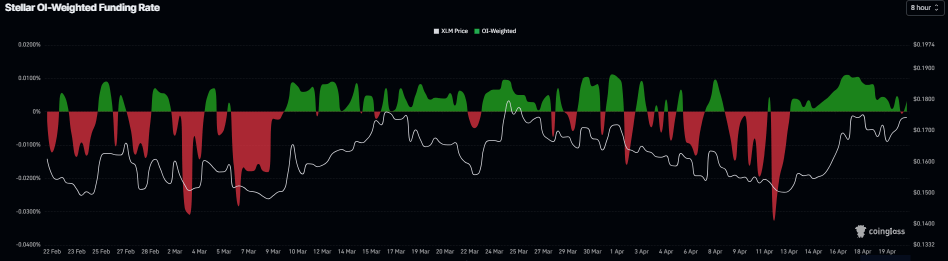
On the derivatives side, funding rates for both altcoins are bullish. CoinGlass’ OI-Weighted Funding Rate for XRP flipped to a positive rate last week and has remained there, currently at 0.0003% on Tuesday. Meanwhile, Stellar flipped positive on Monday, reading 0.0032% on Tuesday. These positive rates indicate that longs are paying shorts and that sentiment is bullish.
XRP technical outlook: Momentum indicators show bullish signals
XRP price is trading at $1.42 on Tuesday after closing above the key 50-day Exponential Moving Average (EMA) at $1.41 the previous day.
The Relative Strength Index (RSI) on the daily chart is around 55, and a positive Moving Average Convergence Divergence (MACD) reading suggests mildly constructive momentum, yet this improvement is not sufficient to negate the prevailing downtrend defined by the higher 100-day and 200-day EMAs and the descending channel.
On the topside, initial resistance is seen at the 100-day EMA near $1.54, followed by the upper boundary of the descending parallel channel around $1.65, with the 200-day EMA at $1.78 and the horizontal barrier at $1.90 reinforcing a broader supply zone higher up.
On the downside, immediate support is provided by the 50-day EMA at $1.41; a break below this level would expose the horizontal floor at $1.30, ahead of the lower channel boundary near $0.83 as a more distant bearish target.
XLM technical outlook: Rebounds from key support
Stellar price is trading at $0.175 on Tuesday after finding support around the 50-day EMA at $0.165 the previous day. XLM is holding a constructive near-term bias as it stabilizes above the 50-day EMA and the broken descending trendline that now offers secondary support near $0.153.
Momentum remains supportive, with the RSI on the daily chart hovering just below overbought territory around 59 and the MACD line tracking above zero, suggesting buyers retain control while price stays capped beneath the 100-day EMA at $0.179.
On the topside, immediate resistance is located at the 100-day EMA at $0.179, followed by a more substantive barrier at the 23.6% Fibonacci retracement of the broader downswing at $0.201, ahead of the 200-day EMA at $0.215, which defines a key medium-term hurdle.
On the downside, initial support is seen around the current area and the day’s open near $0.173, before the 50-day EMA at $0.165, with deeper protection at the former descending resistance line-turned-support around $0.153 and the broader cycle low anchor near $0.136 if selling pressure accelerates.
(The technical analysis of this story was written with the help of an AI tool.)

100만 명이 넘는 사용자가 FXStreet를 통해 실시간 시장 데이터, 차트 도구, 전문가 인사이트, 포렉스 뉴스를 이용합니다. 포괄적인 경제 캘린더와 교육 웨비나는 트레이더가 정보를 유지하고 신중한 결정을 내리도록 돕습니다. FXStreet는 바르셀로나 본사와 전 세계 지역에 걸쳐 약 60명의 팀으로 구성되어 있습니다.
더 읽기


