
Zcash Price Forecast: ZEC breakout gains traction as bulls target above $300
작성자 Manish Chhetri
게시일: 18 Mar 2026 | 수정일: 18 Mar 2026


인기 기사

Zcash (ZEC) is trading above $280 at the time of writing on Wednesday, after breaking above the descending trendline earlier this week.
- Zcash price extends gains on Wednesday after breaking above the long-standing descending trendline
- Mixed on-chain and derivatives data, with a slight bullish tilt, could extend the recovery.
- The technical outlook suggests potential upside, with momentum indicators gaining bullish traction.
Zcash (ZEC) is trading above $280 at the time of writing on Wednesday, after breaking above the descending trendline earlier this week. On-chain and derivatives data projects a mixed outlook with a slight bullish tilt, while strengthening momentum indicators suggest the privacy-focused cryptocurrency could extend its upward trend if buying pressure persists.
Mixed outlook with a slight bullish tilt suggests improving sentiment
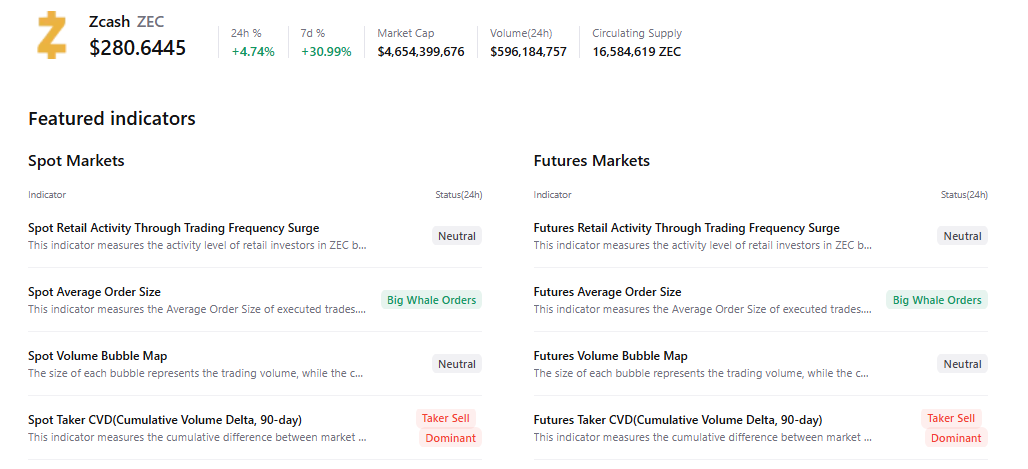
Zcash’s CryptoQuant summary data shows mixed conditions. The presence of large whale orders in the market suggests a slightly optimistic outlook for ZEC. However, activity across both spot and futures markets suggests sellers’ dominance, reflecting slight negative sentiment among investors.
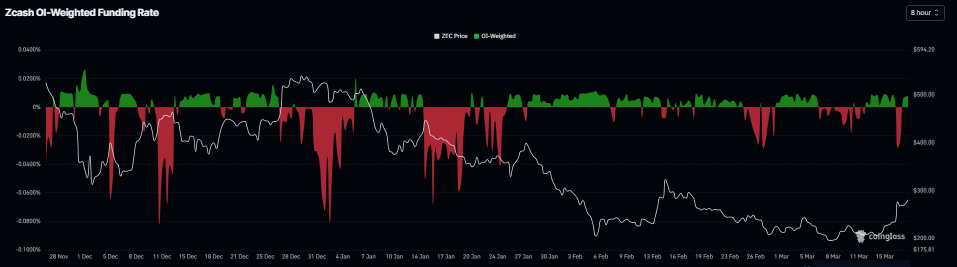
On the derivatives side, ZEC's positive funding alongside rising long bets support a positive outlook. The Coinglass chart below shows that the metric turned positive on Tuesday and stands at 0.0077% on Wednesday, indicating that longs are paying shorts and signaling bullish sentiment toward Zcash.
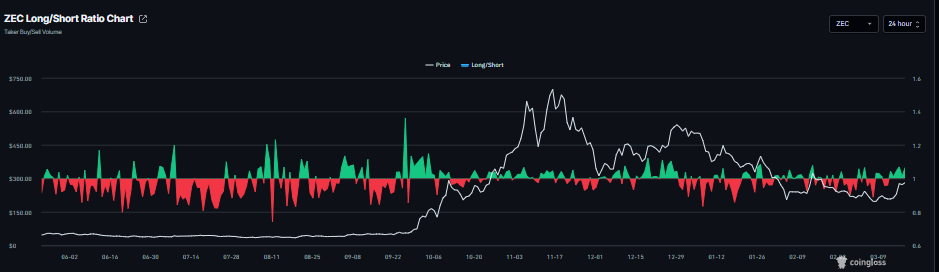
In addition, the long-to-short ratio for ZEC reads 1.06 in the same period. This ratio, being above one, shows that the majority of traders are betting on the asset’s price to rally.
Zcash Price Forecast: ZEC bulls aiming for higher highs
Zcash price is trading at $280 on Wednesday. The near-term bias is mildly bullish after the price broke above the long-standing descending trendline near $250, turning that breakout area into a reference floor. Daily closes now hold comfortably above the 50-day Exponential Moving Average (EMA) around $264, while the 100-day and 200-day EMAs remain well above current trading levels, signalling an early-stage recovery within a broader downtrend.
Momentum has improved, with the Relative Strength Index (RSI) on the daily chart above 60 and the Moving Average Convergence Divergence (MACD) line extending above its signal line in positive territory, supported by an expanding histogram, all reinforcing the building upside pressure.
Initial support is seen at the former breakout region near $250, ahead of the horizontal level at $242.49, where any deeper pullback would need to stabilise to preserve the emerging bullish structure.
On the topside, immediate resistance lies at $300, its psychological level, just above the 100-day EMA at $298, followed by the $329.52 horizontal barrier, which aligns with the prior supply zone.
A daily close above $329.52 would strengthen the upside scenario and open the way for a more sustained recovery, while a failure to hold above $250 would neutralise the current bullish bias.
-1773816730339-1773816730340.png)
(The technical analysis of this story was written with the help of an AI tool.)

100만 명이 넘는 사용자가 FXStreet를 통해 실시간 시장 데이터, 차트 도구, 전문가 인사이트, 포렉스 뉴스를 이용합니다. 포괄적인 경제 캘린더와 교육 웨비나는 트레이더가 정보를 유지하고 신중한 결정을 내리도록 돕습니다. FXStreet는 바르셀로나 본사와 전 세계 지역에 걸쳐 약 60명의 팀으로 구성되어 있습니다.
더 읽기


