
Zcash Price Forecast: ZEC stabilizes as upcoming CLARITY Act vote tests bullish outlook
작성자 Vishal Dixit
수정됨: 12 May 2026


인기 기사

Zcash (ZEC) trades above $550 on Tuesday, stabilizing after three consecutive days of losses ahead of Thursday's Digital Asset Market Clarity (CLARITY) Act voting.
- Zcash hovers above $550 on Tuesday, holding steady after a 6% decline the previous day.
- Retail demand is waning after last week’s 50% rally, ahead of the CLARITY Act vote on Thursday.
- Zcash should rebound from the key support at $534 to sustain a bullish technical outlook.
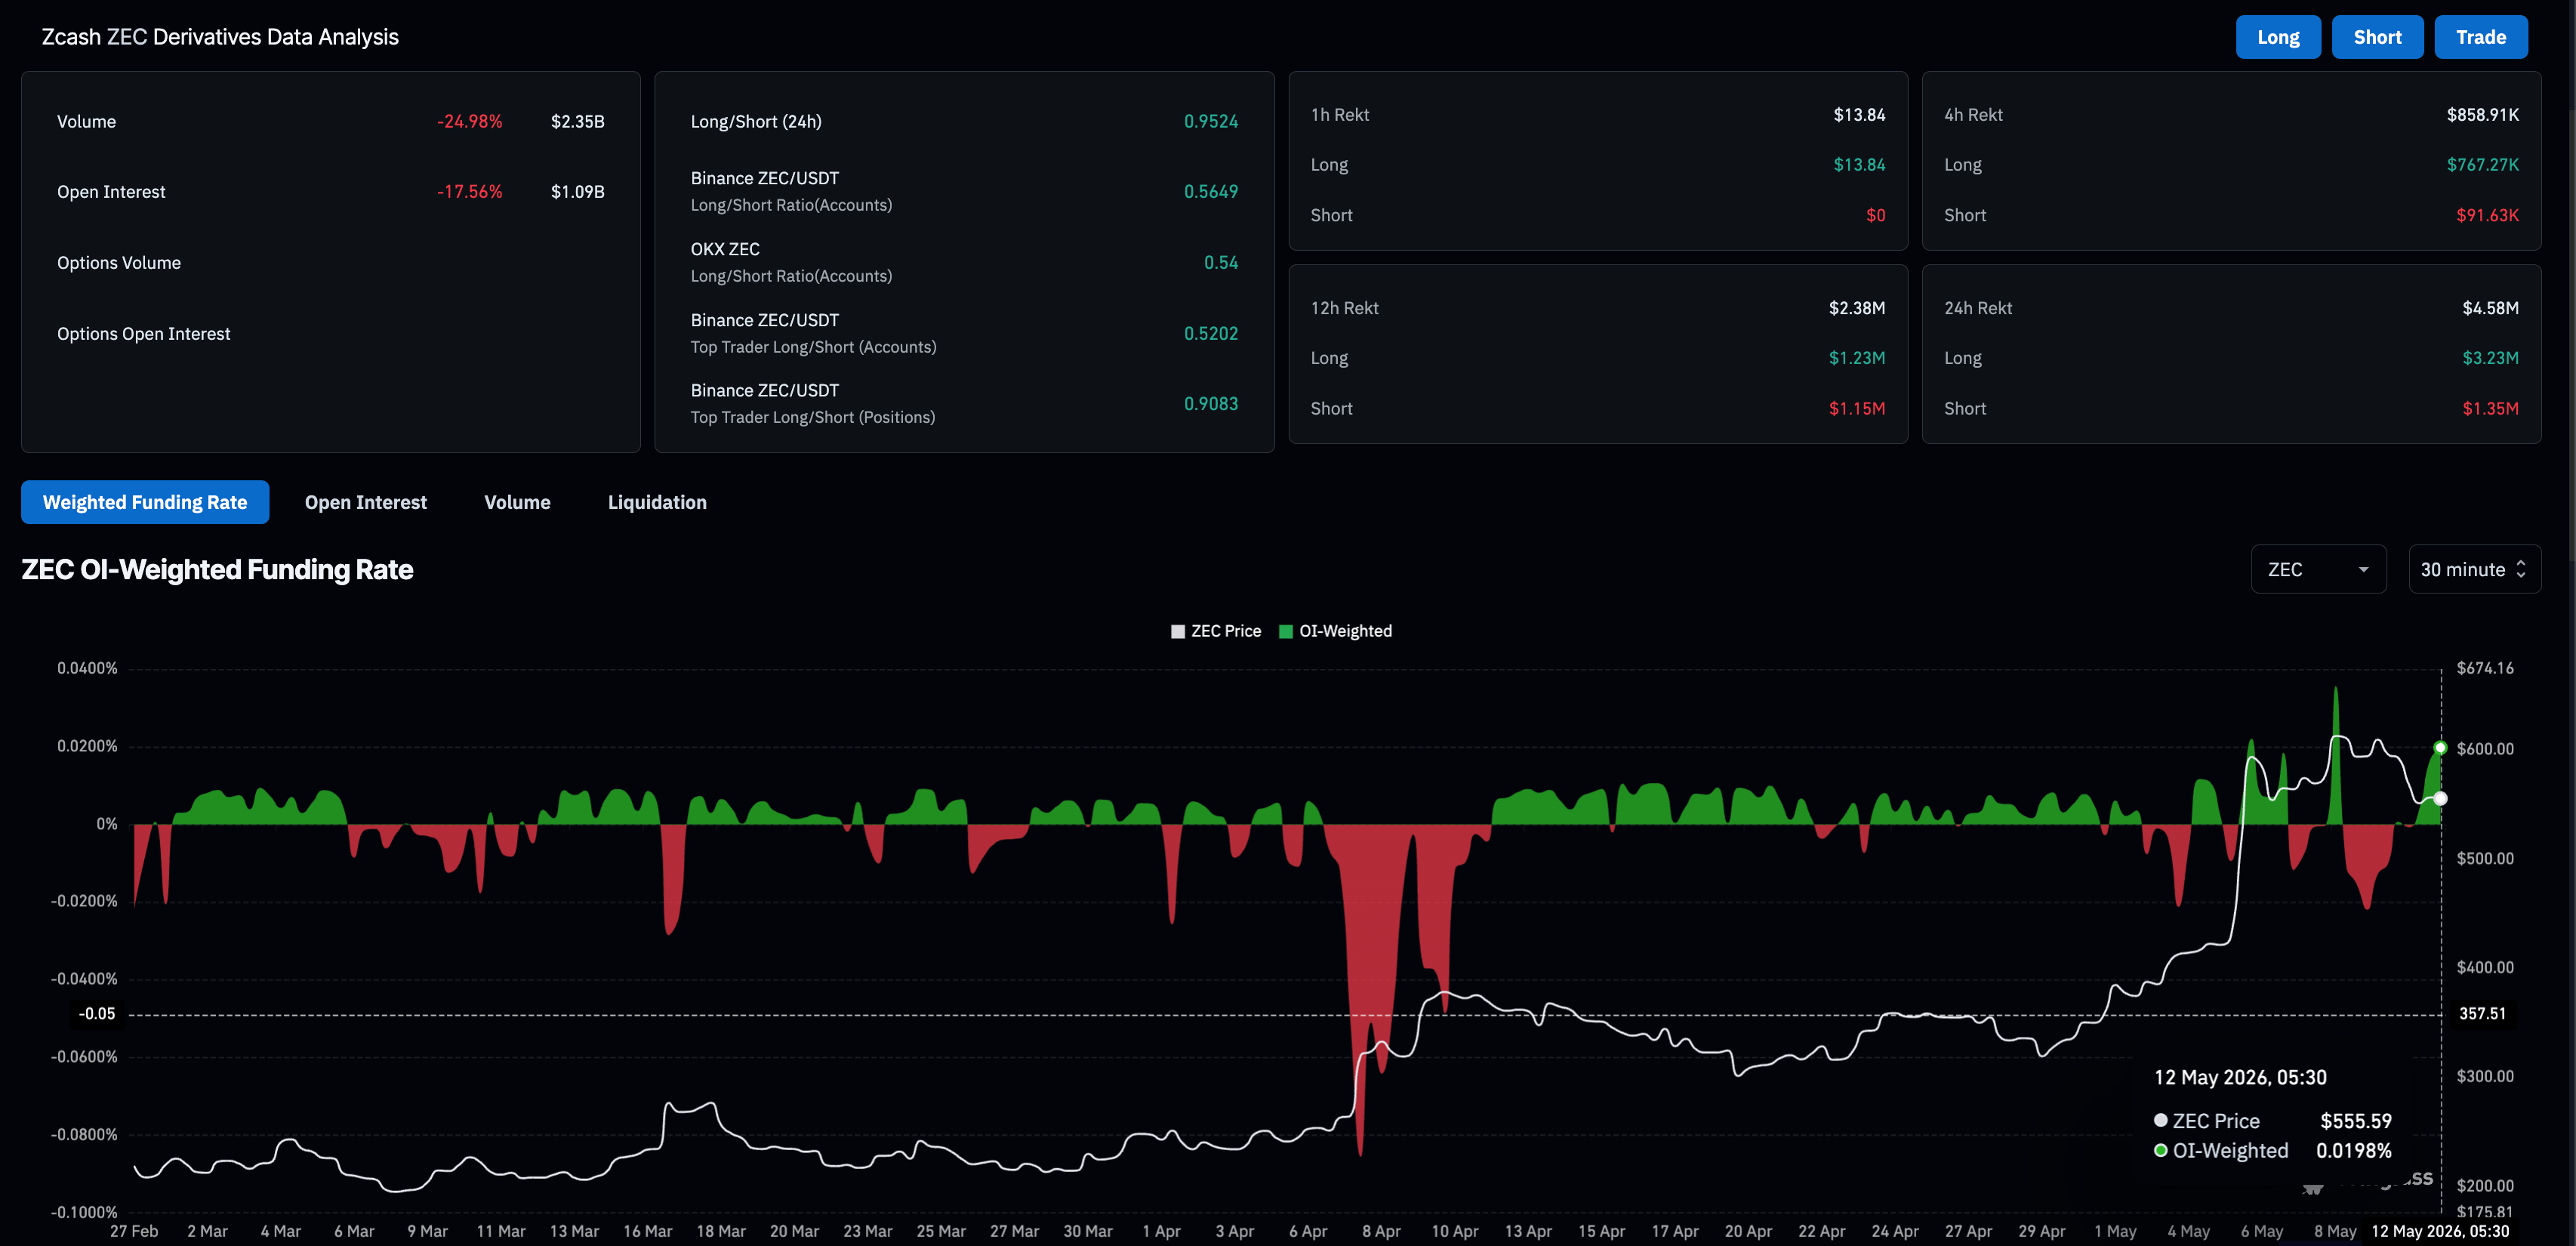
Zcash (ZEC) trades above $550 on Tuesday, stabilizing after three consecutive days of losses ahead of Thursday's Digital Asset Market Clarity (CLARITY) Act voting. Retail interest in the privacy coin takes a hit amid a three-day decline, with ZEC futures Open Interest falling by over 17% in 24 hours. The technical outlook remains largely unchanged, bullish, as price holds above the key support at $534.
Zcash loses leverage-driven demand
Zcash is losing retail demand amid an uphill battle, with the upcoming CLARITY Act vote on Thursday and Middle East tensions weighing on the broader cryptocurrency market. The strict Anti-Money Laundering (AML) standards for Digital Commodity Exchanges (DCEs) in the CLARITY Act could further increase compliance hurdles.
CoinGlass data shows the Zcash futures Open Interest is down over 17% in the last 24 hours to $1.09 billion, reflecting a significant reduction in leverage-based risk exposure. Still, the short-term rebound in funding rates to 0.0198% reflects traders' buying long positions at a premium in anticipation of a rebound.
However, a steady decline in the spot market could force liquidation of the short-term bullish positional buildup, potentially triggering a long squeeze.
Zcash reversal tests key support level
Zcash trades around $555 at press time on Tuesday, taking a breather after a three-day decline following last week's 50% run. Still, the privacy coin holds bullish above the 50-, 100-, and 200-day Exponential Moving Averages (EMAs), clustered between roughly $314 and $389, and the 61.8% Fibonacci retracement at $534.
The momentum indicators on the daily chart point to downside vulnerability as buyers lose traction. The Moving Average Convergence Divergence (MACD) remains above its signal line, while the histogram contracts, suggesting waning bullish momentum. At the same time, the Relative Strength Index (RSI) drops to 71 in the overbought zone, reaffirming the stretched upside momentum.
On the downside, initial support emerges at the 61.8% retracement at $534, followed by the 50% retracement near $467 and the 38.2% level around $401, with the 50-day EMA at about $389 and the broken rising trend line near $344 reinforcing a broader demand band above the 100- and 200-day EMAs around $348 and $314, respectively.
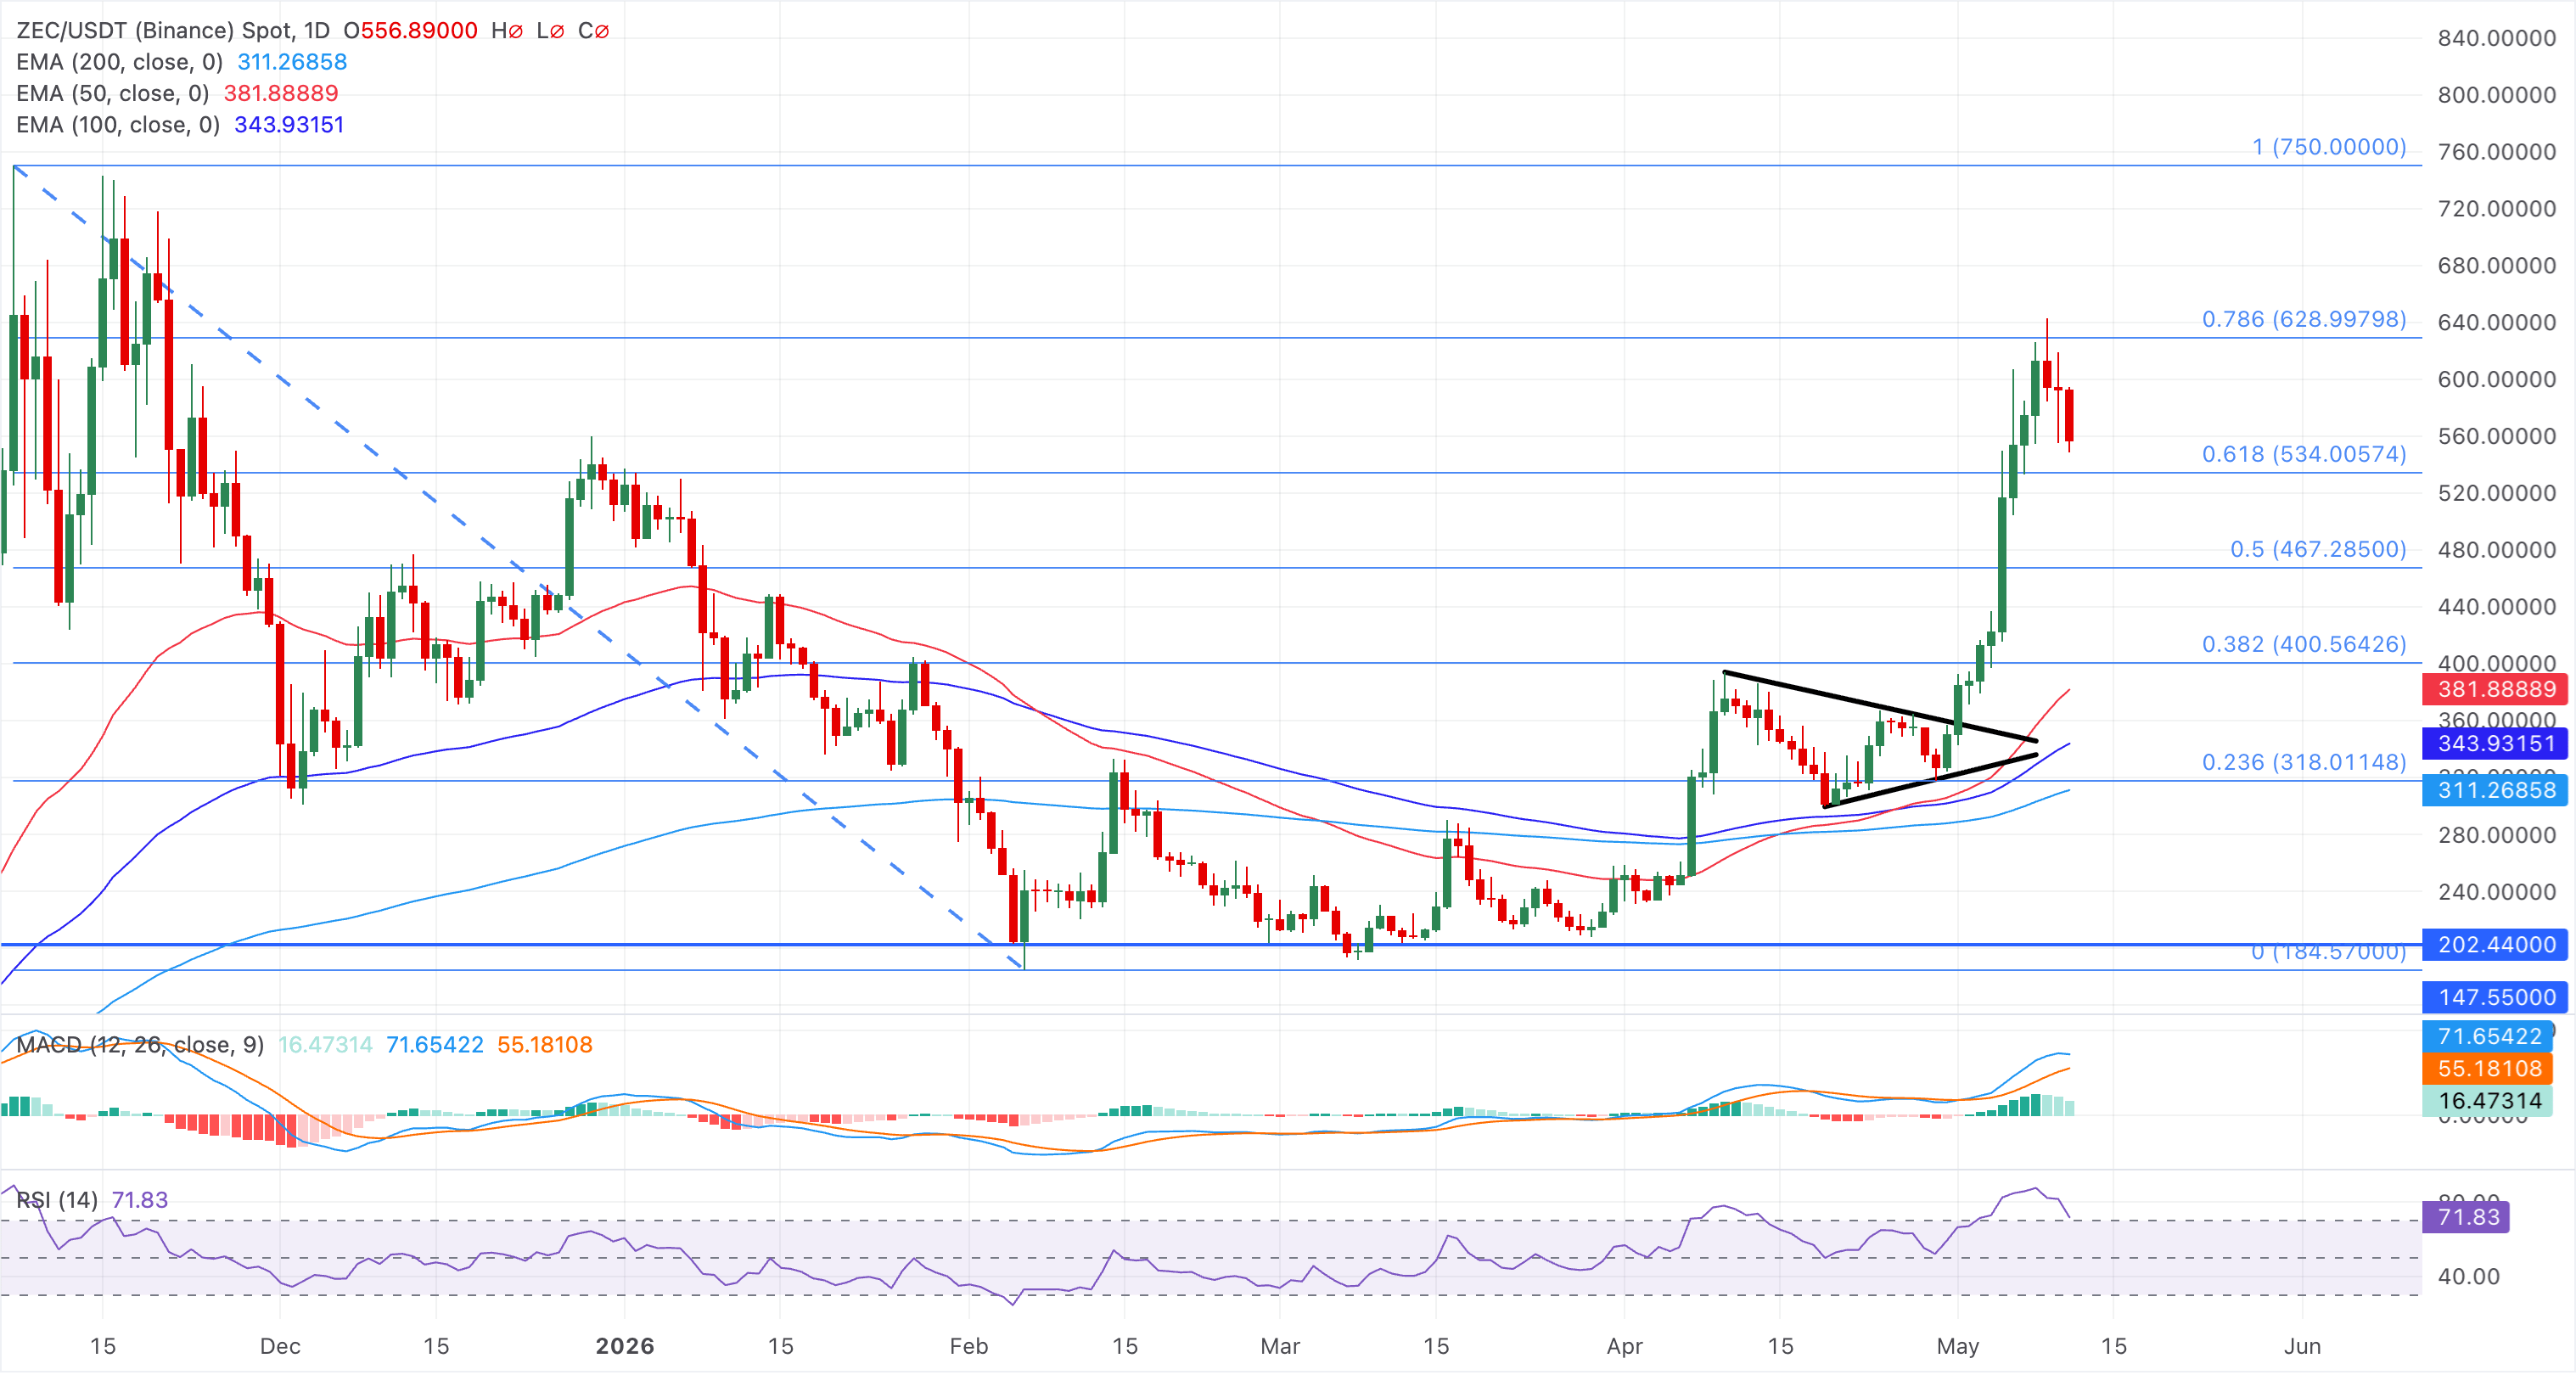
On the topside, immediate resistance is seen at the 78.6% Fibonacci retracement around $629, ahead of the prior swing high near $750.
(The technical analysis of this story was written with the help of an AI tool.)

100만 명이 넘는 사용자가 FXStreet를 통해 실시간 시장 데이터, 차트 도구, 전문가 인사이트, 포렉스 뉴스를 이용합니다. 포괄적인 경제 캘린더와 교육 웨비나는 트레이더가 정보를 유지하고 신중한 결정을 내리도록 돕습니다. FXStreet는 바르셀로나 본사와 전 세계 지역에 걸쳐 약 60명의 팀으로 구성되어 있습니다.
더 읽기


