
Trade The World
AUD/JPY Price Forecast: Rebounds towards 101.50, bulls target yearly high
작성자 Christian Borjon Valencia
게시일: 19 Nov 2025 | 수정일: 19 Nov 2025


POPULAR ARTICLES

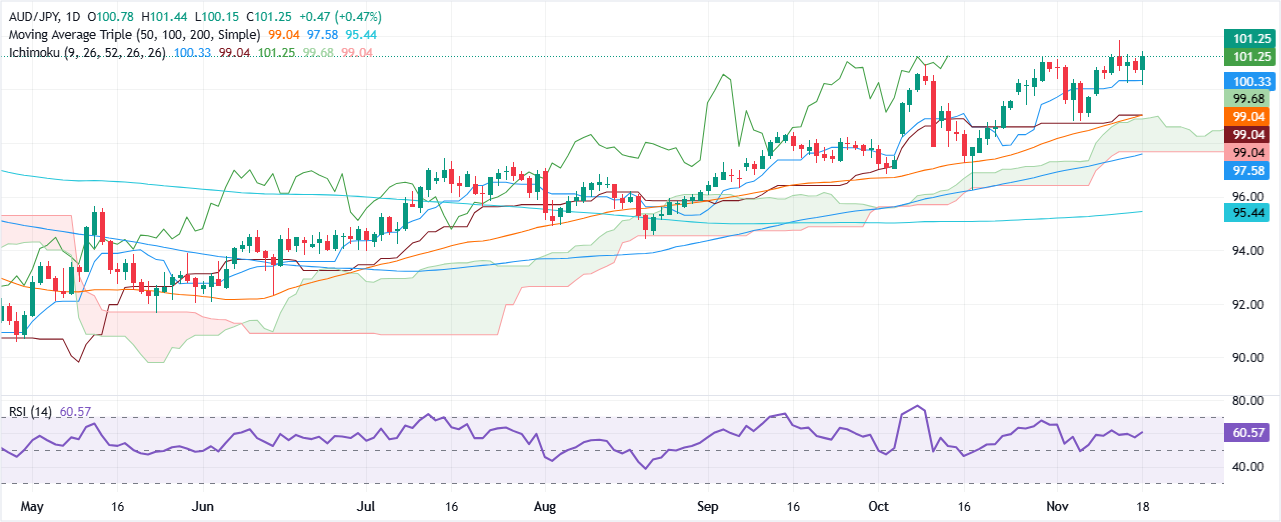
The AUD/JPY recovers after posting losses of 0.17% on Monday, rises 0.39% after the cross-pair tested the 20-day Simple Moving Average (SMA) at 100.45. At the time of writing, the Aussie pair trades at 101.26 up 0.05%, as Wednesday’s Asian session kicks in.
- AUD/JPY rises 0.39% after defending support, holding firm as Asian session begins.
- Uptrend intact with higher highs and lows, pointing toward a test of the yearly peak.
- Break above resistance opens path toward 102.41–103.00; drop below support risks slide toward 101.00–100.00.
The AUD/JPY recovers after posting losses of 0.17% on Monday, rises 0.39% after the cross-pair tested the 20-day Simple Moving Average (SMA) at 100.45. At the time of writing, the Aussie pair trades at 101.26 up 0.05%, as Wednesday’s Asian session kicks in.
AUD/JPY Price Forecast: Technical outlook
The AUD/JPY technical picture suggests that further upside is seen. Successive series of higher highs and higher lows indicate the pair could challenge the yearly peak of 101.82.
Momentum as measured by the Relative Strength Index (RSI) shows buyers outweighing sellers. Still caution is warranted, as the RSI is shy of clearing its latest peak at around 67.50.
If AUD/JPY clears 102.00, the next stop would be November 7, 2024, high of 102.41, ahead of 103.00. Conversely if it falls below 101.50, the first support would be 101.00, followed by the 20-day SMA and the 100.00 print.
AUD/JPY Price Chart – Daily
Australian Dollar Price This week
The table below shows the percentage change of Australian Dollar (AUD) against listed major currencies this week. Australian Dollar was the strongest against the Swiss Franc.
| USD | EUR | GBP | JPY | CAD | AUD | NZD | CHF | |
|---|---|---|---|---|---|---|---|---|
| USD | 0.39% | 0.13% | 0.62% | -0.25% | 0.42% | 0.35% | 0.76% | |
| EUR | -0.39% | -0.15% | 0.61% | -0.60% | 0.02% | -0.02% | 0.38% | |
| GBP | -0.13% | 0.15% | 0.53% | -0.48% | 0.17% | 0.13% | 0.54% | |
| JPY | -0.62% | -0.61% | -0.53% | -0.85% | -0.20% | -0.28% | 0.10% | |
| CAD | 0.25% | 0.60% | 0.48% | 0.85% | 0.67% | 0.58% | 1.02% | |
| AUD | -0.42% | -0.02% | -0.17% | 0.20% | -0.67% | -0.03% | 0.37% | |
| NZD | -0.35% | 0.02% | -0.13% | 0.28% | -0.58% | 0.03% | 0.41% | |
| CHF | -0.76% | -0.38% | -0.54% | -0.10% | -1.02% | -0.37% | -0.41% |
The heat map shows percentage changes of major currencies against each other. The base currency is picked from the left column, while the quote currency is picked from the top row. For example, if you pick the Australian Dollar from the left column and move along the horizontal line to the US Dollar, the percentage change displayed in the box will represent AUD (base)/USD (quote).

FXStreet
100만 명이 넘는 사용자가 FXStreet를 통해 실시간 시장 데이터, 차트 도구, 전문가 인사이트, 포렉스 뉴스를 이용합니다. 포괄적인 경제 캘린더와 교육 웨비나는 트레이더가 정보를 유지하고 신중한 결정을 내리도록 돕습니다. FXStreet는 바르셀로나 본사와 전 세계 지역에 걸쳐 약 60명의 팀으로 구성되어 있습니다.
Read More


