
Trade The World
Bitcoin Cash Price Forecast: BCH risks drop to $450 amid rising profit-taking, bearish market signals
작성자 Manish Chhetri
게시일: 16 Oct 2025 | 수정일: 16 Oct 2025


POPULAR ARTICLES

Bitcoin Cash (BCH) trades in red below $520 at the time of writing on Thursday, after facing rejection from a previously broken trendline earlier this week. Rising profit-taking activity and bearish derivatives data indicate that selling pressure may persist in the short term.
- Bitcoin Cash trades in red on Thursday after facing rejection from a previously broken trendline earlier this week.
- On-chain and derivatives data point to further downside, with profit-taking activity increasing and funding rates turning negative.
- The technical outlook suggests a potential drop toward the $450 level as momentum indicators flash bearish signals.
Bitcoin Cash (BCH) trades in red below $520 at the time of writing on Thursday, after facing rejection from a previously broken trendline earlier this week. Rising profit-taking activity and bearish derivatives data indicate that selling pressure may persist in the short term. BCH could be poised for a deeper correction toward the $450 mark as funding rates are turning negative and momentum indicators point lower.
BCH’s on-chain and derivatives data lean bearish
Santiment's Network Realized Profit/Loss (NPL) metric indicates that Bitcoin Cash holders are booking some profits this week.
As shown in the chart below, the metric experienced multiple spikes on Wednesday and Thursday. These spikes indicate that holders are, on average, selling their bags at a significant profit, thereby increasing the selling pressure.
 [13-1760608598249-1760608598250.56.20, 16 Oct, 2025].png)
BCH age consumed chart. Source: Santiment
On the derivatives side, Bitcoin Cash also supports a bearish outlook. CoinGlass’s OI-Weighted Funding Rate data shows that the number of traders betting that the BCH price will slide further is higher than those anticipating a price increase.
The metric has flipped to a negative rate and reads -0.0007% on Thursday. The negative ratio suggests that shorts are paying longs, indicating a bearish sentiment for BCH.
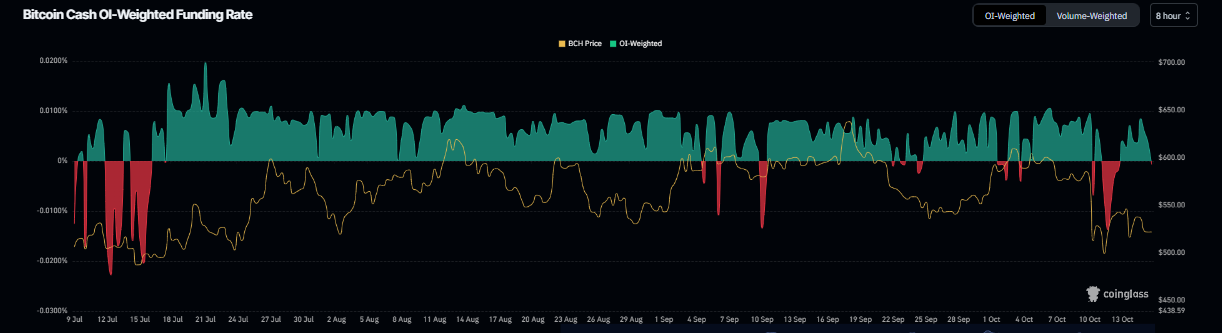
BCH funding rate chart. Source: Coinglass
Bitcoin Cash Price Forecast: BCH risks potential drop to $450
Bitcoin Cash price faced rejection from the previously broken ascending trendline (drawn by connecting multiple lows since mid-April) on Tuesday and declined nearly 5% by the next day. At the time of writing on Thursday, it trades down around $251.
If BCH continues its correction and closes below the 200-day Exponential Moving Average (EMA) at $506.4, it could extend the decline toward the next support level at $450.2.
The Relative Strength Index (RSI) indicator at 39 on the daily chart suggests that bearish momentum is gaining traction. Additionally, the Moving Average Convergence Divergence (MACD) showed a bearish crossover last week, which remains in effect, further supporting the bearish view.
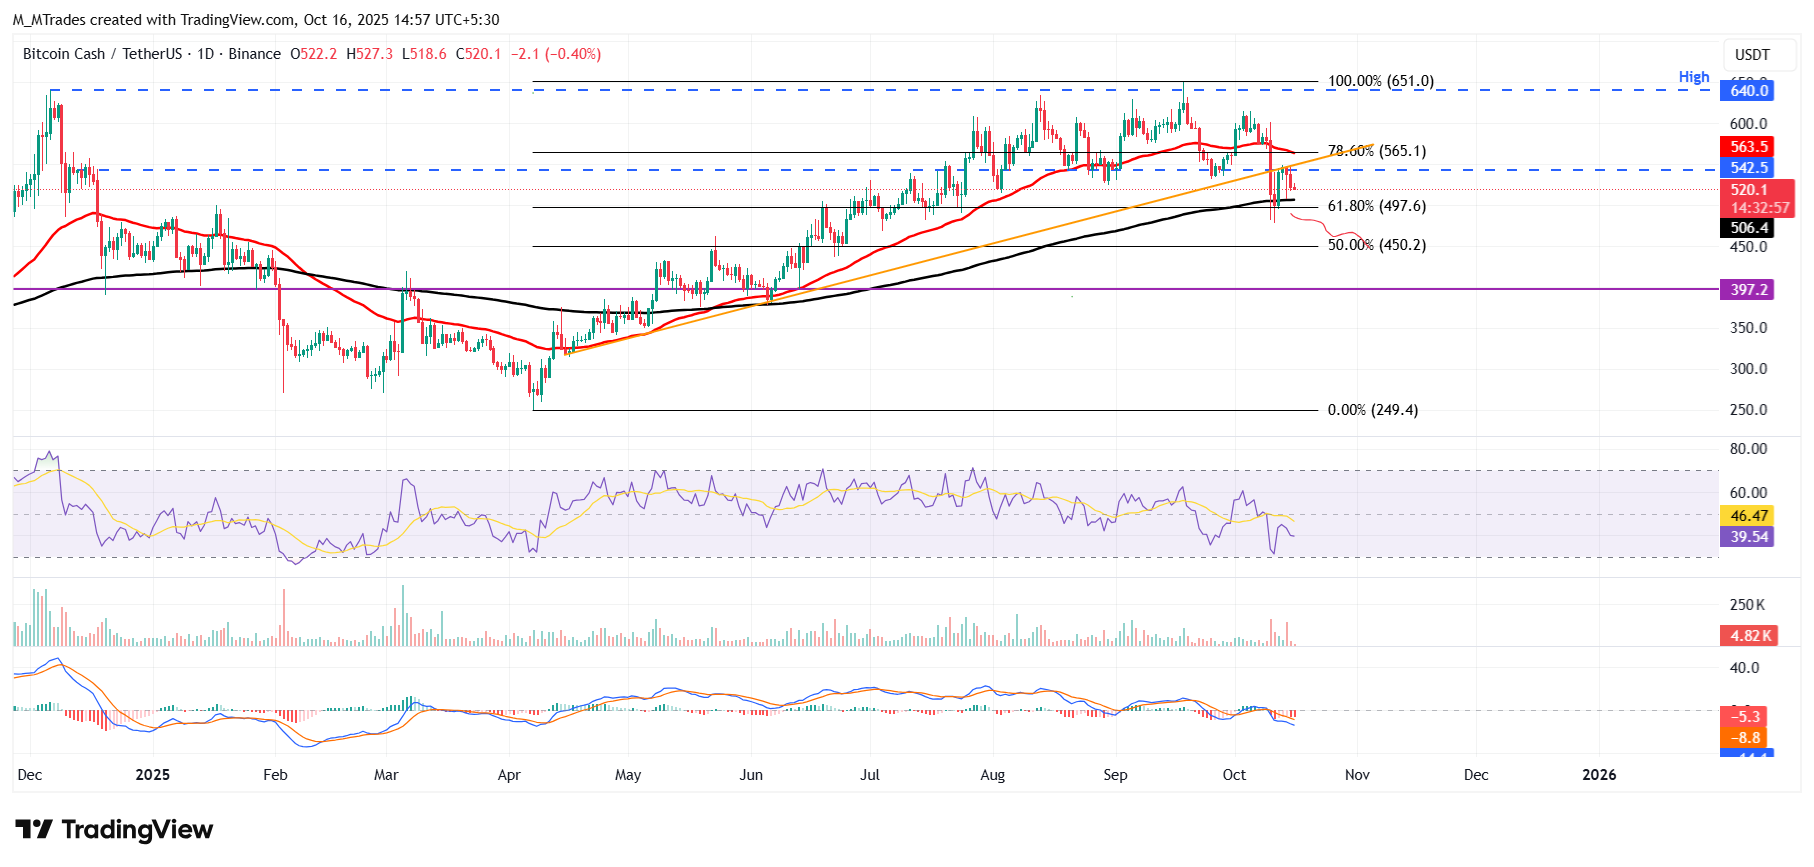
BCH/USDT daily chart
However, if BCH recovers, it could extend the recovery toward the daily resistance level at $542.5.

FXStreet
100만 명이 넘는 사용자가 FXStreet를 통해 실시간 시장 데이터, 차트 도구, 전문가 인사이트, 포렉스 뉴스를 이용합니다. 포괄적인 경제 캘린더와 교육 웨비나는 트레이더가 정보를 유지하고 신중한 결정을 내리도록 돕습니다. FXStreet는 바르셀로나 본사와 전 세계 지역에 걸쳐 약 60명의 팀으로 구성되어 있습니다.
Read More


