
Trade The World
Bitcoin Price Forecast: BTC recovery strengthens as RSI signals bullish divergence
작성자 Manish Chhetri
게시일: 2 Sep 2025 | 수정일: 2 Sep 2025


POPULAR ARTICLES

Bitcoin (BTC) price is extending its recovery, trading above $110,000 at the time of writing on Tuesday after facing a pullback of nearly 5% last week. On-chain data indicate a rare shift, with long liquidations surpassing shorts by approximately $7 million.
- Bitcoin price extends its recovery on Tuesday after correcting by nearly 5% in the previous week.
- On-chain data shows long liquidations exceeded shorts by about $7 million, hinting at potential reversal zones.
- The technical outlook shows a bullish RSI divergence in the 4-hour chart, which often signals a trend reversal or a short-term rally.
Bitcoin (BTC) price is extending its recovery, trading above $110,000 at the time of writing on Tuesday after facing a pullback of nearly 5% last week. On-chain data indicate a rare shift, with long liquidations surpassing shorts by approximately $7 million. Meanwhile, a bullish Relative Strength Index (RSI) divergence on the BTC 4-hour chart suggests the largest cryptocurrency by market capitalization may be approaching a reversal or preparing for a short-term rally.
Bitcoin’s on-chain data hints at a reversal after a sharp pullback
Bitcoin price shows some signs of relief so far this week, ending three consecutive weeks of retracement from its record high of $124,474. This price correction of nearly 14% from its record high to the August low of $110,680 has triggered a massive liquidation in traders' positions.
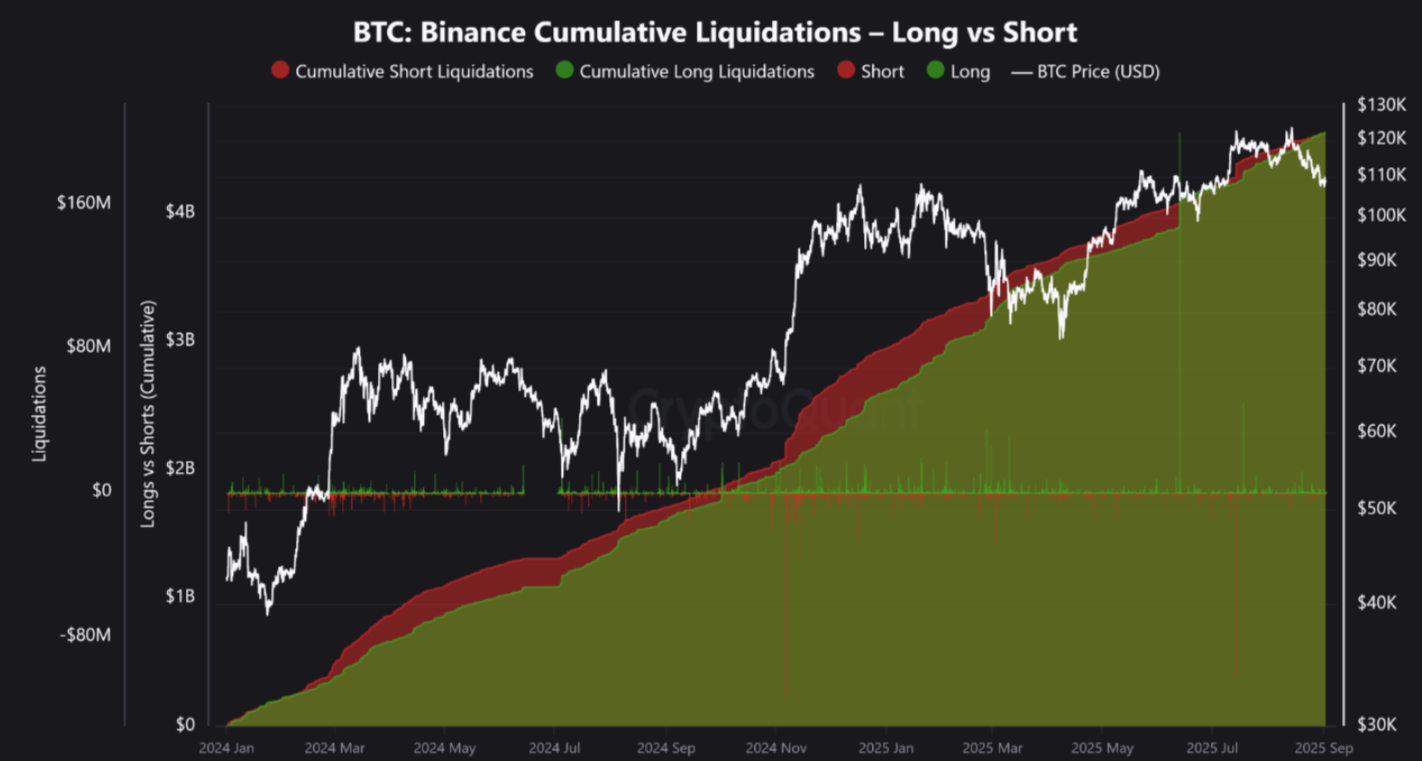
The Binance Cumulative Liquidations (CL) data below indicate that, for the first time during a prolonged upward trend, long liquidations have surpassed short liquidations by approximately $7 million, highlighting the market's overbullishness.
The surge in long liquidations suggests that the overleveraged long positions have already been flushed out, easing overheating conditions and hinting that the market may be entering potential reversal zones.
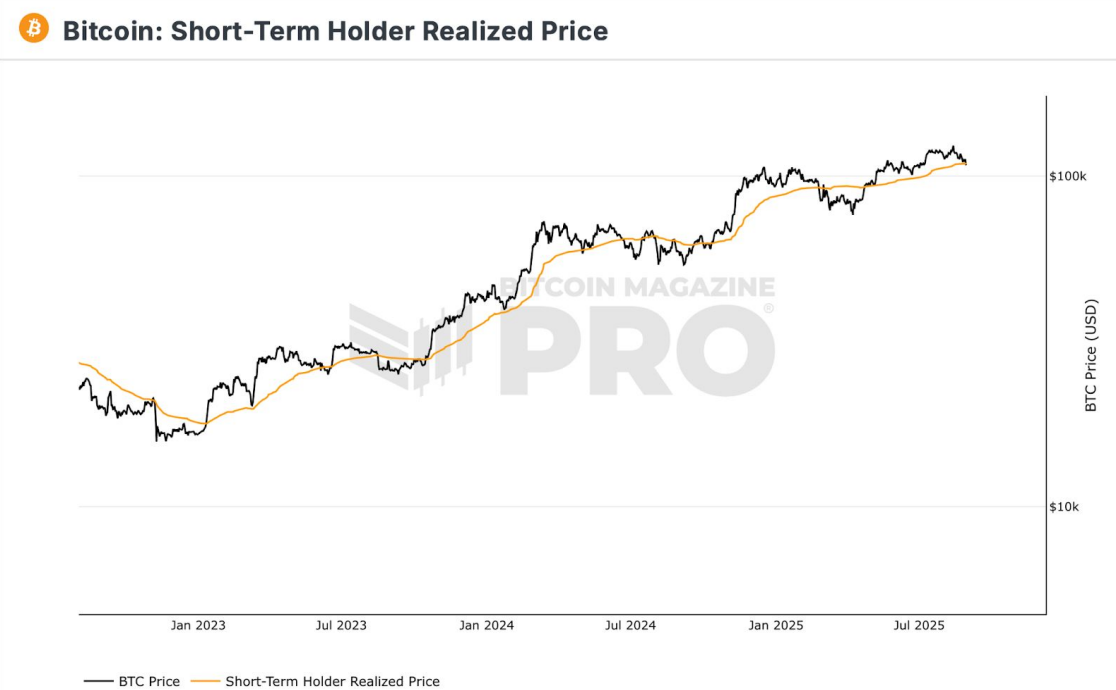
Moreover, the BTC price hovers near the Short-Term holders’ (STH) Realised Price of around $108,900. Historically, in a bull market, the BTC price generally trades above the STH Realized Price, reflecting that short-term holders are sitting on profits.
The Crypto Fear and Greed Index metric, which measures the overall sentiment of the cryptocurrency market, dropped to nearly a four-month low on Saturday, indicating a shift in investor sentiment toward extreme fear following recent corrections. As of Tuesday, the metric had recovered to 49, reflecting a neutral sentiment and suggesting that bearish pressure may be easing.
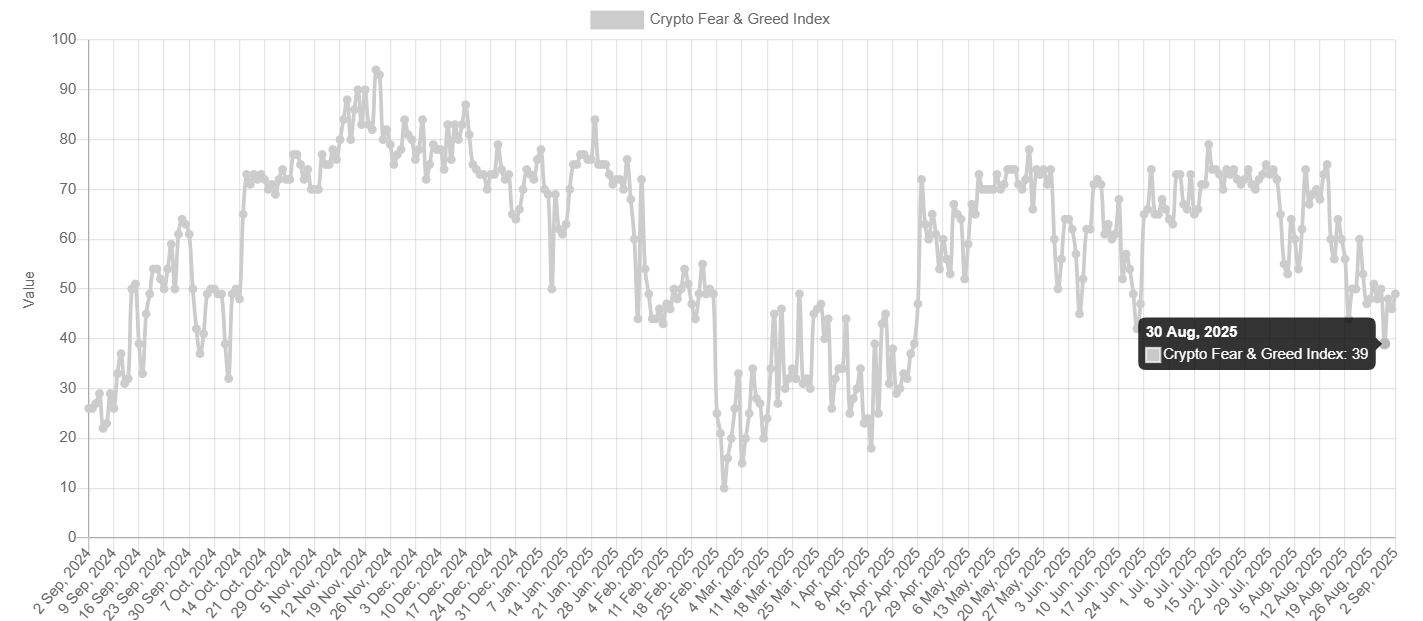
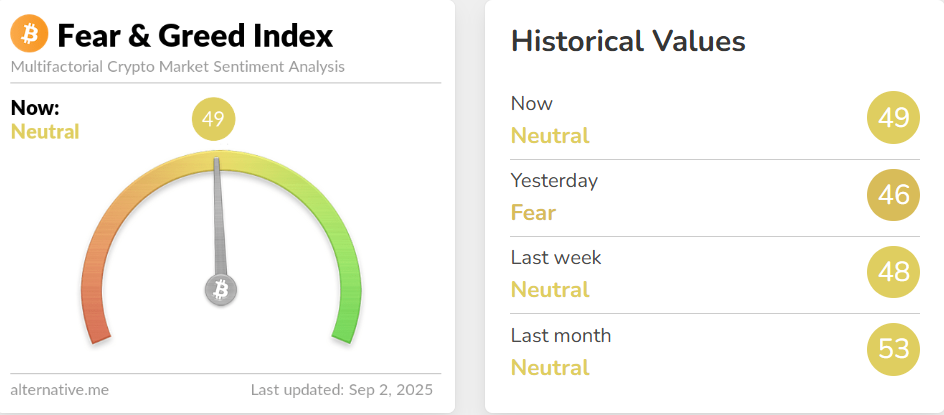
Crypto Fear and Greed Index metric chart. Source: Alternative
BTC traders await key macro releases this week
Bitcoin traders now look forward to important macroeconomic releases from the US scheduled at the beginning of a new month, starting with the ISM Manufacturing PMI on Tuesday. This week's US economic docket features the JOLTS Job Openings report on Wednesday, followed by the ADP report on private-sector employment and the ISM Services PMI on Thursday, ahead of the Nonfarm Payrolls (NFP) report on Friday.
These key economic data releases would provide more clues about the Federal Reserve's (Fed) rate-cut path and a fresh directional impetus for riskier assets, such as BTC.
Bitcoin Price Forecast: RSI shows signs of bullish reversal
Bitcoin price indicates a bullish RSI divergence is in play on the 4-hour chart. The formation of a lower low on Monday contrasts with the RSI’s higher highs during the same period. This development is termed a bullish divergence, which often signals a trend reversal after a recent correction.
BTC recovers slightly on Tuesday and retests its 50-period Exponential Moving Average (EMA) on the 4-hour chart at $110,424. If BTC closes above this level, it could extend the recovery toward its August 22 high of $117,429.
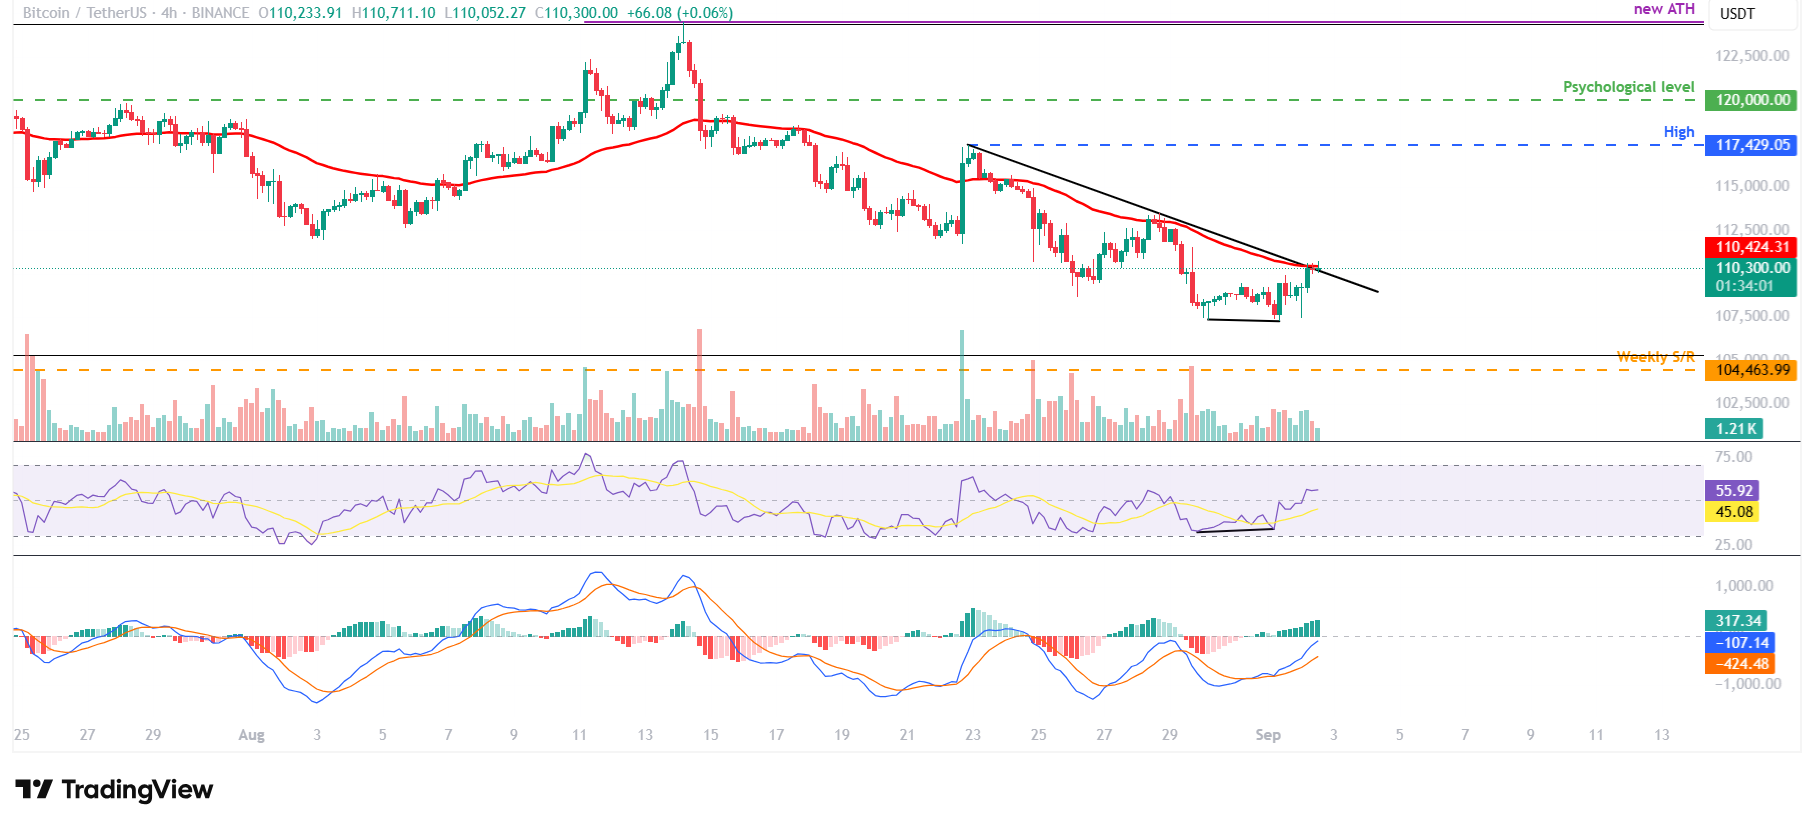
BTC/USDT 4-hour chart
On the daily chart, BTC extends its recovery and is approaching its 100-day EMA at $110,697. If BTC closes above this level on a daily basis, it could extend the recovery toward its daily resistance at $116,000.
The RSI on the daily chart reads 43 and points upward towards its neutral level of 50, indicating fading bearish momentum.
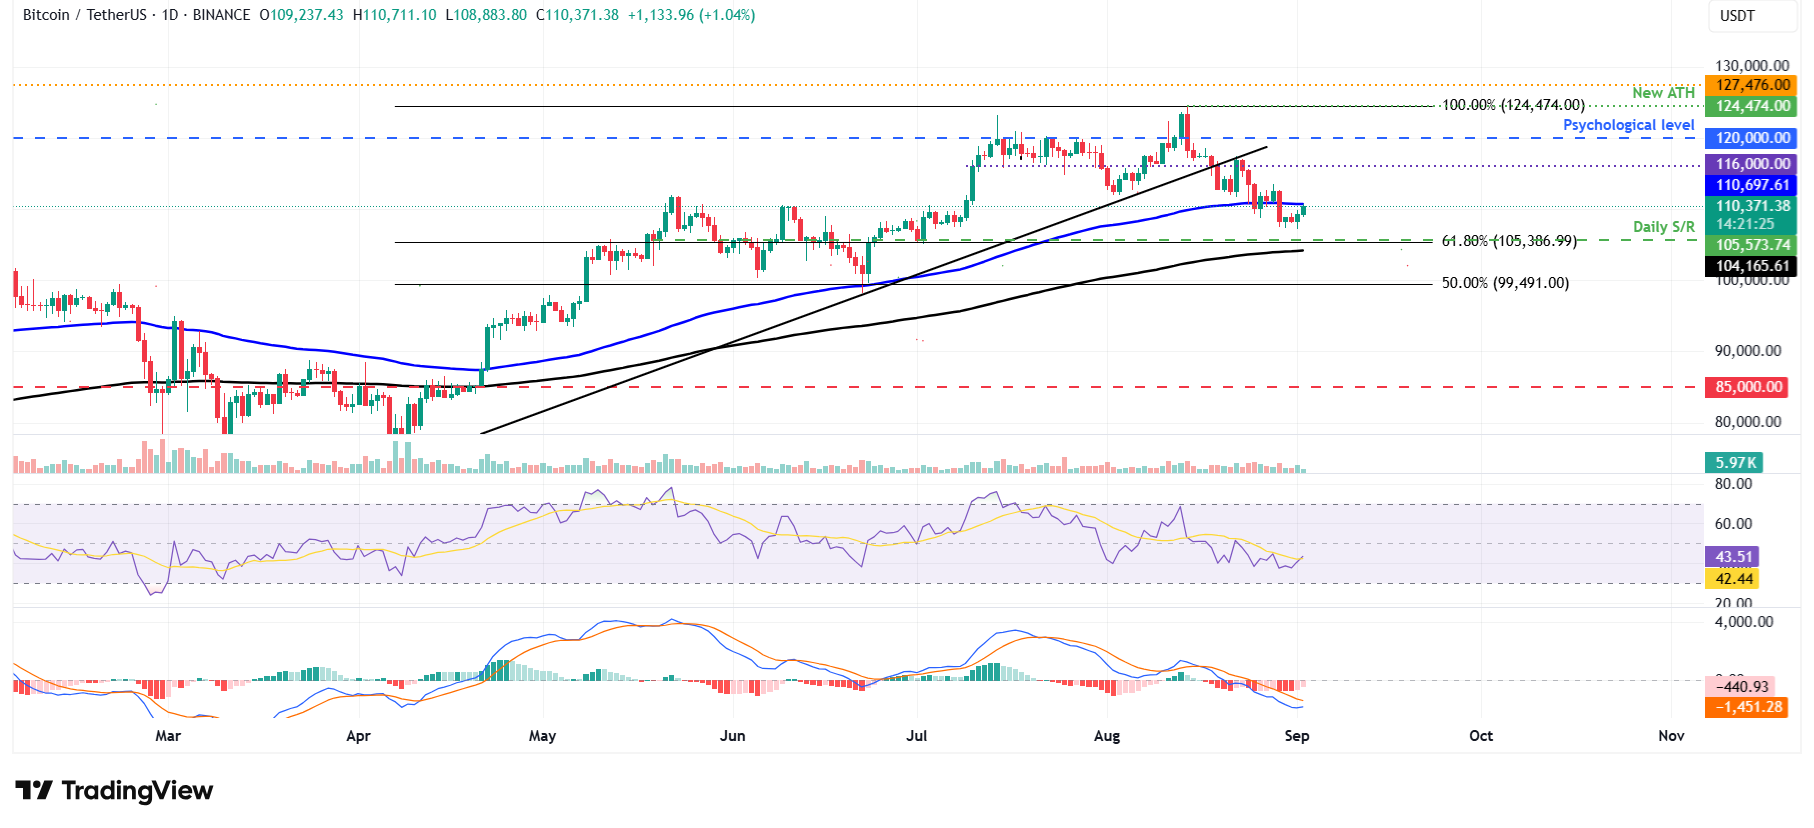
BTC/USDT daily chart
However, if BTC fails to close above the 100-day EMA at $110,697 and corrects, it could extend the decline toward its next daily support at $105,573.
Cryptocurrency metrics FAQs
The developer or creator of each cryptocurrency decides on the total number of tokens that can be minted or issued. Only a certain number of these assets can be minted by mining, staking or other mechanisms. This is defined by the algorithm of the underlying blockchain technology. On the other hand, circulating supply can also be decreased via actions such as burning tokens, or mistakenly sending assets to addresses of other incompatible blockchains.
Market capitalization is the result of multiplying the circulating supply of a certain asset by the asset’s current market value.
Trading volume refers to the total number of tokens for a specific asset that has been transacted or exchanged between buyers and sellers within set trading hours, for example, 24 hours. It is used to gauge market sentiment, this metric combines all volumes on centralized exchanges and decentralized exchanges. Increasing trading volume often denotes the demand for a certain asset as more people are buying and selling the cryptocurrency.
Funding rates are a concept designed to encourage traders to take positions and ensure perpetual contract prices match spot markets. It defines a mechanism by exchanges to ensure that future prices and index prices periodic payments regularly converge. When the funding rate is positive, the price of the perpetual contract is higher than the mark price. This means traders who are bullish and have opened long positions pay traders who are in short positions. On the other hand, a negative funding rate means perpetual prices are below the mark price, and hence traders with short positions pay traders who have opened long positions.

FXStreet
100만 명이 넘는 사용자가 FXStreet를 통해 실시간 시장 데이터, 차트 도구, 전문가 인사이트, 포렉스 뉴스를 이용합니다. 포괄적인 경제 캘린더와 교육 웨비나는 트레이더가 정보를 유지하고 신중한 결정을 내리도록 돕습니다. FXStreet는 바르셀로나 본사와 전 세계 지역에 걸쳐 약 60명의 팀으로 구성되어 있습니다.
Read More


