
BNB holds firm above $900 as quarterly burn, on-chain activity drive gains
작성자 Vishal Dixit
게시일: 16 Jan 2026 | 수정일: 16 Jan 2026


인기 기사

BNB (previously known as Binance Coin) trades in the green around $935 on Friday, recovering after a nearly 2% pullback the previous day and aligning with the priced-in BNB Foundation’s 34th quarterly burn of roughly 1.37 million BNB tokens.
- BNB steadies above $900 on Friday, with over 3% gains so far this week.
- BNB Foundation announced the 34th quarterly burn of 1.37 million tokens on Thursday.
- On-chain data shows a resurgence in transactional activity and user deposits.
BNB (previously known as Binance Coin) trades in the green around $935 on Friday, recovering after a nearly 2% pullback the previous day and aligning with the priced-in BNB Foundation’s 34th quarterly burn of roughly 1.37 million BNB tokens. Still, on-chain data shows BNB Chain warming up, with Total Value Locked (TVL) and transaction count rising.
BNB network growth continues, overlooking discounted token burning
BNB Foundation announced 1.37 million BNB tokens were wiped from the circulation, reducing supply. However, the token burning aligned with profit-taking on Thursday, suggesting that the event was already priced in.
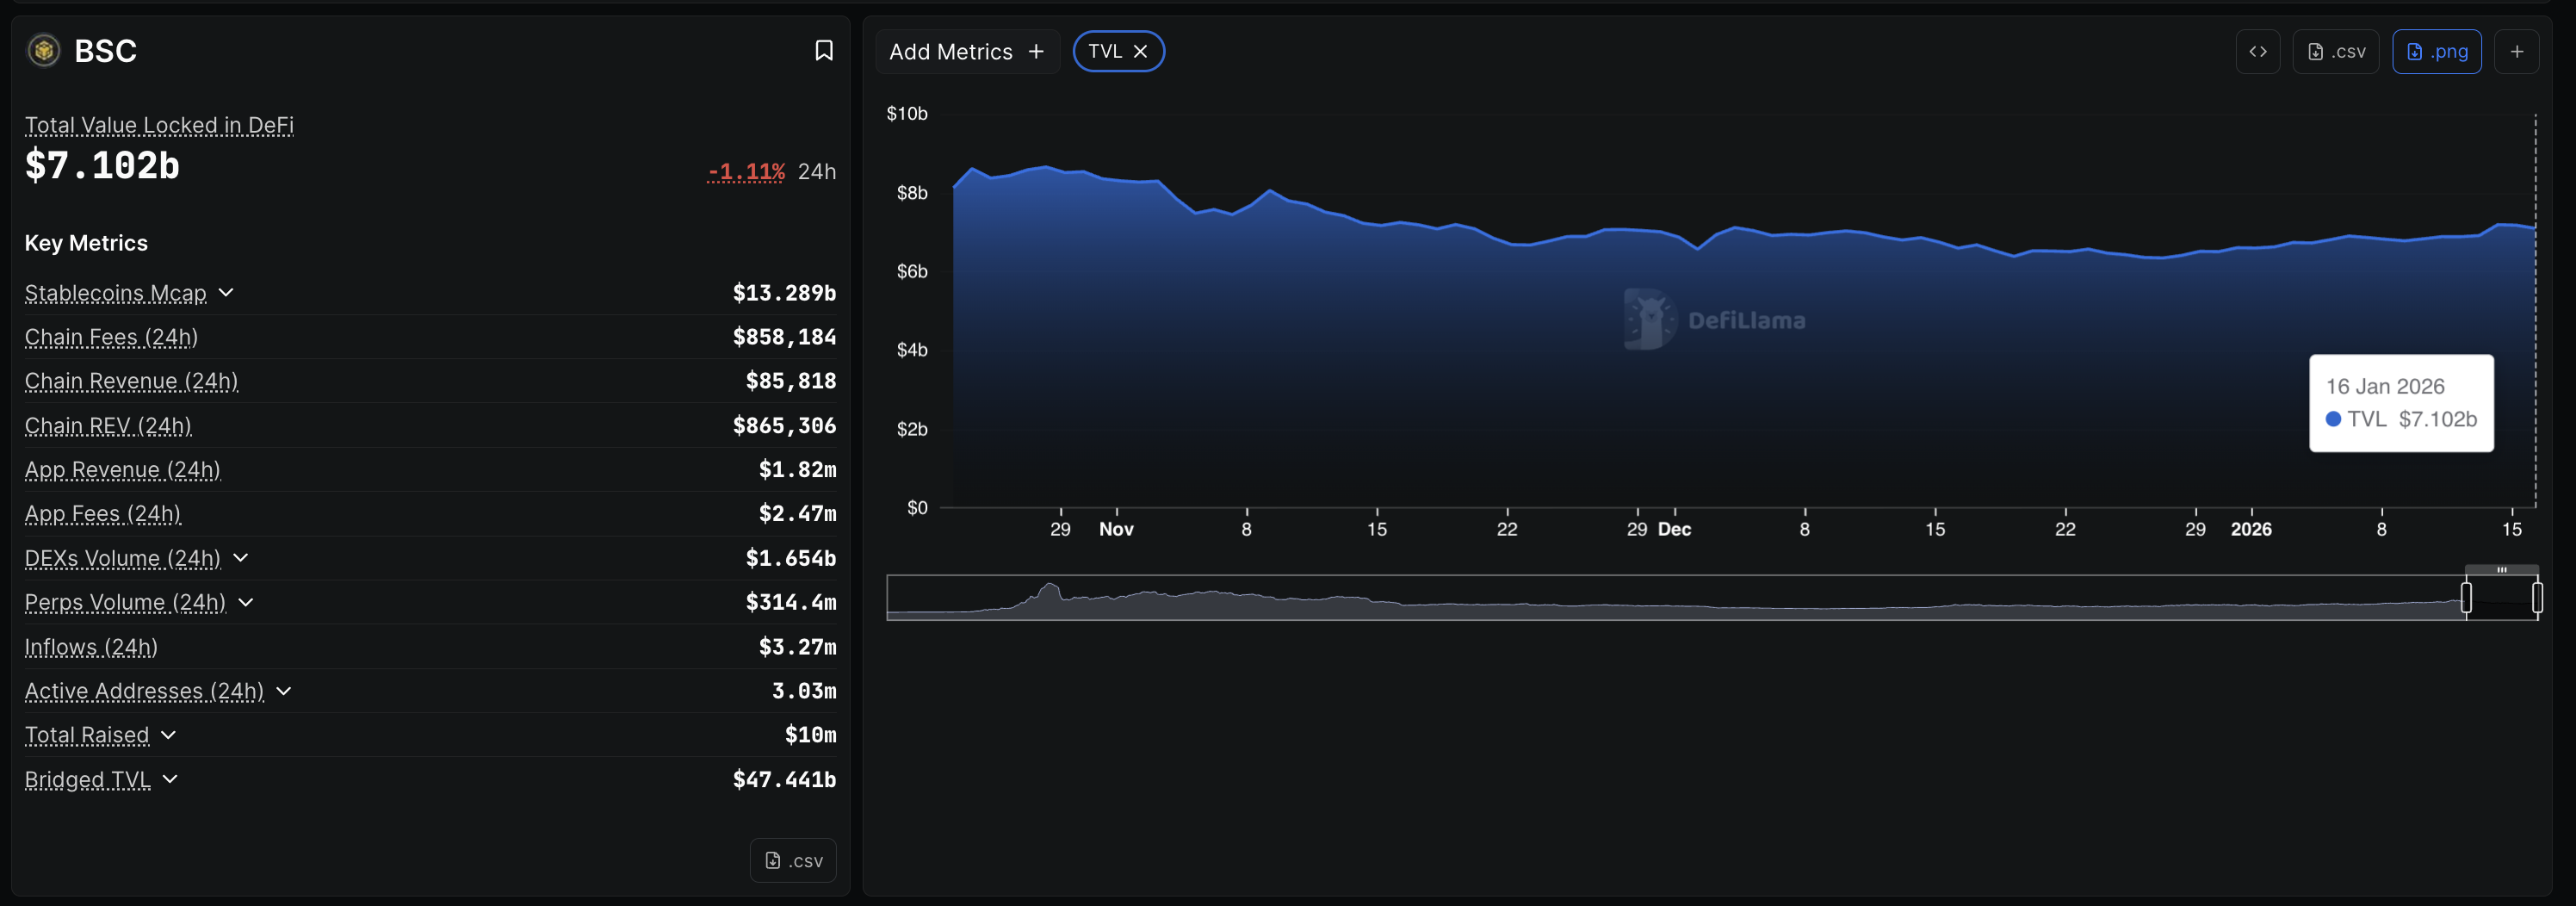
Still, BNB extends its recovery for the third consecutive week, strongly suggesting a local bottom formation. The recovery is consistent with a resurgence in network activity, including transactions and user deposits. DeFiLlama data shows that the total value of digital assets deposited on the BNB Chain stands at $7.102 billion on Friday, up from $6.602 billion on January 1.
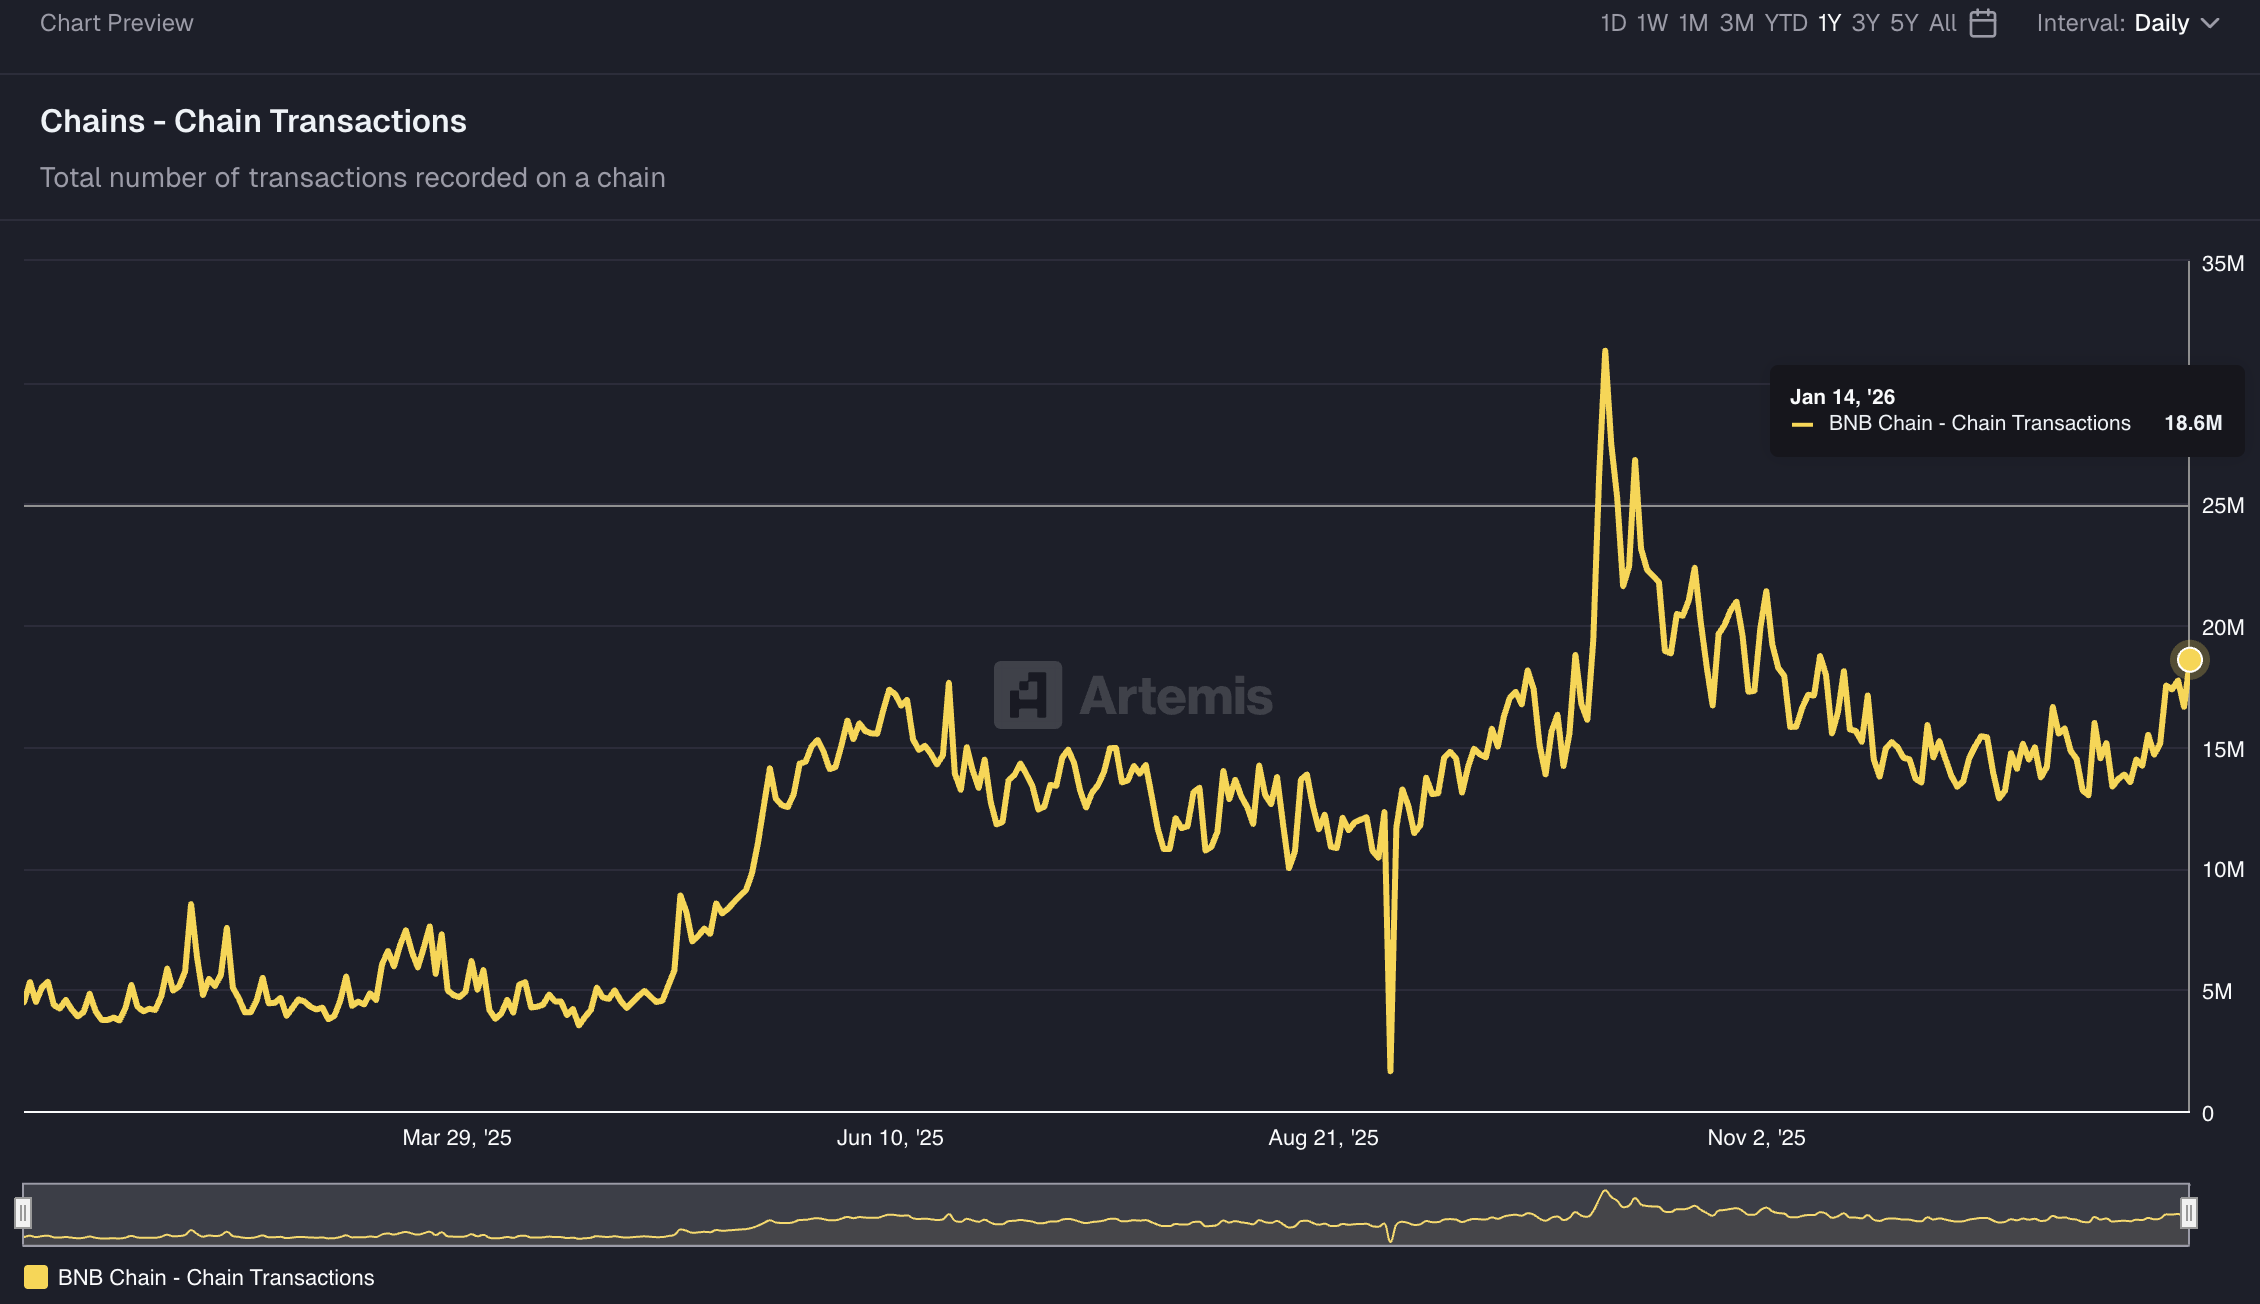
At the same time, Artemis Analytics data shows the transactions stood at 18.6 million on Wednesday, affirming renewed user activity. A steady network growth could back the demand for its native token, BNB.
Technical outlook: Will BNB bounce back above $1,000?
BNB price holds above key Exponential Moving Averages (EMAs), with the 20-, 50-, and 200-day EMAs rising and backing the upward bias. If the BNB recovers above $950 to clear Thursday’s pullback, it could follow toward $1,050, a crucial support level active in October now turned into resistance.
The Relative Strength Index (RSI) at 62 on the daily chart sustains upward bias while the K and D lines from the Stochastic RSI at 70 and 80, respectively, signal firm momentum with scope for brief consolidation before another leg higher.
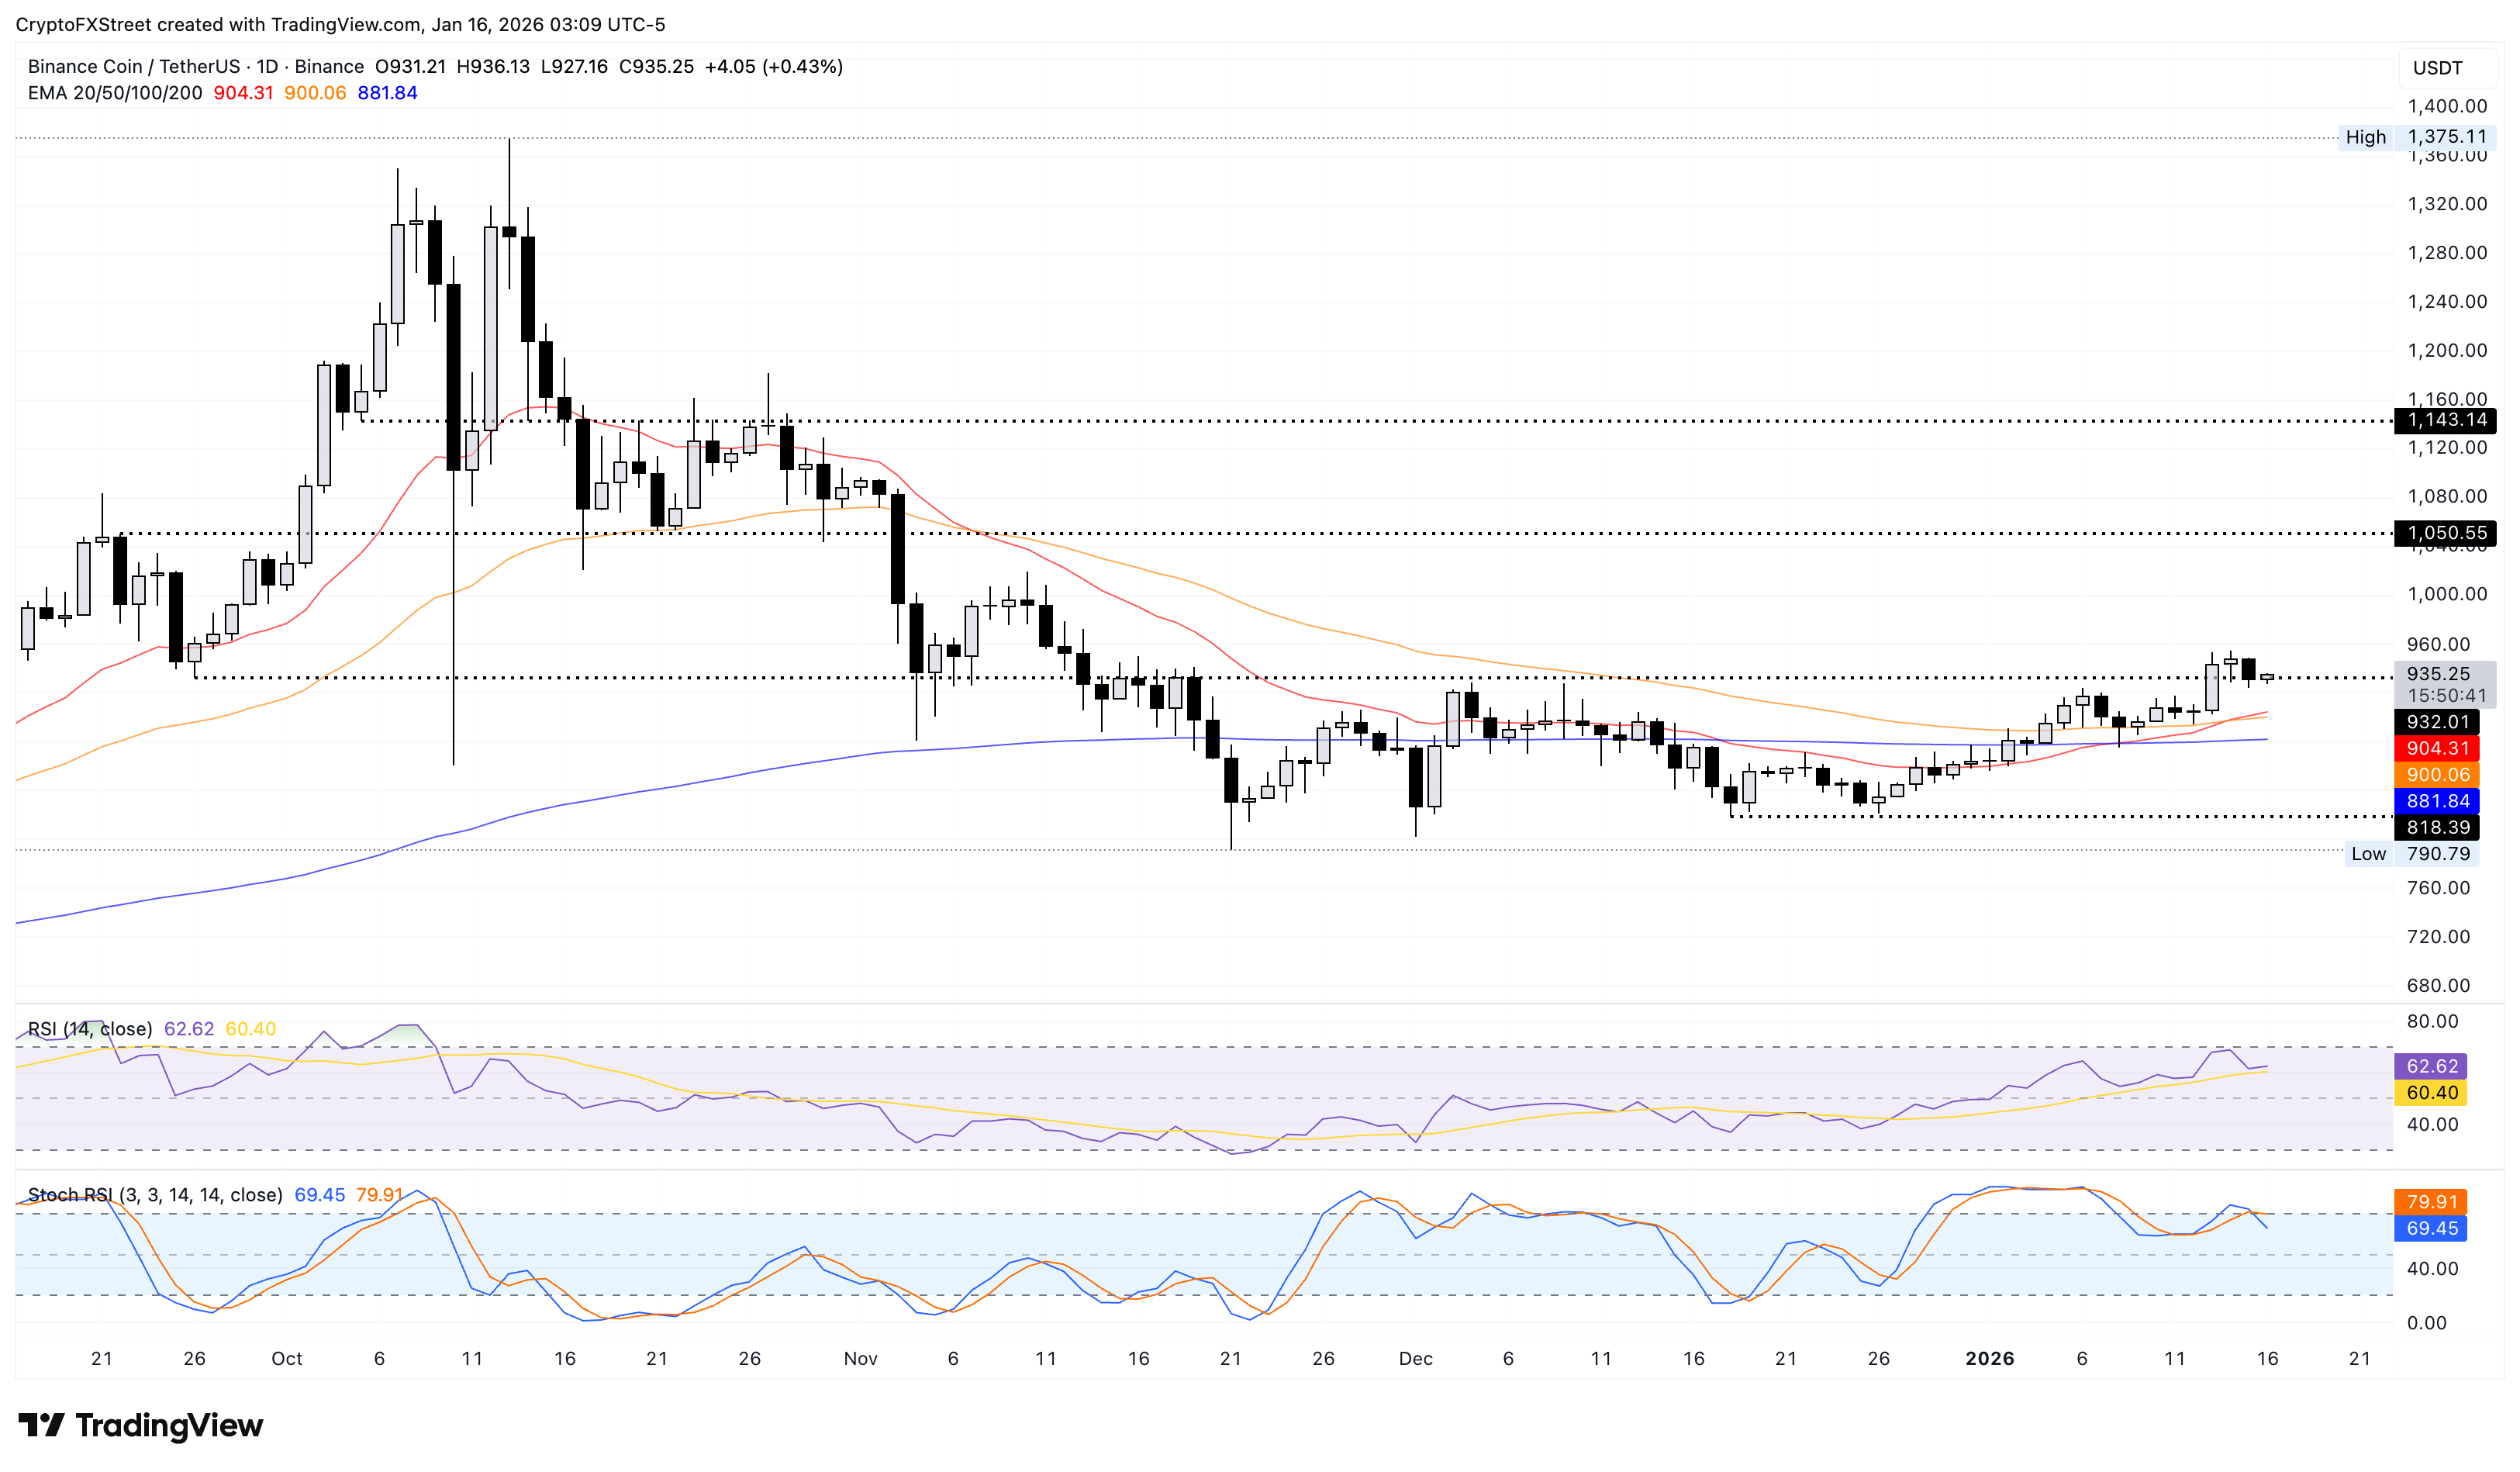
Looking down, initial support stands at the 20-day EMA at $904, with a deeper zone at the 200-day EMA at $881. A pullback into these levels would nullify the local bottom thesis, risking further correction or consolidation.
(The technical analysis of this story was written with the help of an AI tool.)

100만 명이 넘는 사용자가 FXStreet를 통해 실시간 시장 데이터, 차트 도구, 전문가 인사이트, 포렉스 뉴스를 이용합니다. 포괄적인 경제 캘린더와 교육 웨비나는 트레이더가 정보를 유지하고 신중한 결정을 내리도록 돕습니다. FXStreet는 바르셀로나 본사와 전 세계 지역에 걸쳐 약 60명의 팀으로 구성되어 있습니다.
더 읽기


