
BNB Price Forecast: BNB loses strength as crypto market drops
작성자 Vishal Dixit
게시일: 21 Jan 2026 | 수정일: 21 Jan 2026


인기 기사

BNB (formerly Binance Coin) loses ground as the broader cryptocurrency market falls, recording a 1% drop at the time of writing on Wednesday. Retail interest in the exchange token is declining, as evidenced by the massive wipeout of long positions and a decline in futures Open Interest.
- BNB edges lower by nearly 1% on Wednesday, extending the decline below the 200-day EMA.
- Derivatives data signals increased long liquidations and over 5% reduction in Open Interest, indicating a bearish shift in sentiment.
- The path of least resistance for BNB signals further downside risk toward $800.
BNB (formerly Binance Coin) loses ground as the broader cryptocurrency market falls, recording a 1% drop at the time of writing on Wednesday. Retail interest in the exchange token is declining, as evidenced by the massive wipeout of long positions and a decline in futures Open Interest. The technical outlook for BNB suggests further downside risk, as momentum indicators flash a sell signal.
Retail sentiment dims amid large liquidations
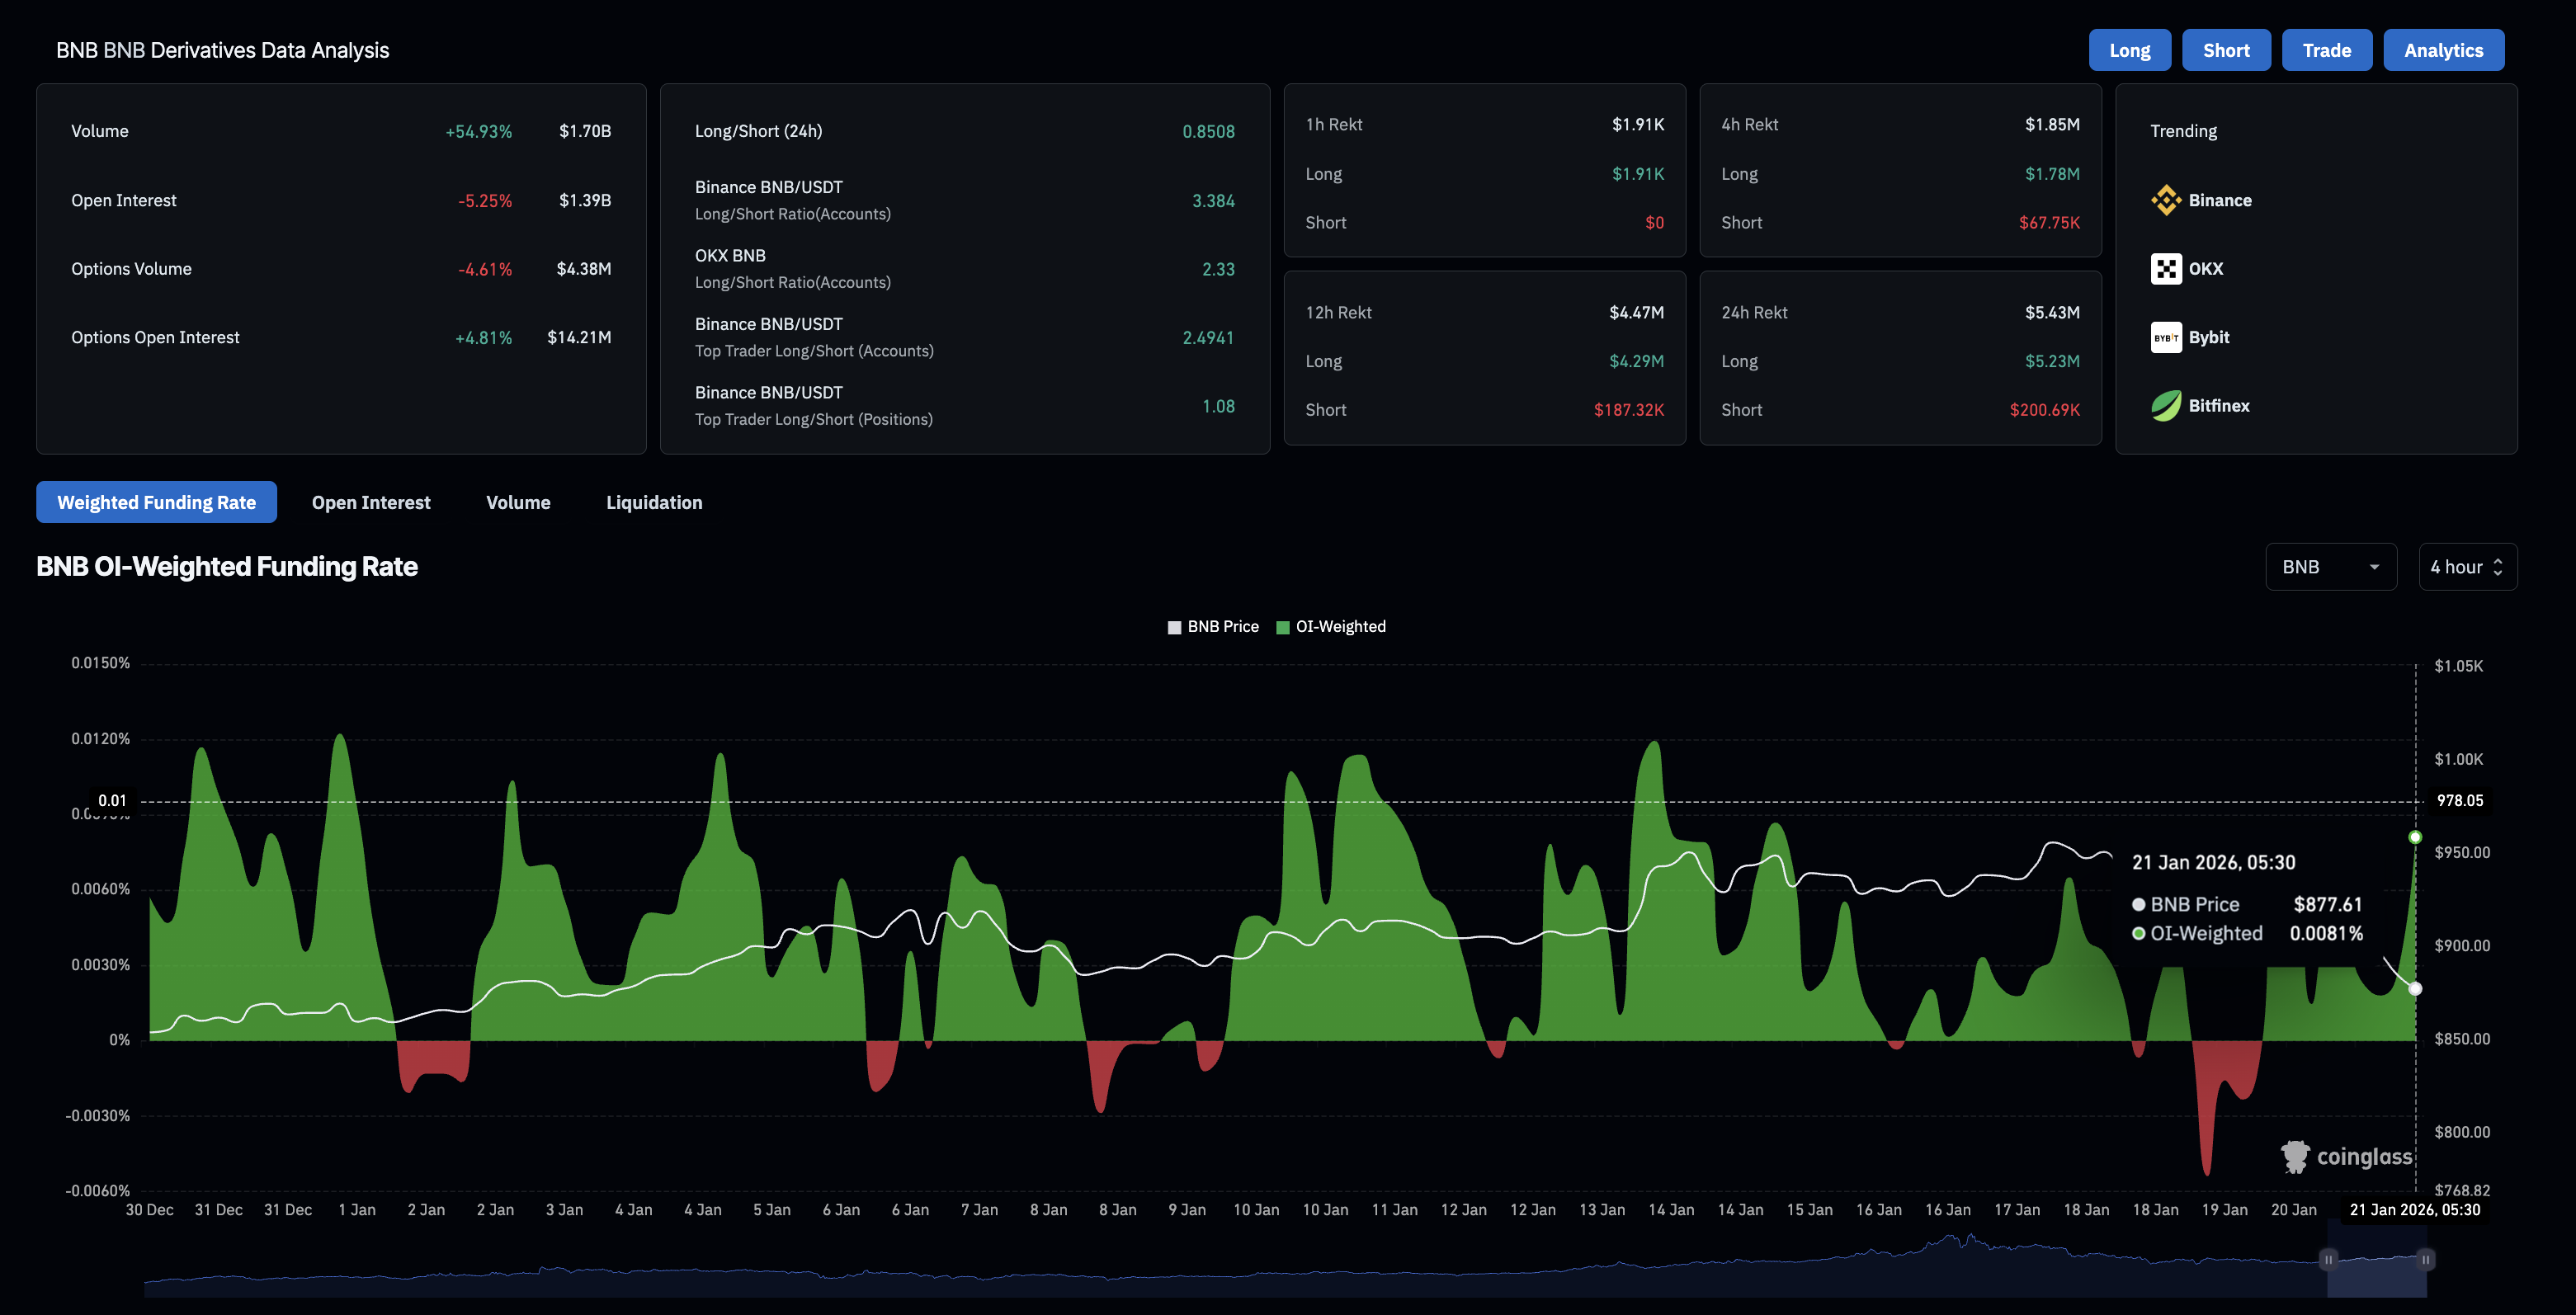
CoinGlass data shows that BNB Open Interest dropped by 5.25% to $1.39 billion over the last 24 hours, suggesting a decline in the value of outstanding futures contracts as traders close positions or reduce leverage.
A surge in long liquidations to $5.23 million over the last 24 hours, outpacing short liquidations of $220,690 by a wide margin, suggests that the wipeout of mostly bullish positions reduced capital exposure in BNB futures.
Technical outlook: Will BNB price crash to $800?
BNB price holds marginally below the 200-day Exponential Moving Average (EMA) at $883, while the 50-day EMA at $902 is sloping downward, suggesting a potential Death Cross.
The Moving Average Convergence Divergence (MACD) slips below the red line, races toward zero, widens the negative histogram, and suggests a surge in bearish momentum.
The Relative Strength Index (RSI) is at 42, crossing below the halfway line, indicating a surge in bearish momentum.
To reinstate an upward trend, BNB should resurface above the 200-day EMA at $883, which would improve the upside bias and target the 50-day EMA at $902.
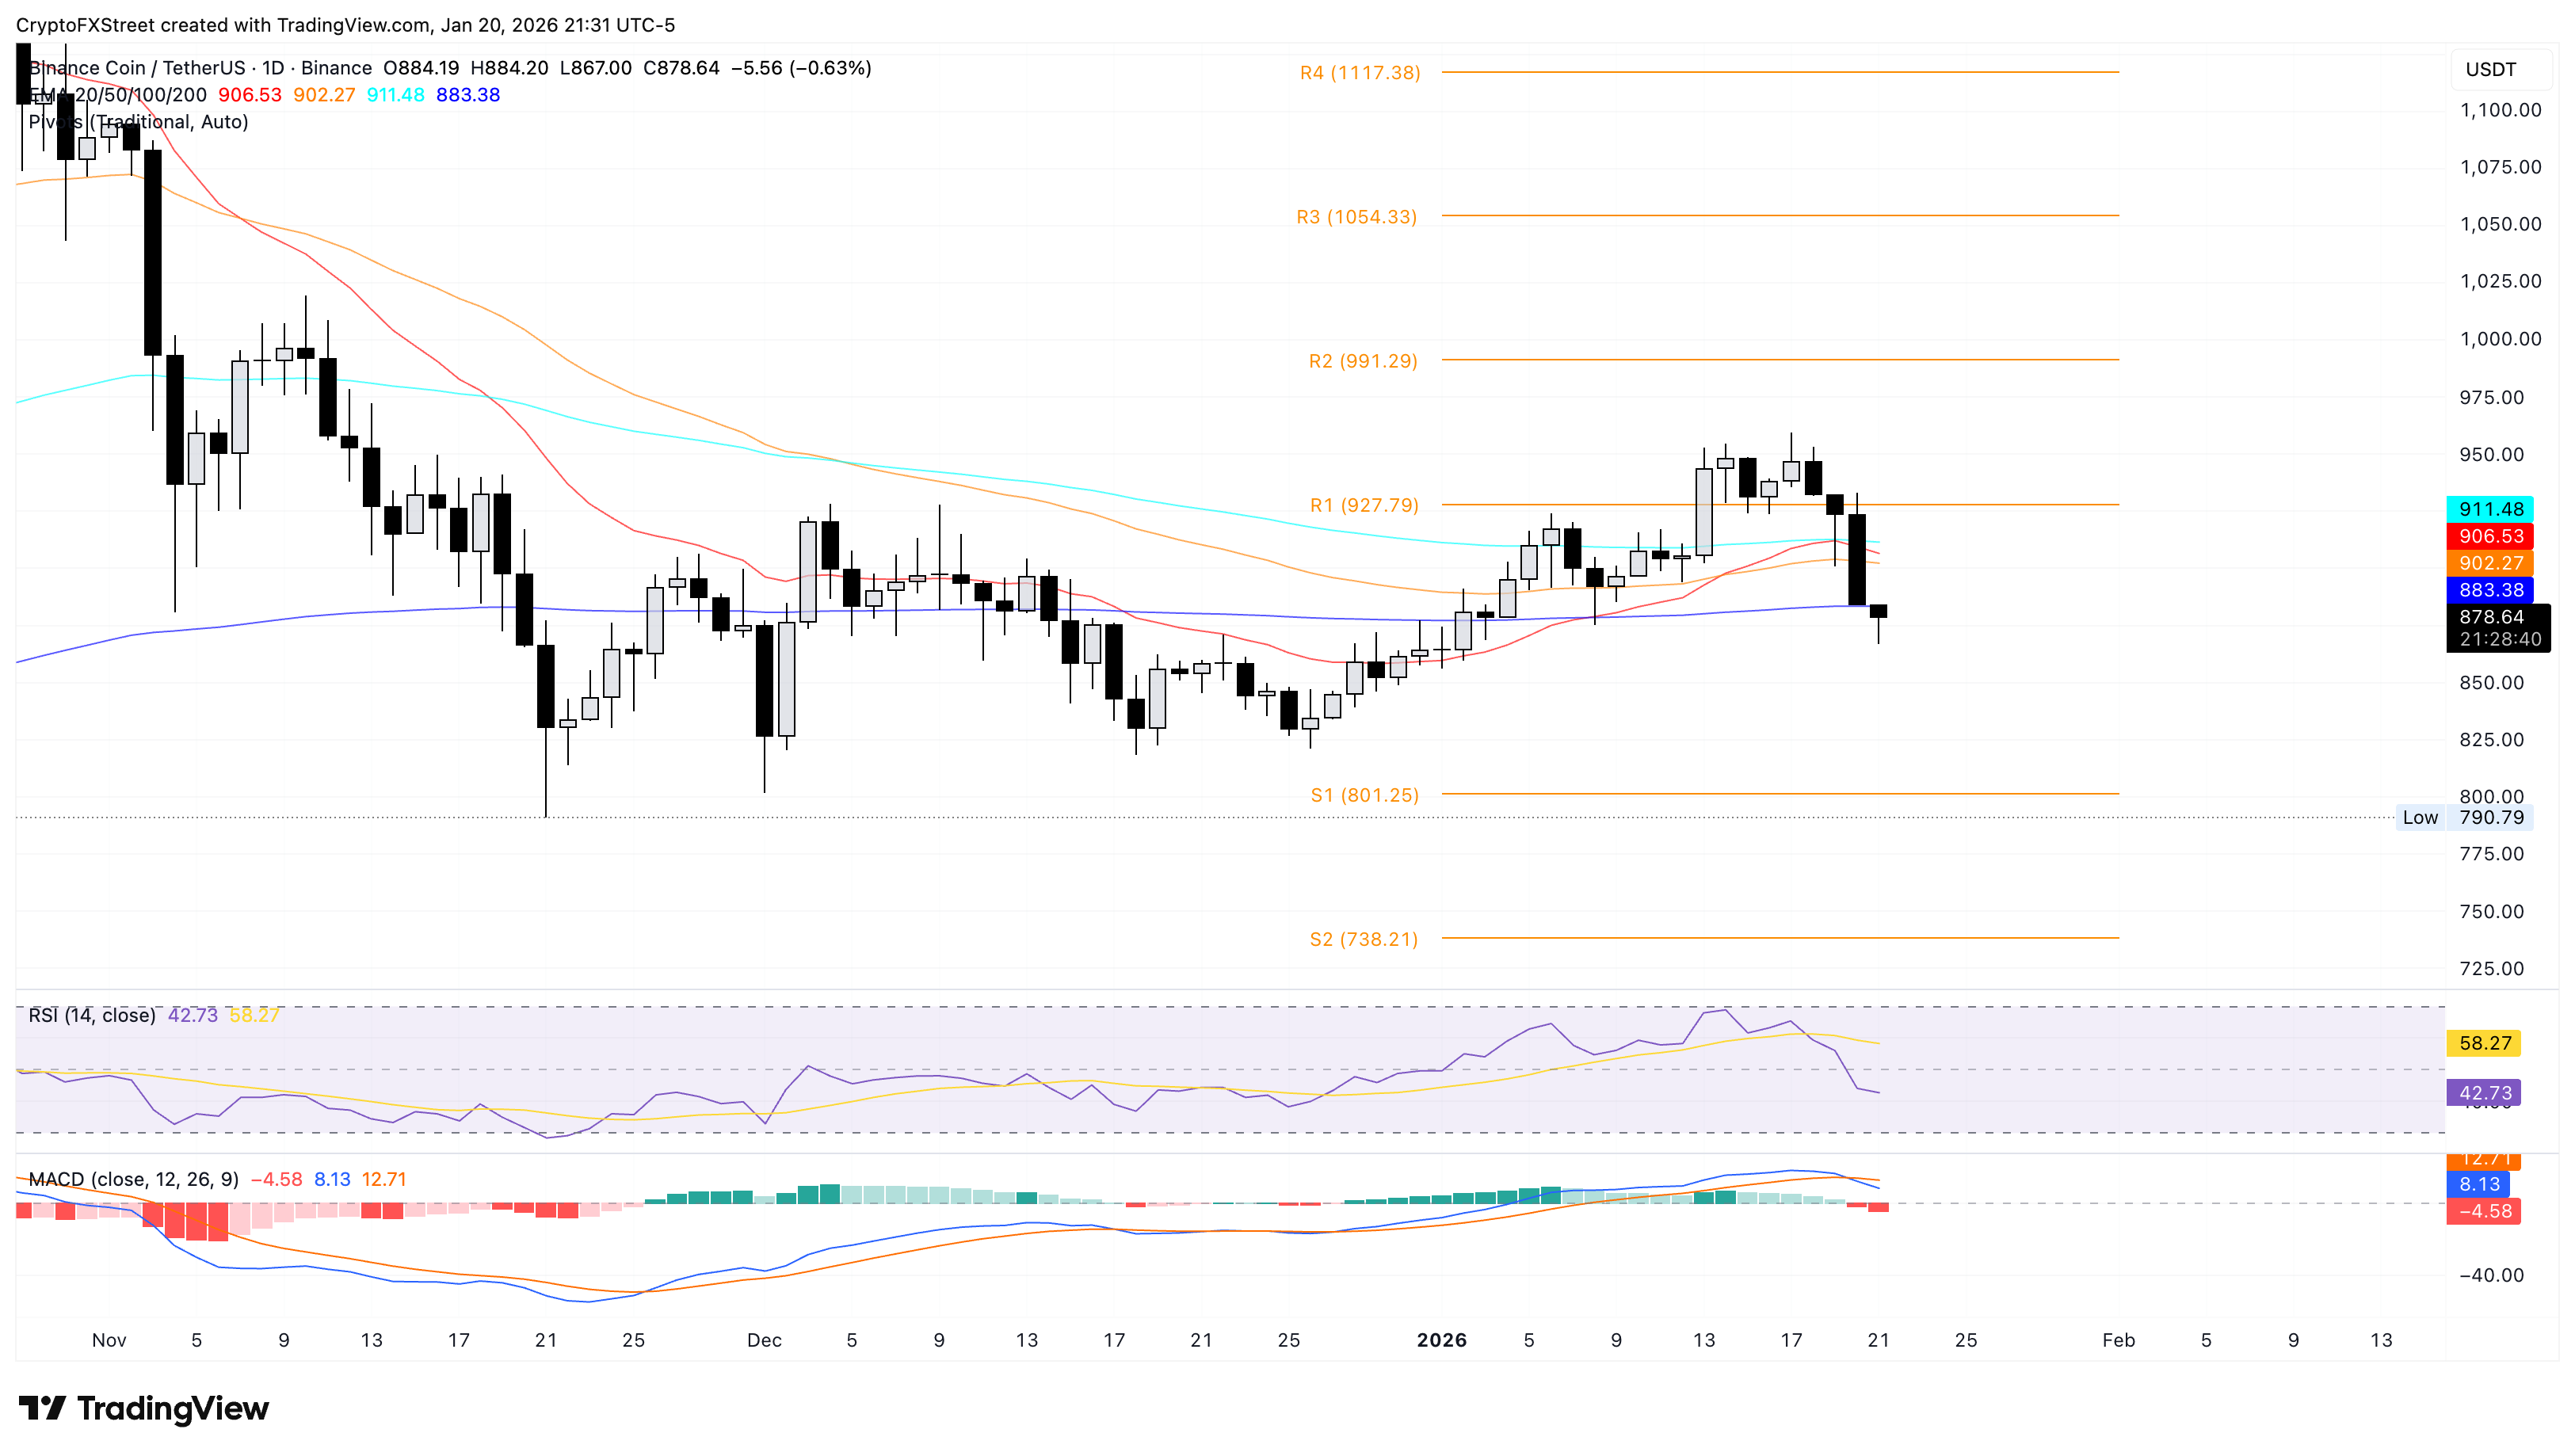
However, the path of least resistance targets the S1 Pivot Point at $801, consistent with the bearish shift in momentum.
(The technical analysis of this story was written with the help of an AI tool.)

100만 명이 넘는 사용자가 FXStreet를 통해 실시간 시장 데이터, 차트 도구, 전문가 인사이트, 포렉스 뉴스를 이용합니다. 포괄적인 경제 캘린더와 교육 웨비나는 트레이더가 정보를 유지하고 신중한 결정을 내리도록 돕습니다. FXStreet는 바르셀로나 본사와 전 세계 지역에 걸쳐 약 60명의 팀으로 구성되어 있습니다.
더 읽기


