
Trade The World
BNB Price Forecast: BNB risks a 10% drop as sell-off wave amplifies
작성자 Vishal Dixit
게시일: 26 Sep 2025 | 수정일: 26 Sep 2025


POPULAR ARTICLES

BNB (BNB), previously known as Binance coin, trades below $1,000 after the 7% drop on the previous day. At the time of writing, BNB extends the loss by nearly 1% on Friday, approaching the support trendline of a rising channel.
- BNB reverts within a rising channel as the broader cryptocurrency market corrects.
- Derivatives data show significant capital outflows, as indicated by Open Interest, suggesting a lower level of traders’ confidence.
- The technical outlook suggests that BNB is approaching crucial crossroads as buying pressure wanes.
BNB (BNB), previously known as Binance coin, trades below $1,000 after the 7% drop on the previous day. At the time of writing, BNB extends the loss by nearly 1% on Friday, approaching the support trendline of a rising channel. Both the derivatives and technical outlook suggest a sudden decline in buying pressure, flashing risks of further correction.
Sell-side dominance arises in BNB derivatives
CoinGlass data indicates that the BNB Open Interest has decreased by 3.56% over the last 24 hours, now standing at $1.84 billion. This significant capital outflow from BNB derivatives indicates a risk-off sentiment among traders.
Adding to the lowered interest, the OI-weighted funding rate has dropped to 0.0062% from 0.0091% earlier in the day. Furthermore, the long liquidations of $11.91 million in the last 24 hours outpace short liquidations at $721,610, indicating a larger wipeout of bullish-aligned traders.
Finally, the 24-hour long-to-short ratio reads 0.9279, indicating that a greater number of short positions are active, suggesting a sell-side dominance.
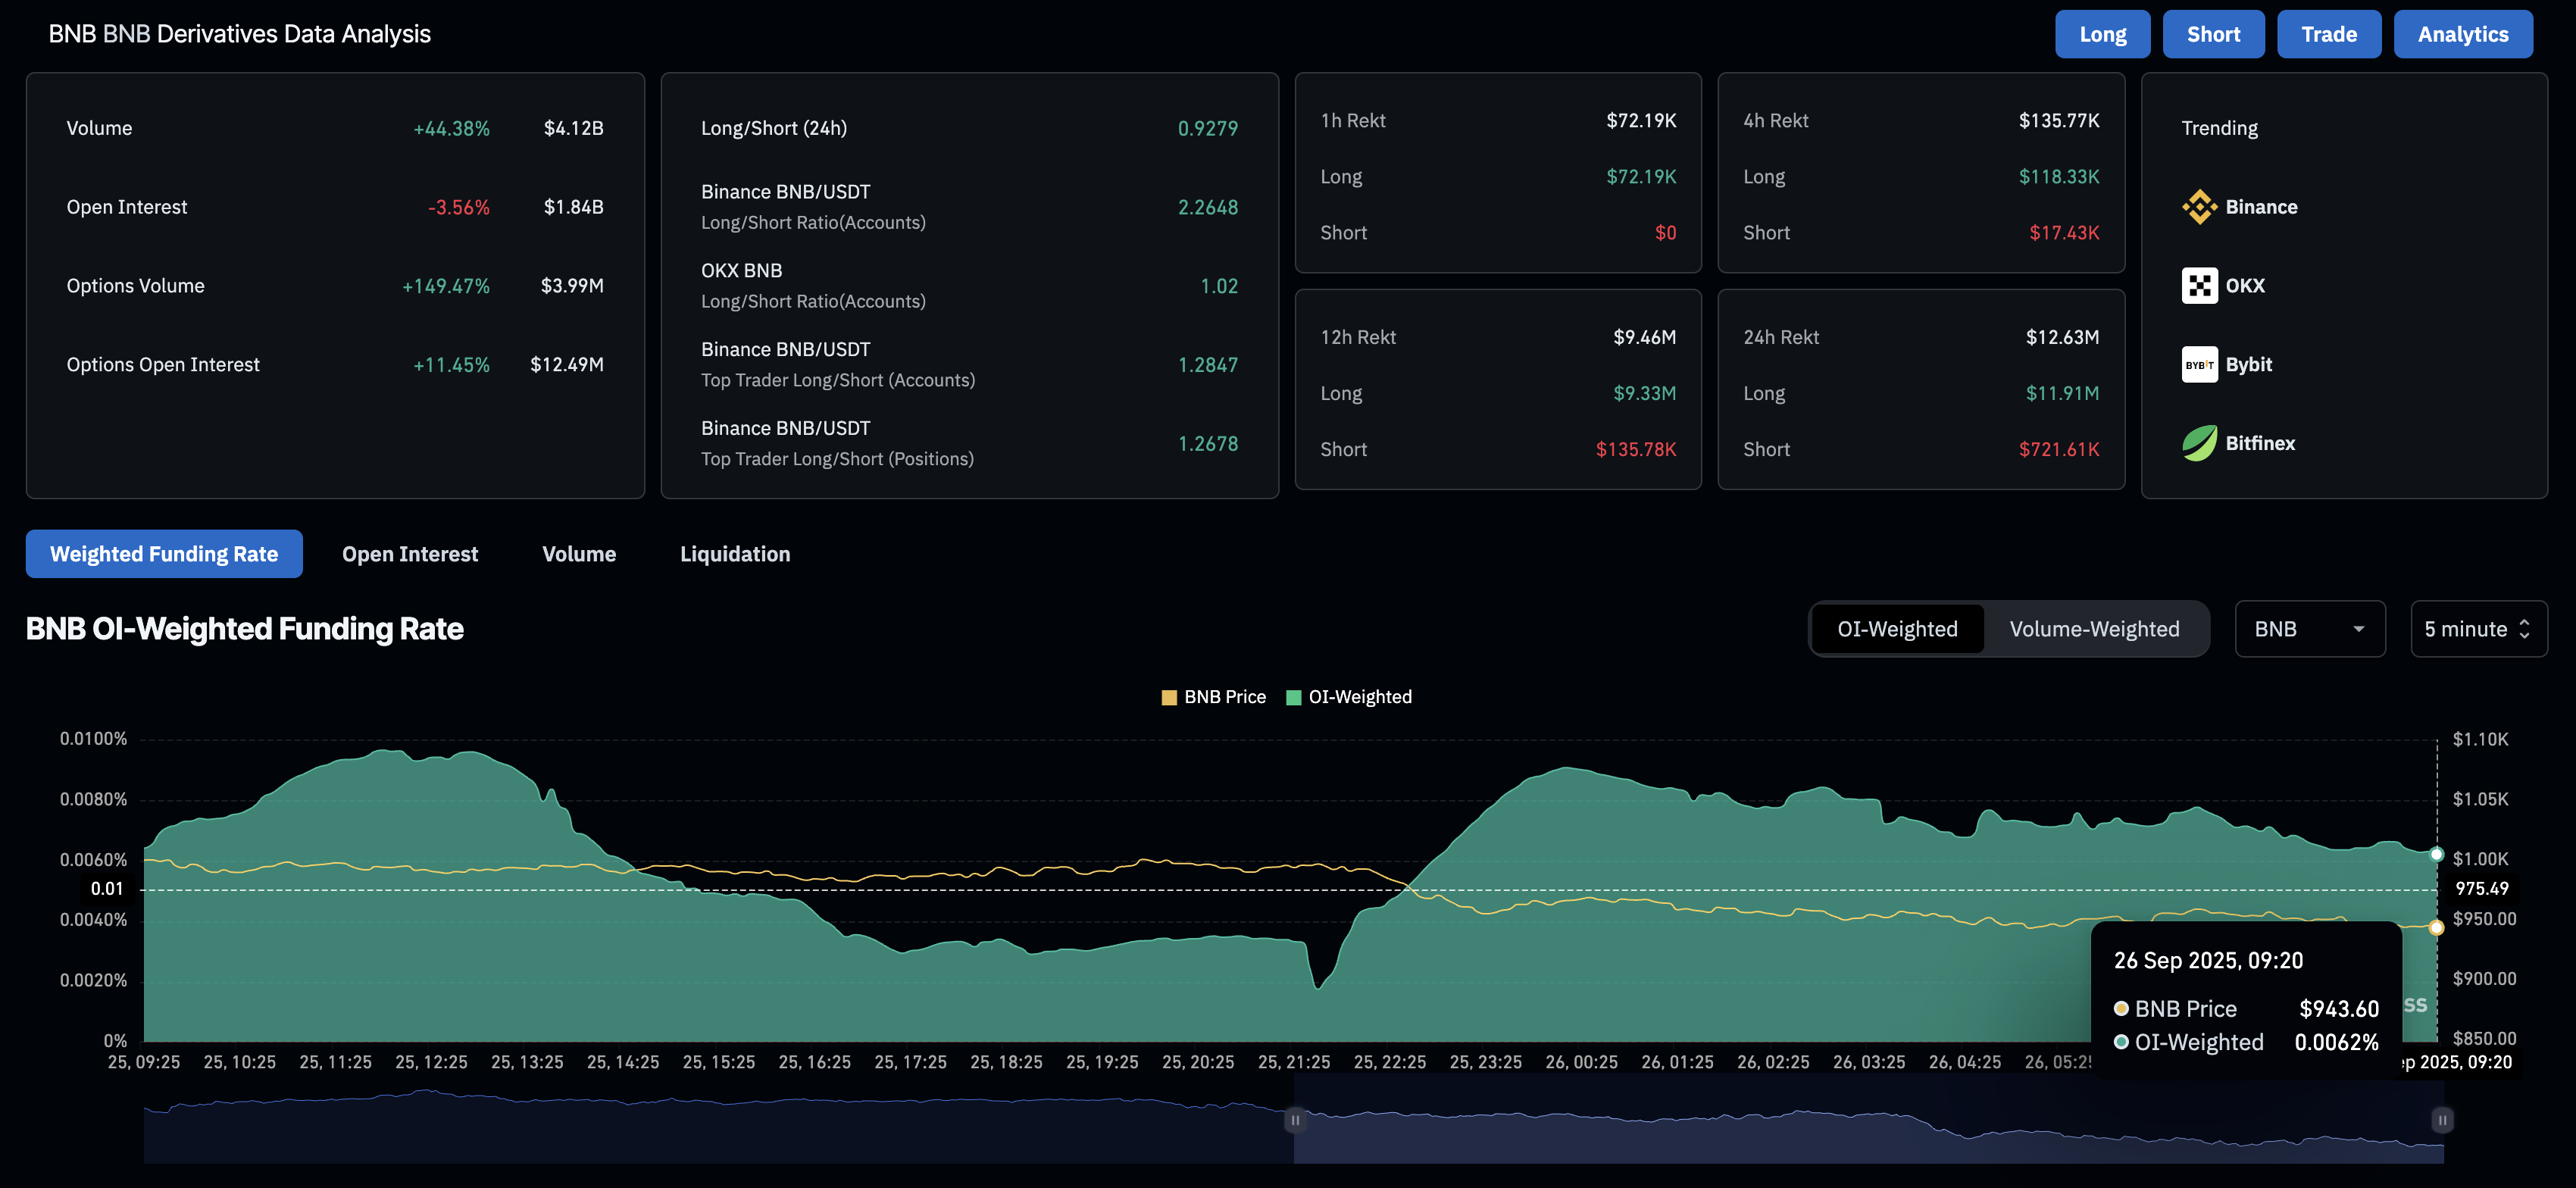
BNB derivatives. Source: CoinGlass
BNB risks channel breakdown as buying pressure wanes
BNB is approaching the lower boundary line of a rising channel pattern on the daily chart. The Centralized Exchange (CEX) token reversed from the overhead trendline at its all-time high of $1,083 on Sunday, igniting the current downcycle within the parallel channel.
To confirm the channel fallout, BNB bears must achieve a decisive close below the R1 pivot level, which serves as resistance-turned-support at $928. A potential downside breakout could extend the decline to the 50-day Exponential Moving Average (EMA) at $895, followed by the centre pivot level at $829.
The technical indicators on the daily chart reflect a decrease in buying pressure, which increases the chances of a potential breakdown. The Moving Average Convergence Divergence (MACD) extends the downside movement after crossing below its signal line on Thursday, indicating a rise in bearish momentum.
Additionally, the Relative Strength Index (RSI) reads 50 on the same chart, marking a significant decline from the overbought zone as buying pressure wanes.
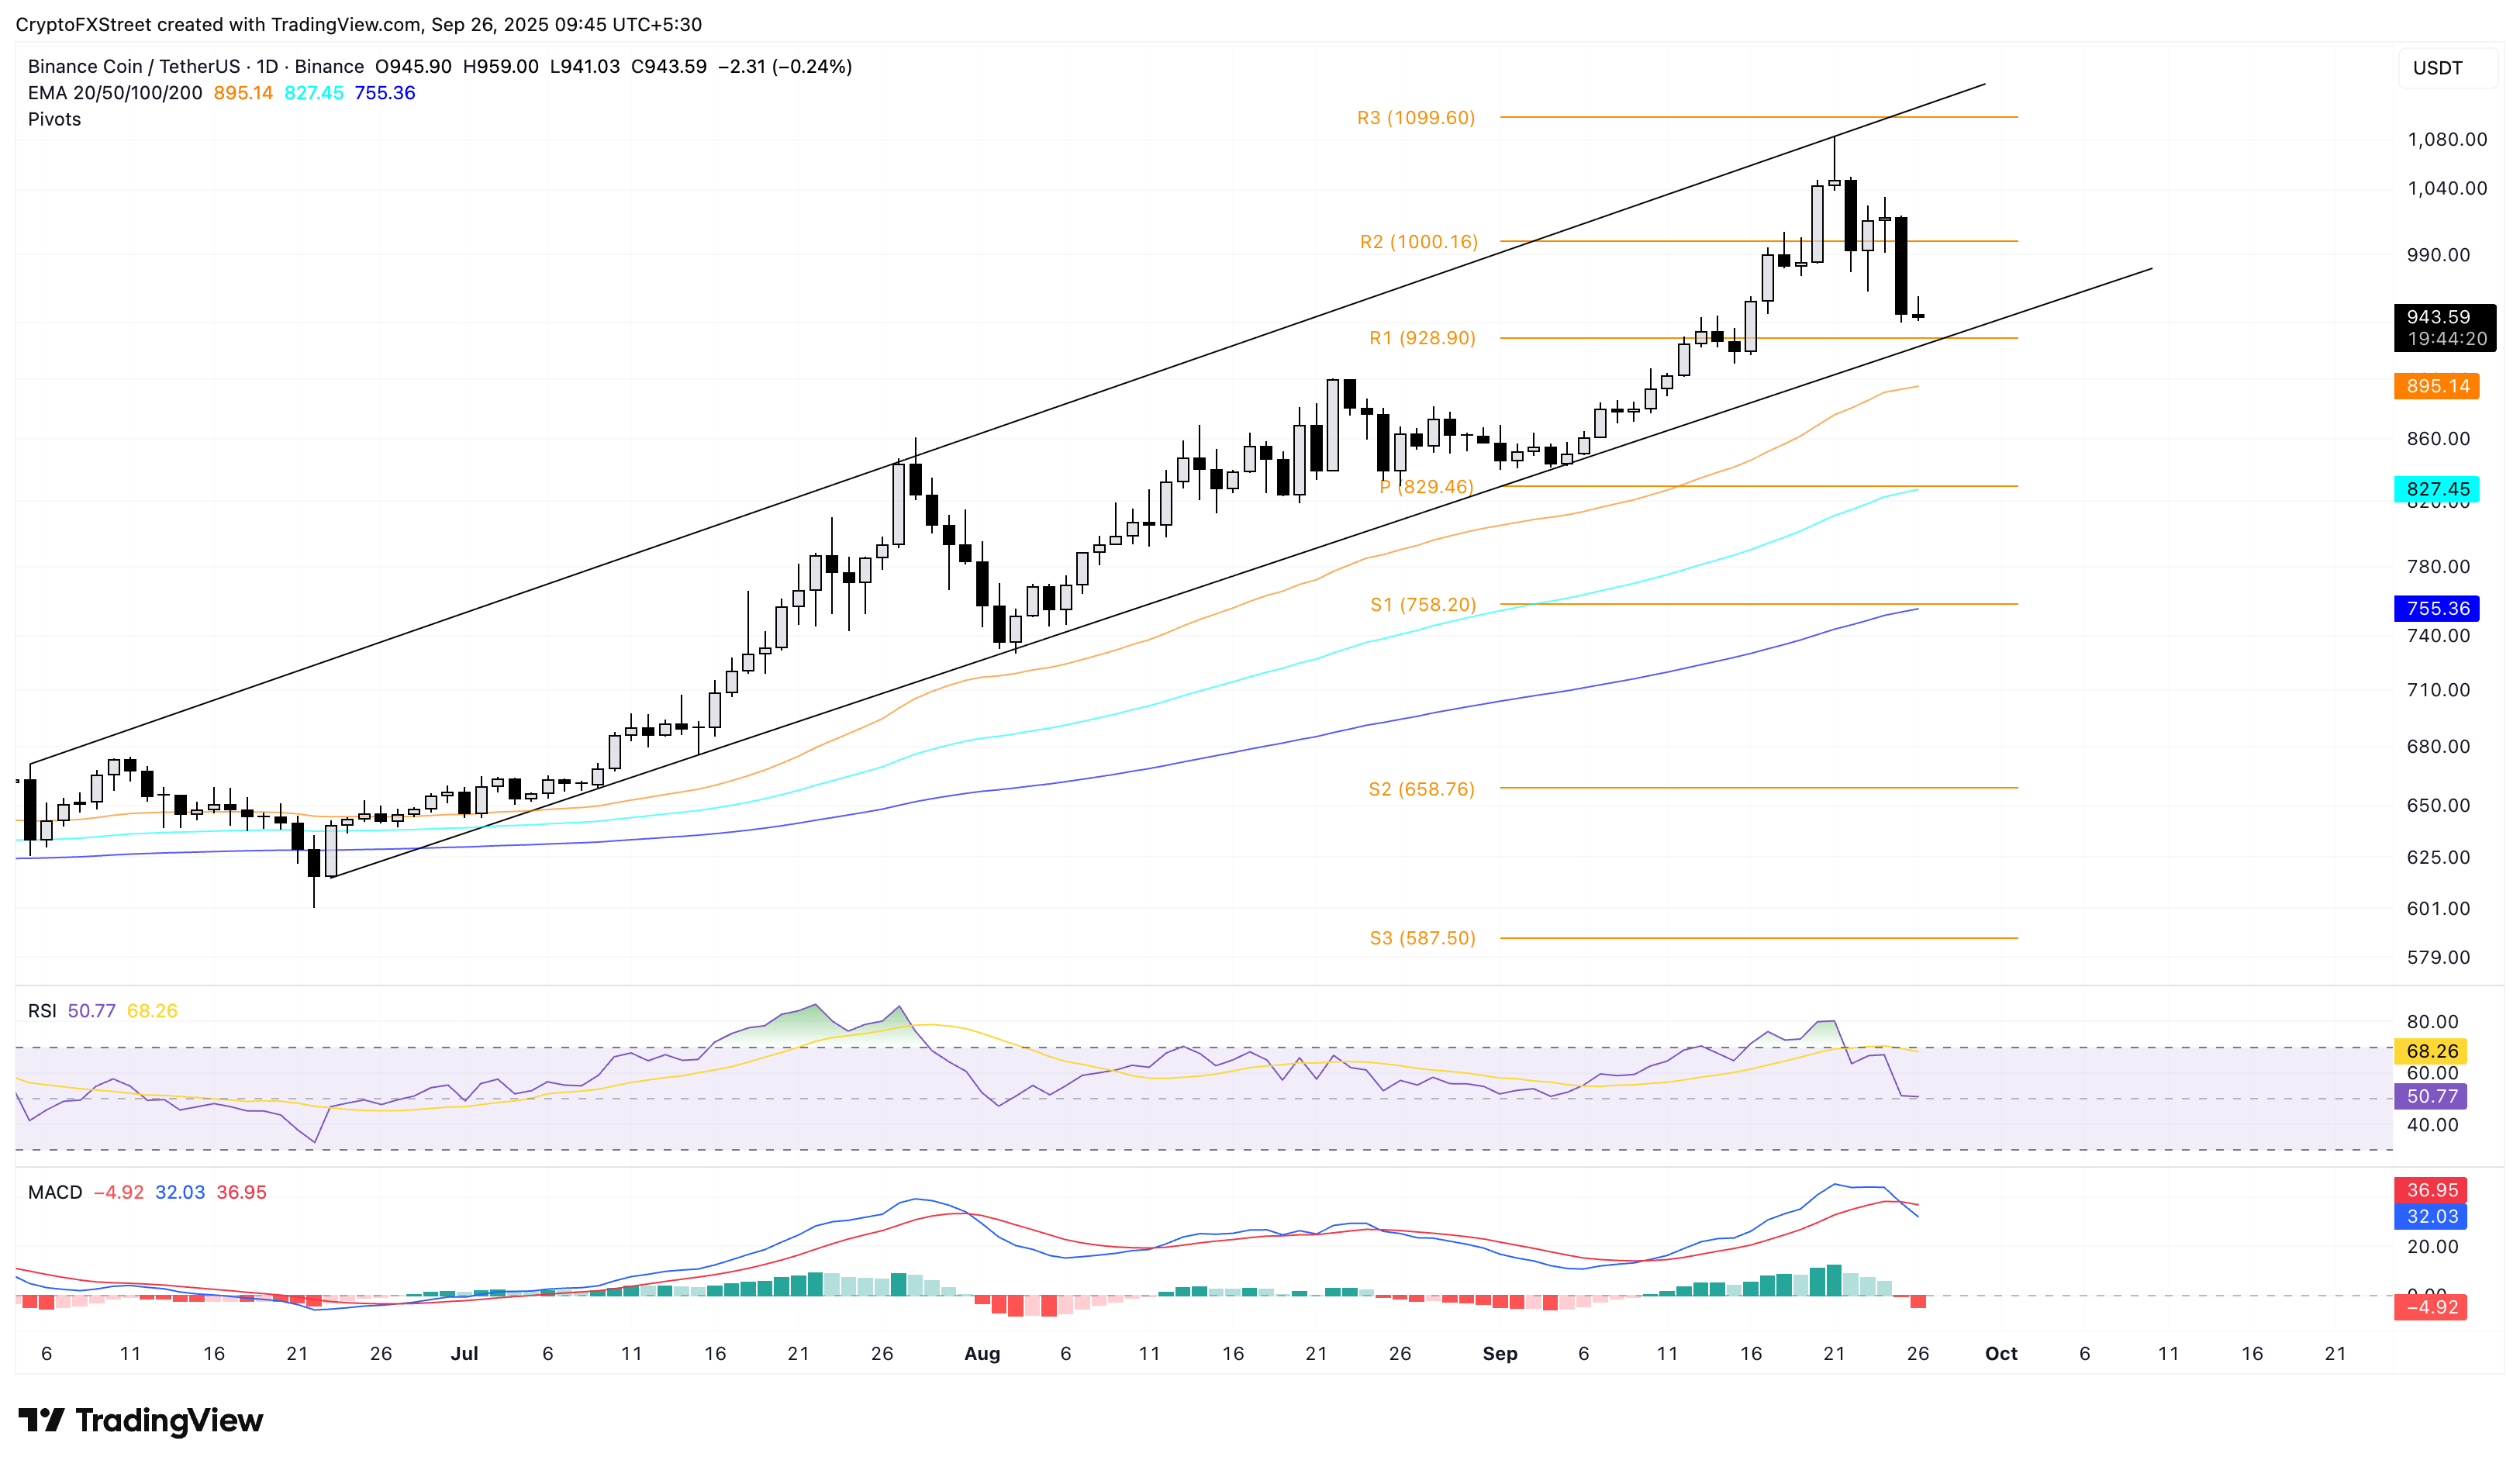
BNB/USDT daily price chart.
On the upside, if BNB rebounds from $928, it could retest the R2 resistance at $1,000 psychological milestone.

FXStreet
100만 명이 넘는 사용자가 FXStreet를 통해 실시간 시장 데이터, 차트 도구, 전문가 인사이트, 포렉스 뉴스를 이용합니다. 포괄적인 경제 캘린더와 교육 웨비나는 트레이더가 정보를 유지하고 신중한 결정을 내리도록 돕습니다. FXStreet는 바르셀로나 본사와 전 세계 지역에 걸쳐 약 60명의 팀으로 구성되어 있습니다.
Read More


