
Trade The World
Cardano Price Forecast: ADA extends correction as bears tighten grip
작성자 Manish Chhetri
게시일: 8 Oct 2025 | 수정일: 8 Oct 2025


POPULAR ARTICLES

Cardano (ADA) is trading in the red, currently below $0.82 at the time of writing on Wednesday, following a nearly 6% correction on the previous day.
- Cardano price continues to trade in the red on Wednesday after falling nearly 6% the previous day.
- On-chain and derivatives data signal weakness as Spot Taker CVD stays negative and bearish bets increase.
- The technical outlook suggests a correction, with momentum indicators indicating early signs of weakening momentum.
Cardano (ADA) is trading in the red, currently below $0.82 at the time of writing on Wednesday, following a nearly 6% correction on the previous day. On-chain signals and rising bearish bets in derivatives markets point to sustained weakness, while technical indicators suggest ADA may face a deeper correction ahead.
Cardano’s on-chain and derivatives data hint at a correction
CryptoQuant’s Spot Taker CVD for Cardano is negative, and its value has been steadily rising since mid-July. This metric measures the cumulative difference between market buy and sell volumes over a three-month period. When the three-month CVD is positive, it suggests the Taker Buy Dominant Phase. A negative value, as it is currently happening, indicates the Taker Sell Dominant Phase.
 (2)-1759899301831-1759899301833.png)
Cardano Spot Taker CVD chart. Source: CryptoQuant
On the derivatives side, CoinGlass’s ADA long-to-short ratio, which stands at 0.89, is nearly its monthly high. This ratio, below one, reflects bearish sentiment in the markets, as more traders are betting on the asset price to fall.
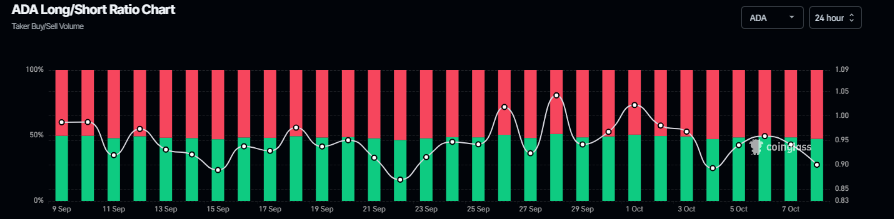
Cardano’s long-to-short ratio chart. Source: Coinglass
Cardano Price Forecast: ADA momentum indicators reflect early signs of weakness
Cardano price failed to find support around the daily support level at $0.84 on Tuesday and corrected nearly 6%, closing below the 61.8% Fibonacci retracement level at $0.82. At the time of writing on Wednesday, it continues to trade in red at around $0.81.
If ADA continues its pullback, it could extend the correction toward the 200-day Exponential Moving Average (EMA) at $0.76.
The Relative Strength Index (RSI) on the daily chart reads 45, which is below the neutral level of 50, indicating that bearish momentum is gaining traction. The Moving Average Convergence Divergence (MACD) lines are about to flip a bearish crossover. If MACD flips to a bearish crossover, it would further support the bearish view.
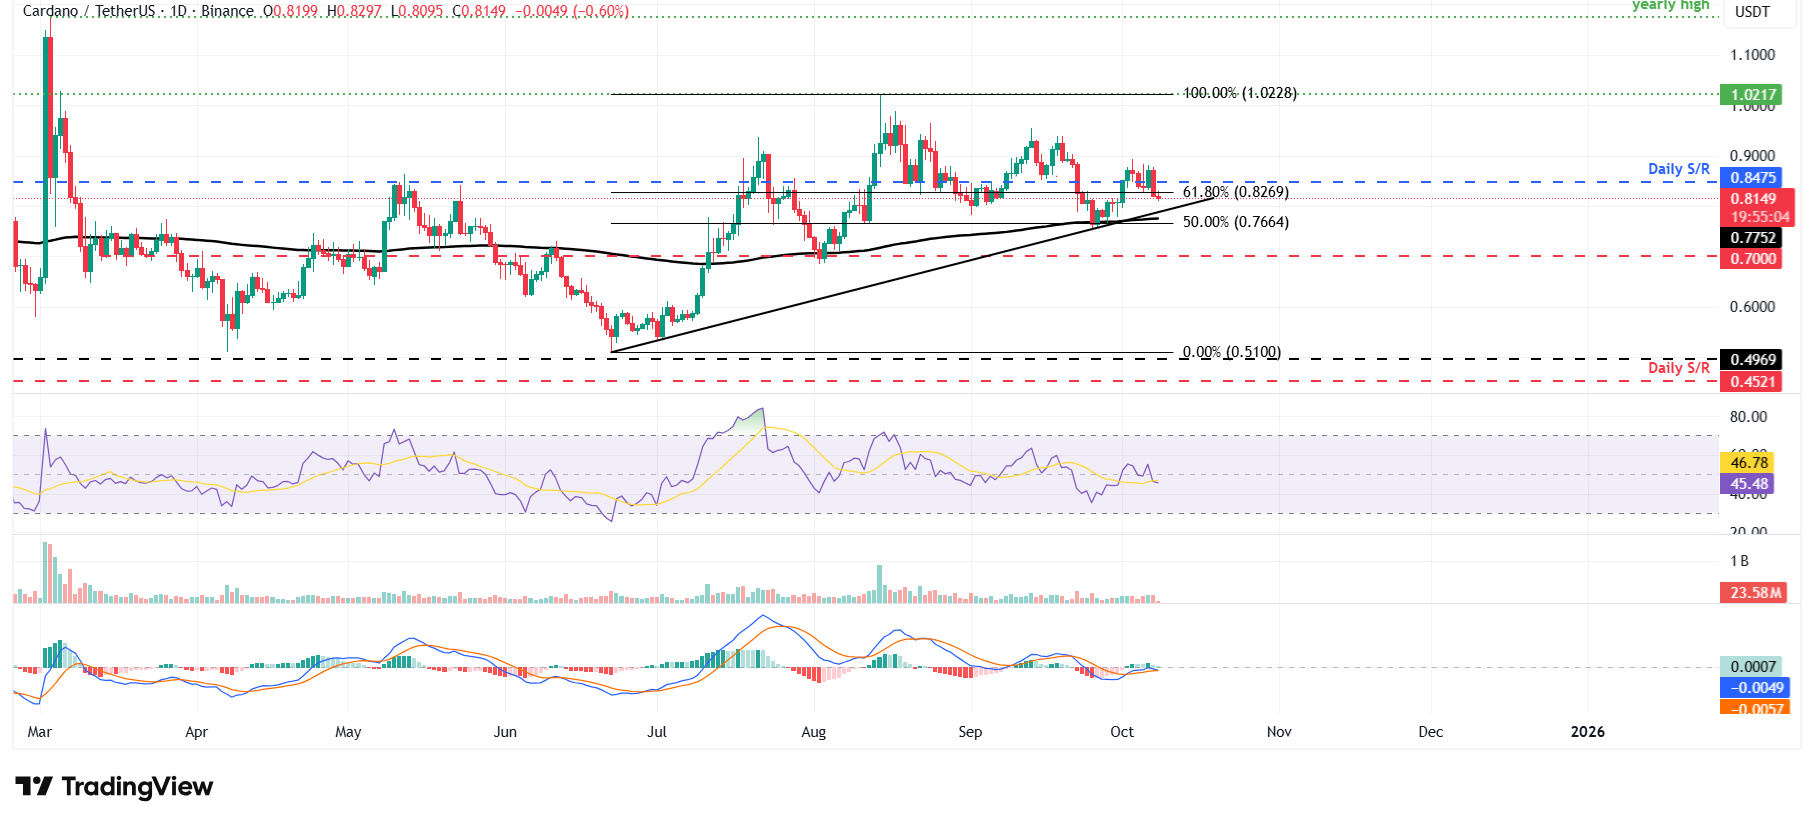
ADA/USDT daily chart
However, if ADA recovers, closes above the daily level at $0.84 and holds, it could extend the rally toward the psychological level at $1.

FXStreet
100만 명이 넘는 사용자가 FXStreet를 통해 실시간 시장 데이터, 차트 도구, 전문가 인사이트, 포렉스 뉴스를 이용합니다. 포괄적인 경제 캘린더와 교육 웨비나는 트레이더가 정보를 유지하고 신중한 결정을 내리도록 돕습니다. FXStreet는 바르셀로나 본사와 전 세계 지역에 걸쳐 약 60명의 팀으로 구성되어 있습니다.
Read More


