
Trade The World
Cardano Price Forecast: ADA eyes recovery as bullish momentum builds
작성자 Manish Chhetri
게시일: 25 Aug 2025 | 수정일: 25 Aug 2025


POPULAR ARTICLES

Cardano (ADA) price is showing signs of recovery after rebounding from a crucial support level last week. This price optimism is further supported by rising Open Interest and stablecoin market capitalization, pointing toward improving market sentiment.
- Cardano price hovers around $0.92 on Monday after rebounding from its key support at $0.84 last week.
- Derivatives and on-chain data show rising Open Interest and stablecoin market capitalization, hinting at improving sentiment.
- Technical indicators point to bearish exhaustion, suggesting room for an upside rally.
Cardano (ADA) price is showing signs of recovery after rebounding from a crucial support level last week. This price optimism is further supported by rising Open Interest and stablecoin market capitalization, pointing toward improving market sentiment. The technical indicators suggest that the recent bearish momentum may be fading, opening the door for a potential upside rally.
Cardano’s derivatives and on-chain data hint at recovery
CoinGlass data show that Cardano’s futures’ OI at exchanges rose from $1.54 billion on Friday to $1.77 billion on Monday, nearing its record high of $1.87 billion. Rising OI represents new or additional money entering the market and new buying, which could fuel the current ADA price rally.
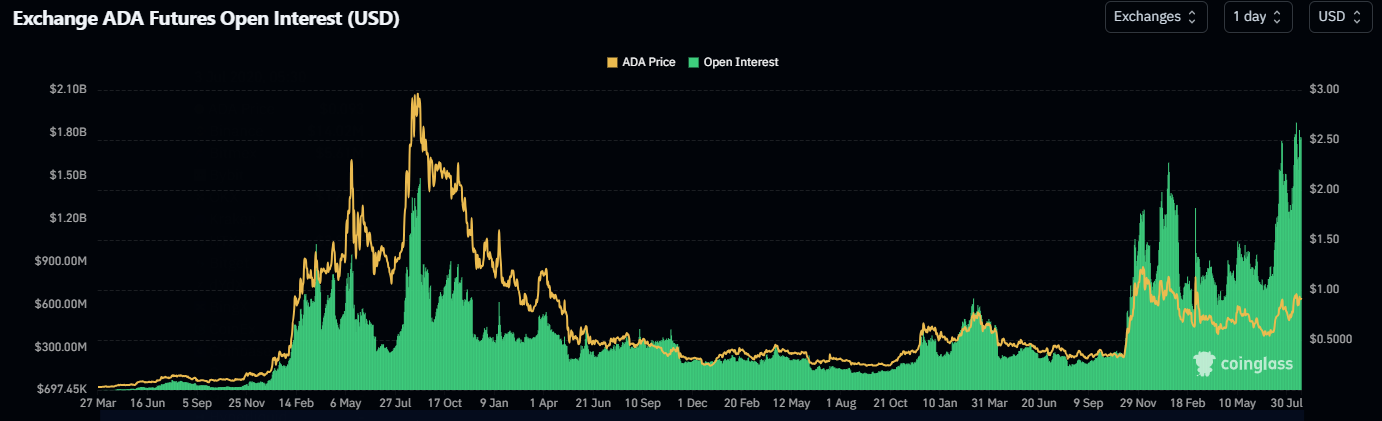
ADA Open Interest chart. Source: Coinglass
Data from crypto intelligence tracker DefiLlama shows that Cardano’s stablecoin market capitalization has been consistently rising since the end of July and currently stands at $38.58 on Monday. Such stablecoin activity and value increase on the ADA project indicate a bullish outlook, as they boost network usage and can attract more users to the ecosystem.
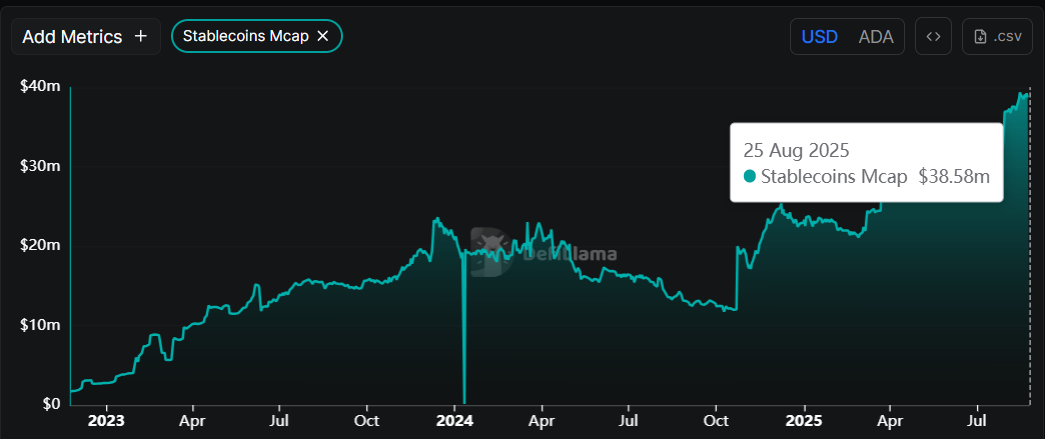
Cardano stablecoins Mcap chart. Source: DefiLlama
Cardano Price Forecast: ADA finds support around a key zone
Cardano price broke above the descending trendline (drawn by connecting multiple highs since early December) on August 13 and rallied, retesting its key psychological level of $1 the next day. However, ADA failed to sustain the upward momentum. It declined 5.4% last week, rebounding from its broken trendline support, which roughly coincides with the 61.8% Fibonacci retracement level at $0.82, making it a key support zone. At the start of this week, on Monday, it hovers at around $0.92.
If ADA continues its upward trend, it could extend the rally toward its August 14 high of $1.02. A successful close above this could extend the gains toward its yearly high at $1.17.
The Relative Strength Index (RSI) on the daily chart reads 58 above its neutral level of 50, indicating bullish momentum gaining traction. The Moving Average Convergence Divergence (MACD) lines converge against each other, indicating indecision among the traders.
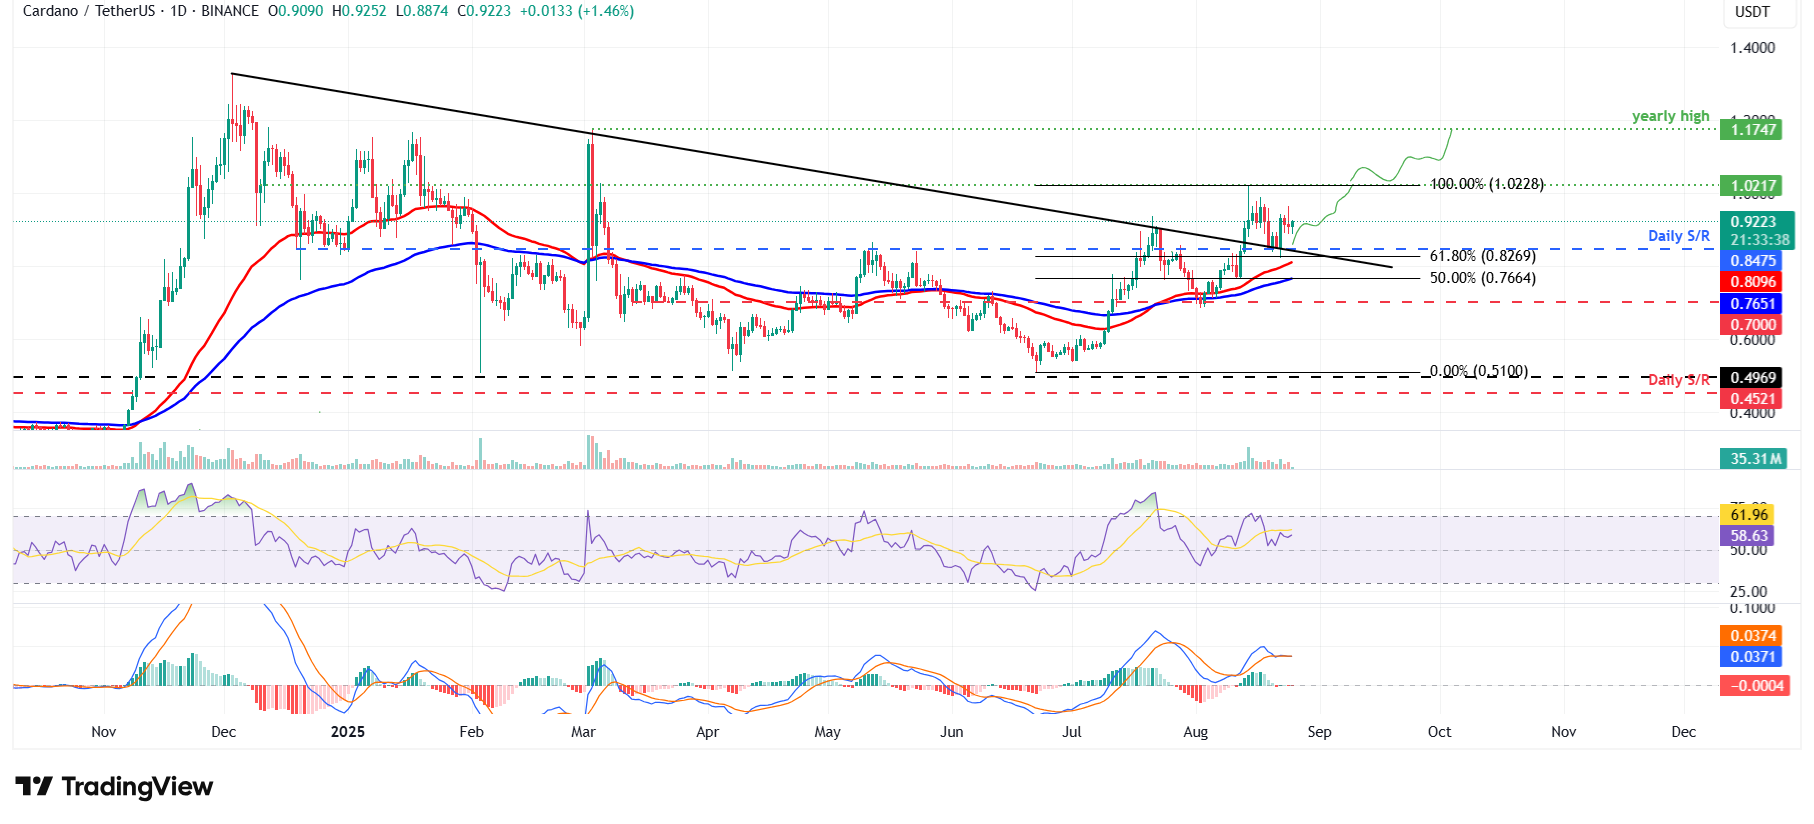
ADA/USDT daily chart
However, if ADA faces a correction, it could extend the decline toward its daily support at $0.84.

FXStreet
100만 명이 넘는 사용자가 FXStreet를 통해 실시간 시장 데이터, 차트 도구, 전문가 인사이트, 포렉스 뉴스를 이용합니다. 포괄적인 경제 캘린더와 교육 웨비나는 트레이더가 정보를 유지하고 신중한 결정을 내리도록 돕습니다. FXStreet는 바르셀로나 본사와 전 세계 지역에 걸쳐 약 60명의 팀으로 구성되어 있습니다.
Read More


