
Trade The World
Cardano Price Forecast: ADA recovery lacks retail, whale support
작성자 Vishal Dixit
게시일: 24 Oct 2025 | 수정일: 24 Oct 2025


POPULAR ARTICLES

Cardano (ADA) price ticks higher by nearly 2% at press time on Friday, extending the 3% gains from Thursday. Technically, Cardano is performing a rebound within a descending triangle on the 4-hour chart, aiming for a potential breakout.
- Cardano bounces off within a descending triangle pattern on the 4-hour chart.
- The ADA futures Open Interest moves flat below $700 million, after the October 10 crash.
- On-chain data shows mixed sentiment among large wallet investors.
Cardano (ADA) price ticks higher by nearly 2% at press time on Friday, extending the 3% gains from Thursday. Technically, Cardano is performing a rebound within a descending triangle on the 4-hour chart, aiming for a potential breakout.
However, the spirit of ADA bulls lacks retail support, while large wallet investors, popularly known as whales, remain divided on Cardano’s fate.
On-chain and retail Cardano investors give mixed signals
Large wallet investors, or whales, with over 1 billion ADA have increased their holdings to 4.33% of the total ADA supply, from 4.10% earlier this month. Typically, a buying move from large investors is a sign of a potential price surge.
However, the cohorts of whales with 100 million to 1 billion are losing confidence in Cardano, offloading their holdings by 56 percentage points so far this month, dominating 10.94% of the total ADA supply.
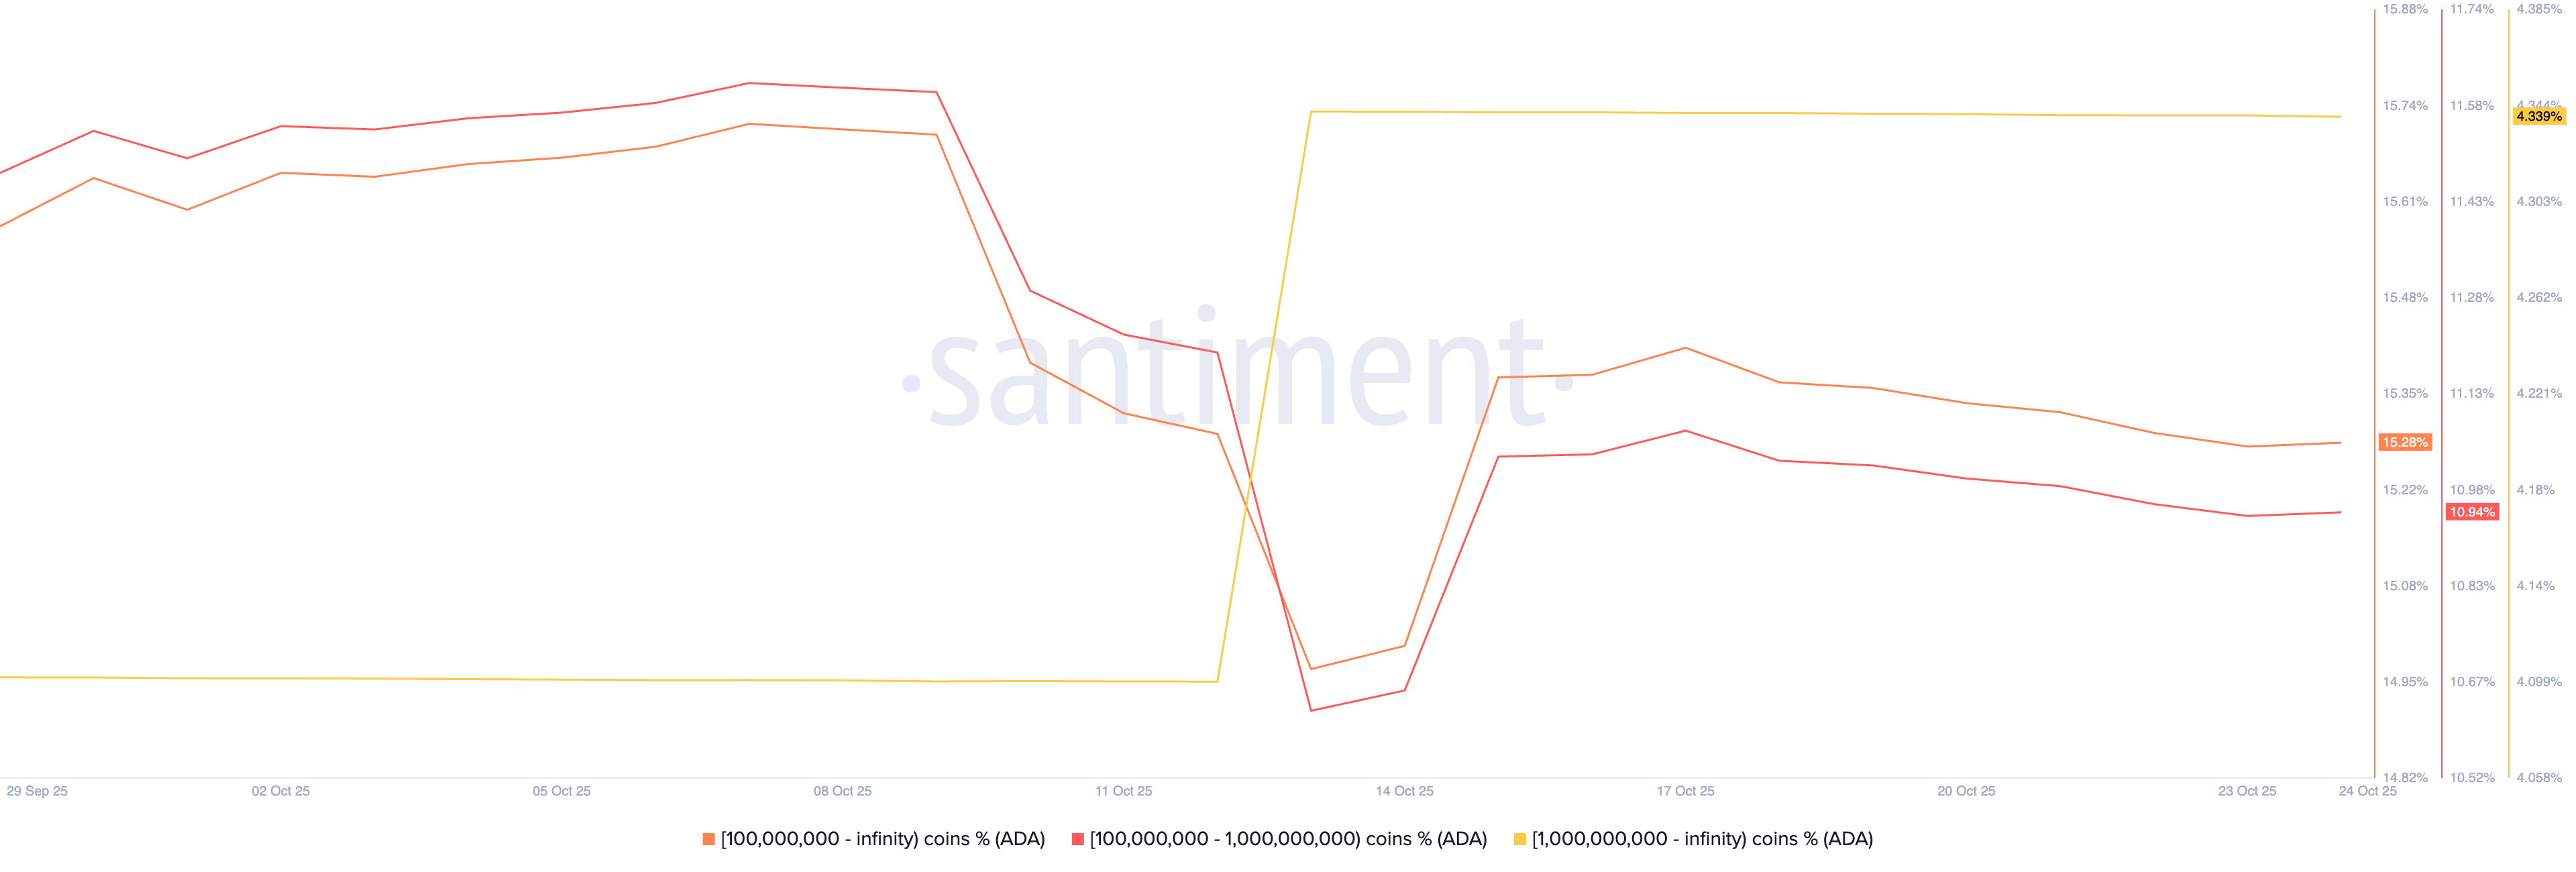
Cardano supply distribution. Source: Santiment.
Apart from on-chain holders, the derivatives market indicates a lack of commitment in leverage-driven Cardano traders. CoinGlass data shows that the ADA futures Open Interest (OI) stands at $660.90 million, up from $635.94 million on Thursday, moving relatively flat under $700 million after the October 10 crash from $1.51 billion. A stagnancy in OI, the notional value of outstanding derivatives contracts, signals a risk-averse sentiment among traders, who are opting for a wait-and-see approach.
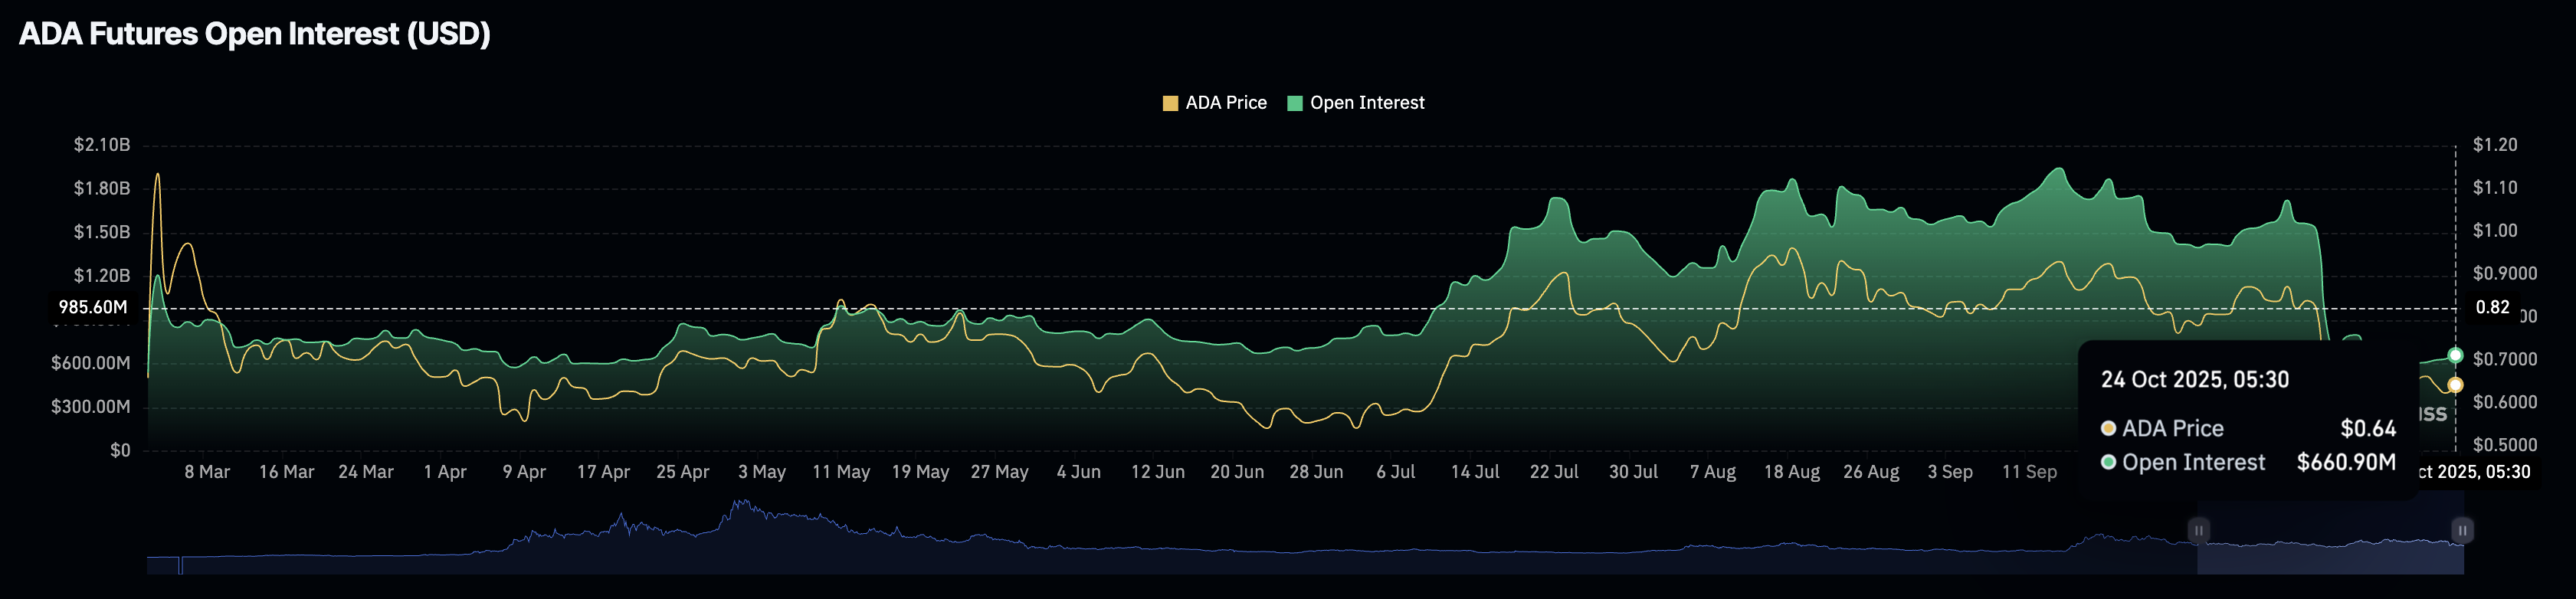
Cardano futures Open Interest. Source: CoinGlass
Cardano’s recovery eyes triangle pattern breakout
Cardano bounces off a local support trendline, which completes a descending triangle pattern on the 4-hour price chart. At the time of writing, ADA is facing resistance at the 50-period Exponential Moving Average (EMA) at $0.6554.
If Cardano exceeds this dynamic resistance, it could challenge the overhead trendline near the central Pivot Point at $0.6604. A decisive close above this level would confirm the pattern breakout, potentially extending the rally to the R1 Pivot Point at $0.7284.
The momentum indicators on the 4-hour chart suggest a bullish incline as the Moving Average Convergence Divergence (MACD) crosses above the signal line, extending the upward trend towards the zero line. The successive rise in green histogram bars after the crossover indicates a surge in bullish momentum.
At the same time, the Relative Strength Index (RSI) on the same chart reads 53, and rising above the halfway line indicates an increase in buying pressure.
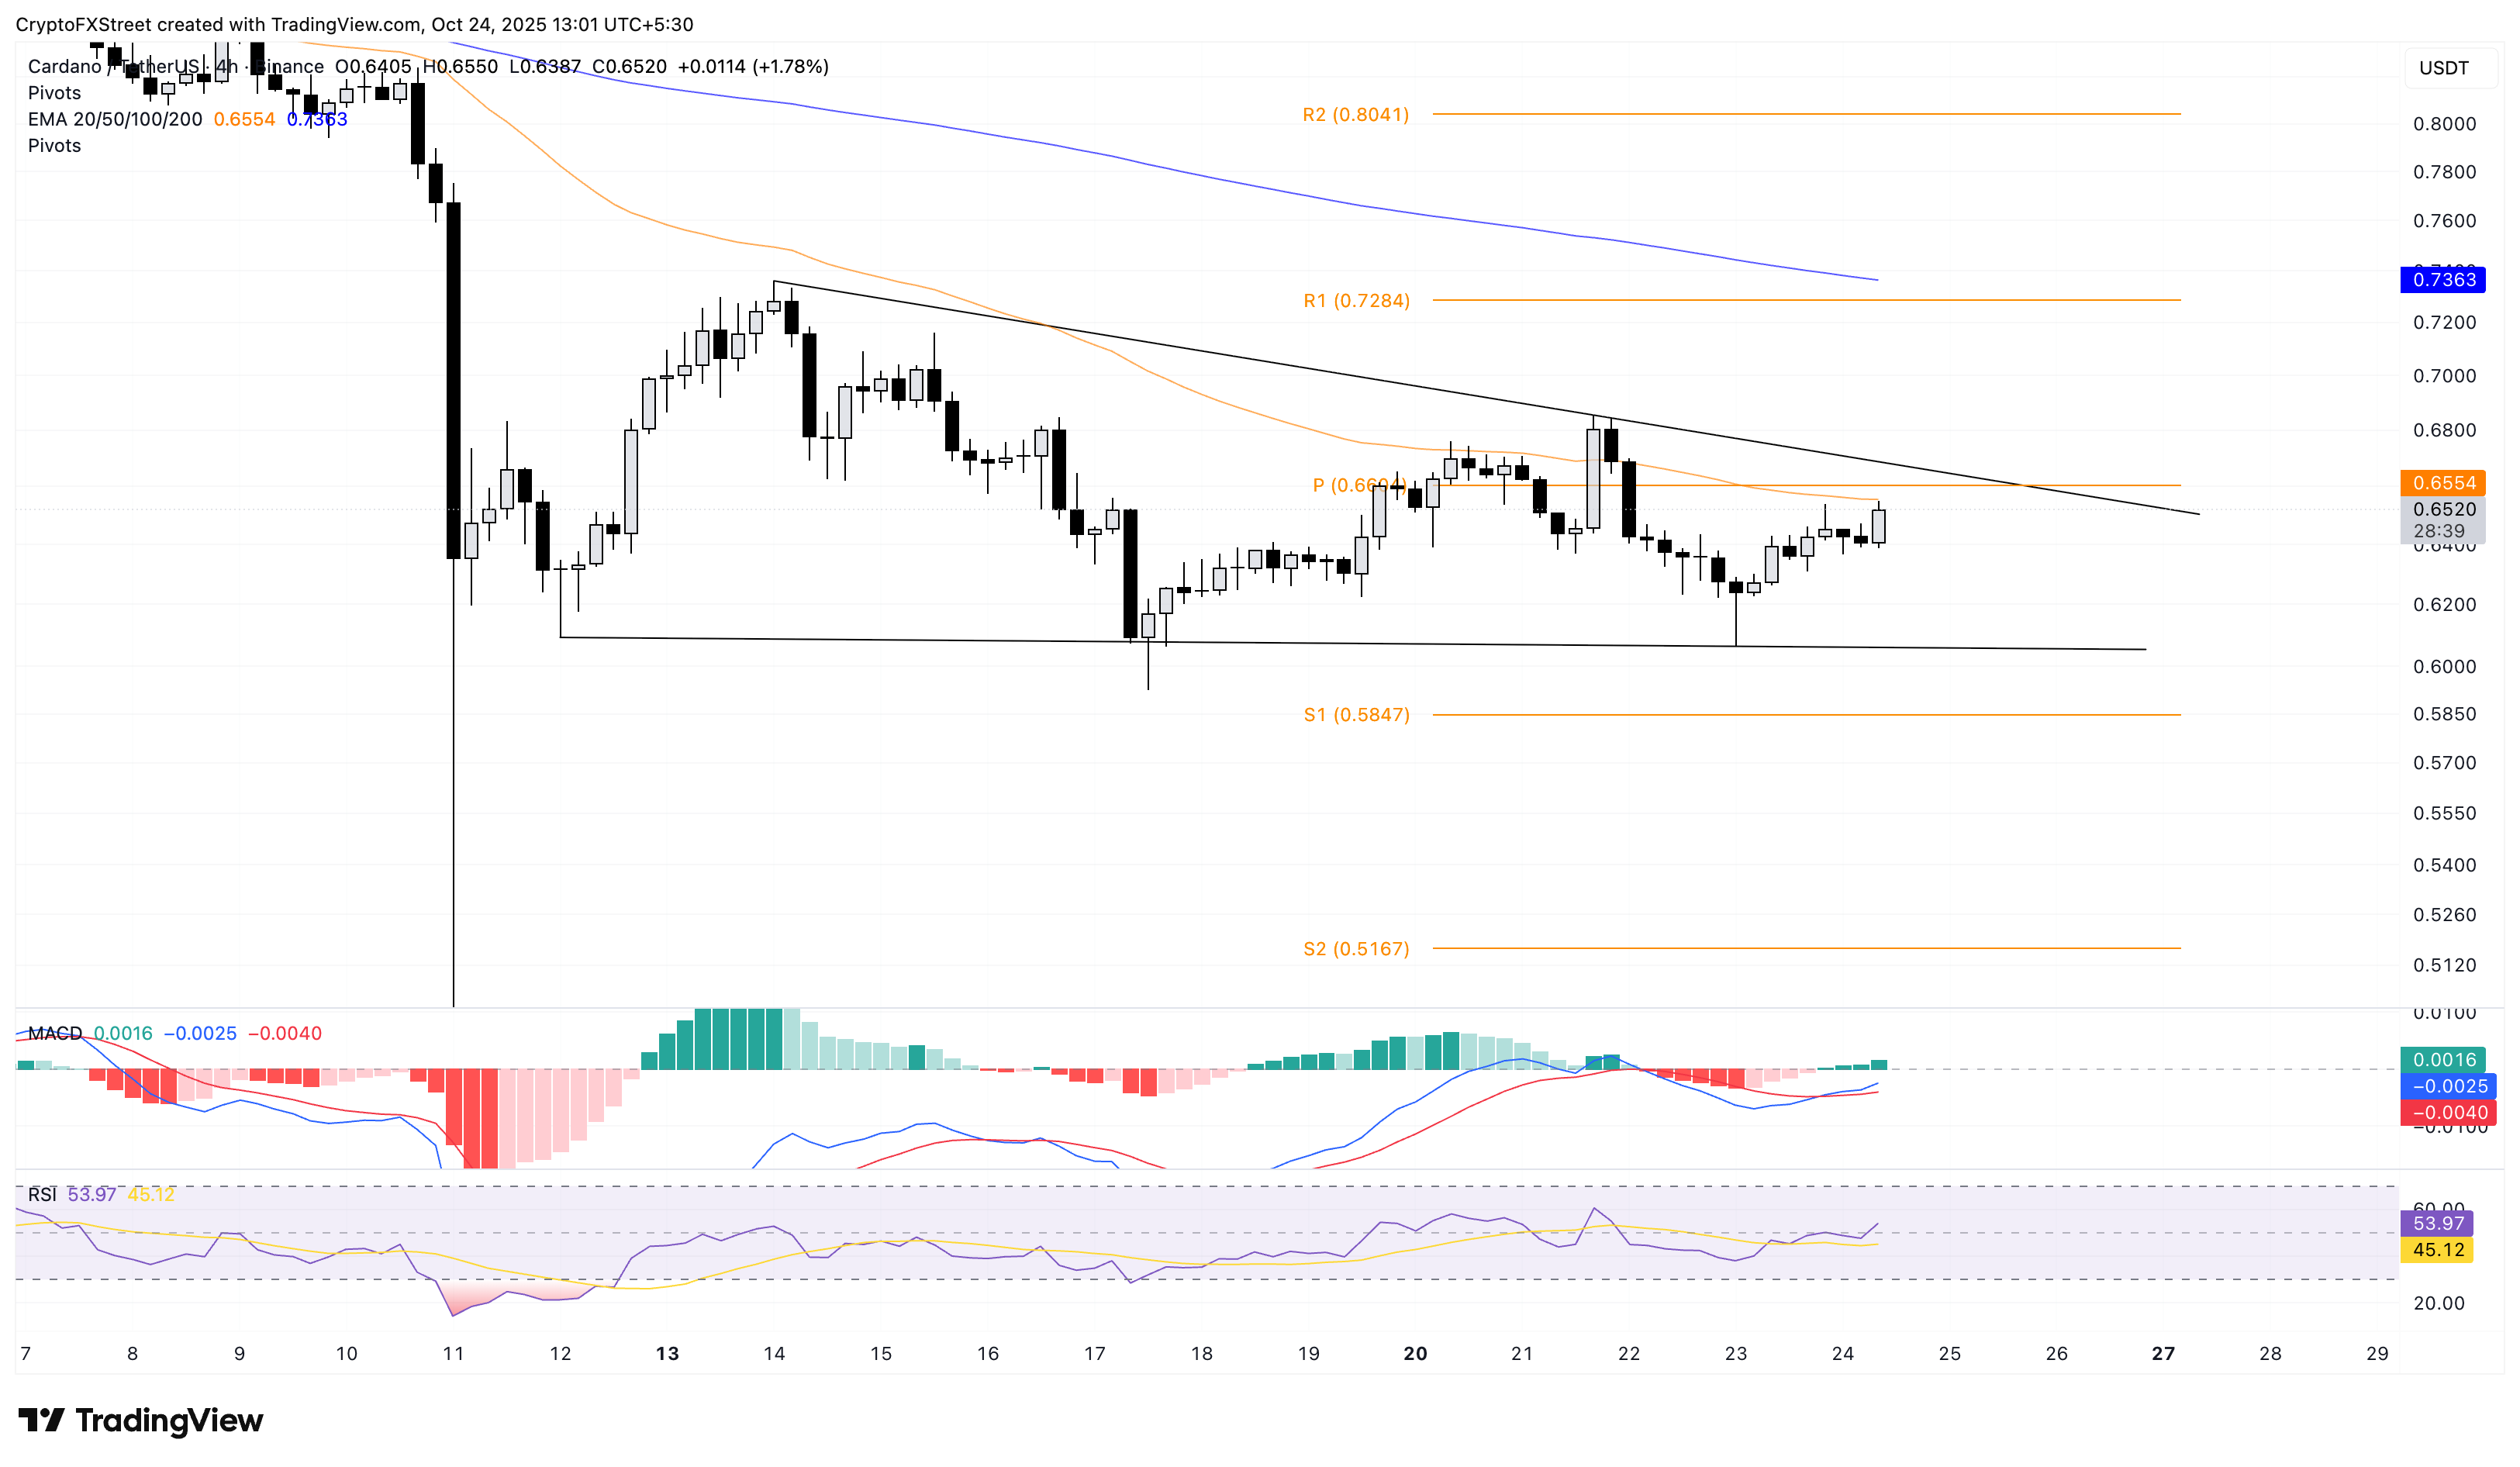
ADA/USDT 4-hour price chart.
However, the descending triangle pattern generally leads to a downside breakout. If ADA marks a close below Wednesday’s low at $0.6061, the S1 and S2 Pivot Points at $0.5847 and $0.5167 could act as support levels.

FXStreet
100만 명이 넘는 사용자가 FXStreet를 통해 실시간 시장 데이터, 차트 도구, 전문가 인사이트, 포렉스 뉴스를 이용합니다. 포괄적인 경제 캘린더와 교육 웨비나는 트레이더가 정보를 유지하고 신중한 결정을 내리도록 돕습니다. FXStreet는 바르셀로나 본사와 전 세계 지역에 걸쳐 약 60명의 팀으로 구성되어 있습니다.
Read More


