
Trade The World
Cardano Price Forecast: Bulls reclaim control with ADA eyeing higher levels
작성자 Manish Chhetri
게시일: 8 Sep 2025 | 수정일: 8 Sep 2025


POPULAR ARTICLES

Cardano (ADA) is extending its gains, trading above $0.84 at the time of writing on Monday after rebounding from a key support level last week.
- Cardano price extends its gains on Monday after rebounding from its key support level the previous week.
- Derivatives and on-chain data support a bullish view as funding rates are positive and stablecoin market capitalization continues to grow.
- Technical outlook on the 4-hour chart confirms a bullish pattern breakout, signaling potential for further upside.
Cardano (ADA) is extending its gains, trading above $0.84 at the time of writing on Monday after rebounding from a key support level last week. Positive funding rates and stablecoin market growth back the bullish sentiment, while technical analysis on the 4-hour chart confirms a bullish pattern breakout, suggesting ADA is headed toward further gains.
Cardano’s derivatives show improving bullish sentiment
Coinglass’s OI-Weighted Funding Rate data shows that the number of traders betting that the price of Cardano will slide further is lower than those anticipating a price increase.
The metric has flipped to a positive rate on September 2. It continued to show a positive value of 0.0079% on Monday, indicating that longs are paying shorts, which suggests a bullish sentiment among Cardano traders.
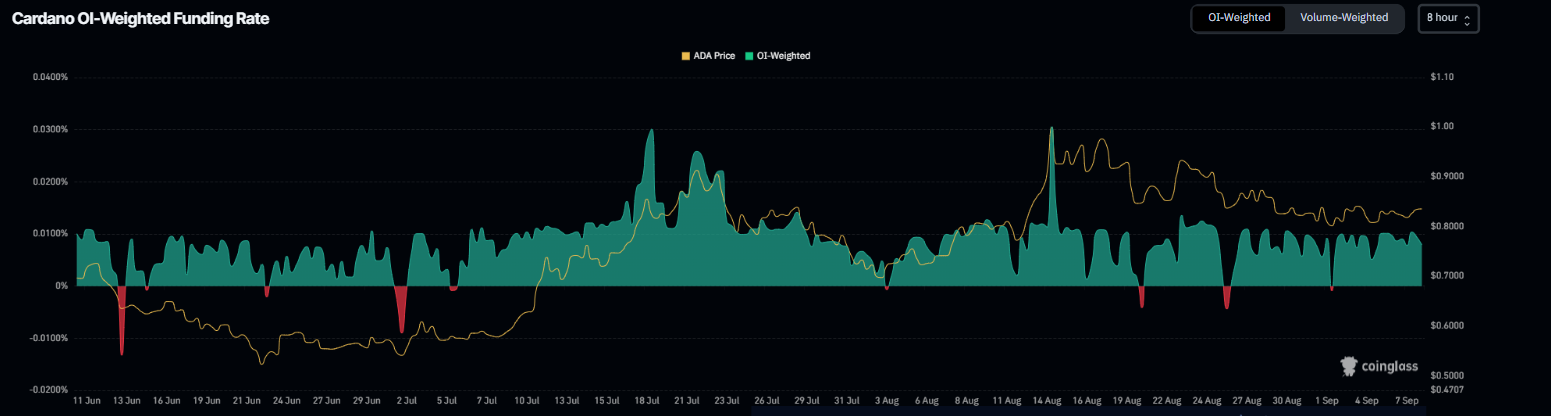
Cardano funding rate chart. Source: Coinglass
DefiLlama data shows that the ADA stablecoin market capitalization reached a record high of $40.37 million on Sunday. Rising stablecoin activity and value increase on ADA is positive, as they increase network usage and can attract more users to the ecosystem.
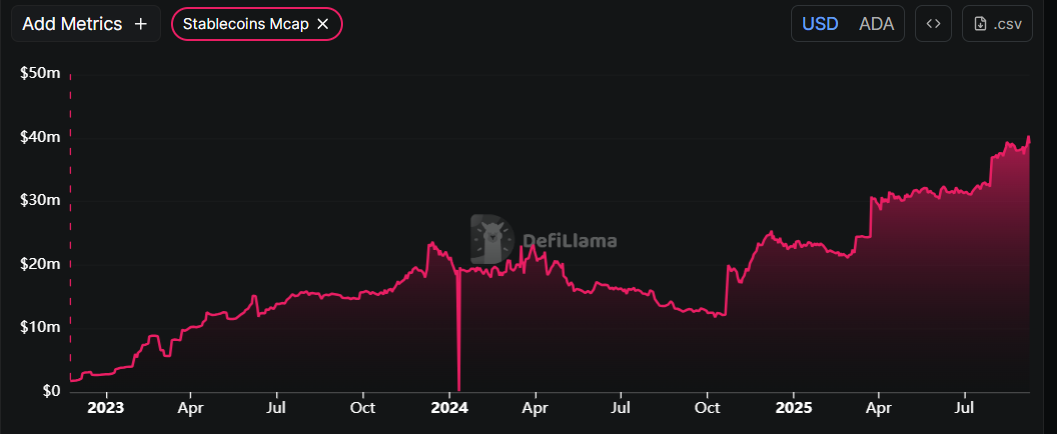
Cardano stablecoin market capitalization chart. Source: DefiLlama
Cardano Price Forecast: Confirms a bullish pattern breakout
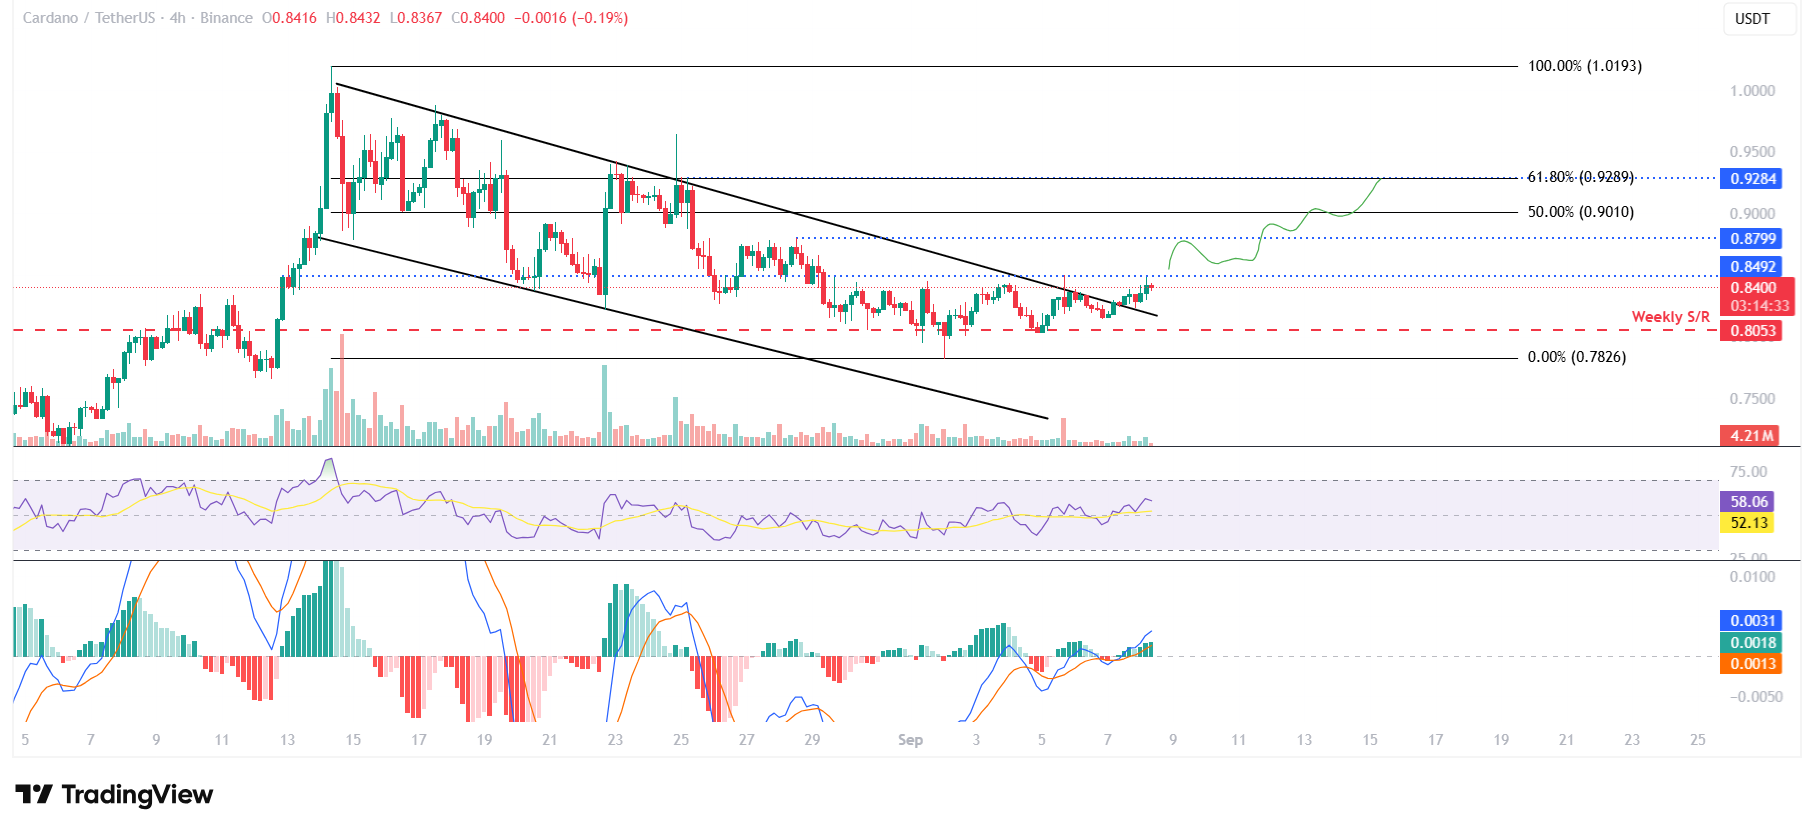
Cardano price on the 4-hour chart shows that it broke above the falling wedge pattern on Sunday and rose slightly. This pattern is formed by connecting multiple high and low levels with a trendline from August 14, and a breakout favours the bulls. At the time of writing on Monday, it trades at around $0.84.
If ADA continues its upward momentum, it could extend the rally toward its 61.8% Fibonacci retracement at $0.92.
The Relative Strength Index (RSI) on the 4-hour chart reads 58, which is above its neutral level of 50, indicating bullish momentum. The MACD indicator also displayed a bullish crossover on the 4-hour chart, further reinforcing the bullish outlook.
ADA/USDT daily chart
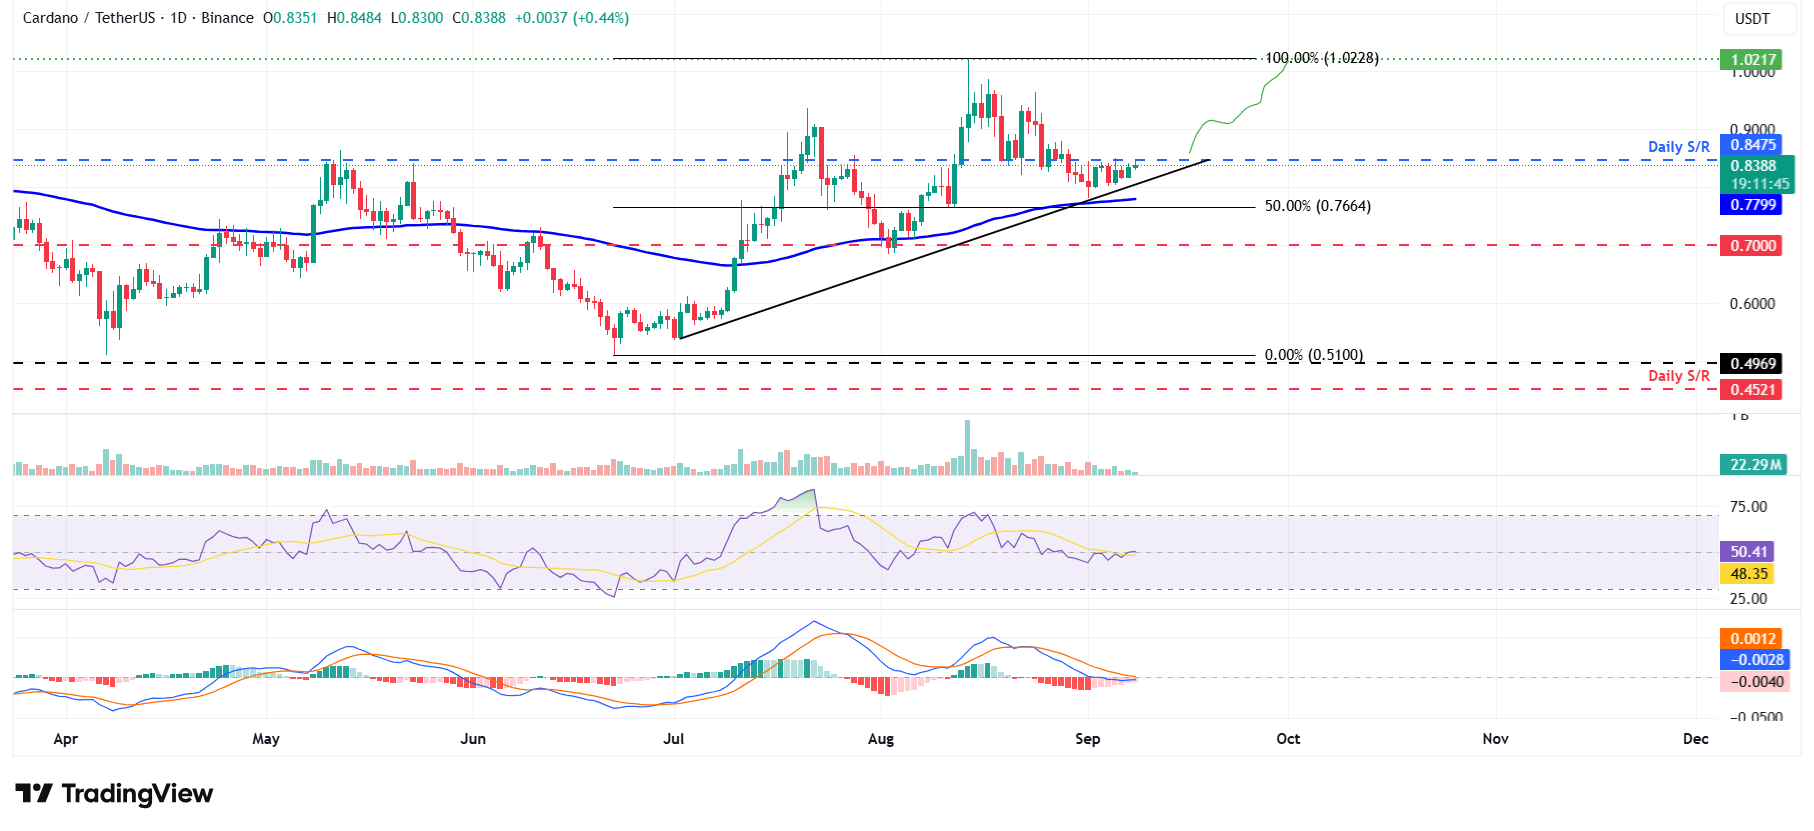
On the daily chart, Cardano's price retested and found support around its 100-day Exponential Moving Average (EMA) at $0.77 on September 1, and recovered 4.19% by Sunday. At the time of writing on Monday, it hovers at around $0.83.
If the ADA closes above the daily resistance at $0.84 on a daily basis, it could extend the rally toward its August 14 high of $1.02.
The RSI on the daily chart is hovering around its neutral level of 50, indicating indecision among traders. For the recovery rally to be sustained, the RSI must move above its neutral level. Moreover, the MACD is also showing a falling red histogram bar below its neutral level, suggesting fading bearish momentum.
ADA/USDT daily chart
However, if ADA faces a correction, it could extend the decline toward its 100-day EMA at $0.77.

FXStreet
100만 명이 넘는 사용자가 FXStreet를 통해 실시간 시장 데이터, 차트 도구, 전문가 인사이트, 포렉스 뉴스를 이용합니다. 포괄적인 경제 캘린더와 교육 웨비나는 트레이더가 정보를 유지하고 신중한 결정을 내리도록 돕습니다. FXStreet는 바르셀로나 본사와 전 세계 지역에 걸쳐 약 60명의 팀으로 구성되어 있습니다.
Read More


