
Trade The World
Chainlink Price Forecast: LINK eyes 18% breakout after Grayscale ETF filing
작성자 John Isige
게시일: 8 Sep 2025 | 수정일: 8 Sep 2025


POPULAR ARTICLES

Chainlink (LINK) is trending higher, exchanging hands above $23.00 on Monday, buoyed by news that Grayscale has filed with the United States (US) Securities & Exchange Commission (SEC) to launch a LINK exchange-traded fund (ETF).
- Chainlink rises after falling wedge pattern breakout, targeting an 18% move to $26.75.
- Grayscale has filed the S-1 for the Chainlink ETF with the US SEC.
- The MACD and RSI indicators back LINK’s strong technical structure.
Chainlink (LINK) is trending higher, exchanging hands above $23.00 on Monday, buoyed by news that Grayscale has filed with the United States (US) Securities & Exchange Commission (SEC) to launch a LINK exchange-traded fund (ETF).
Grayscale files to launch Chainlink ETF
Grayscale has submitted an S-1 filing to the SEC, seeking permission to provide access to a Chainlink spot ETF. The application aligns with Grayscale’s broader initiative to expand access to digital assets beyond its current offerings, which include Bitcoin (BTC) and Ethereum (ETH).
A Chainlink spot ETF would track in real-time the price of LINK, ensuring that institutional investors have direct access via stock exchanges. If approved, the ETF would be among the first funds offering regulated exposure to the token powering Chainlink’s decentralized oracle network.
Grayscale intends to list the ETF on NYSE Arca under the symbol GLNK, according to the filing. Grayscale Investments Sponsors, LLC and Grayscale Operating, LLC are the co-sponsors of the trust, according to Reuters.
Meanwhile, retail interest in Chainlink continues to improve, with the futures Open Interest (OI) averaging $1.58 billion at the time of writing on Monday, up from $1.47 billion recorded on Friday.
If OI, which refers to the notional value of outstanding futures contracts, steadies in the coming days, demand for LINK could rise, reinforcing the short-term bullish outlook. A higher OI implies that traders have a strong conviction in LINK’s ability to sustain the uptrend.
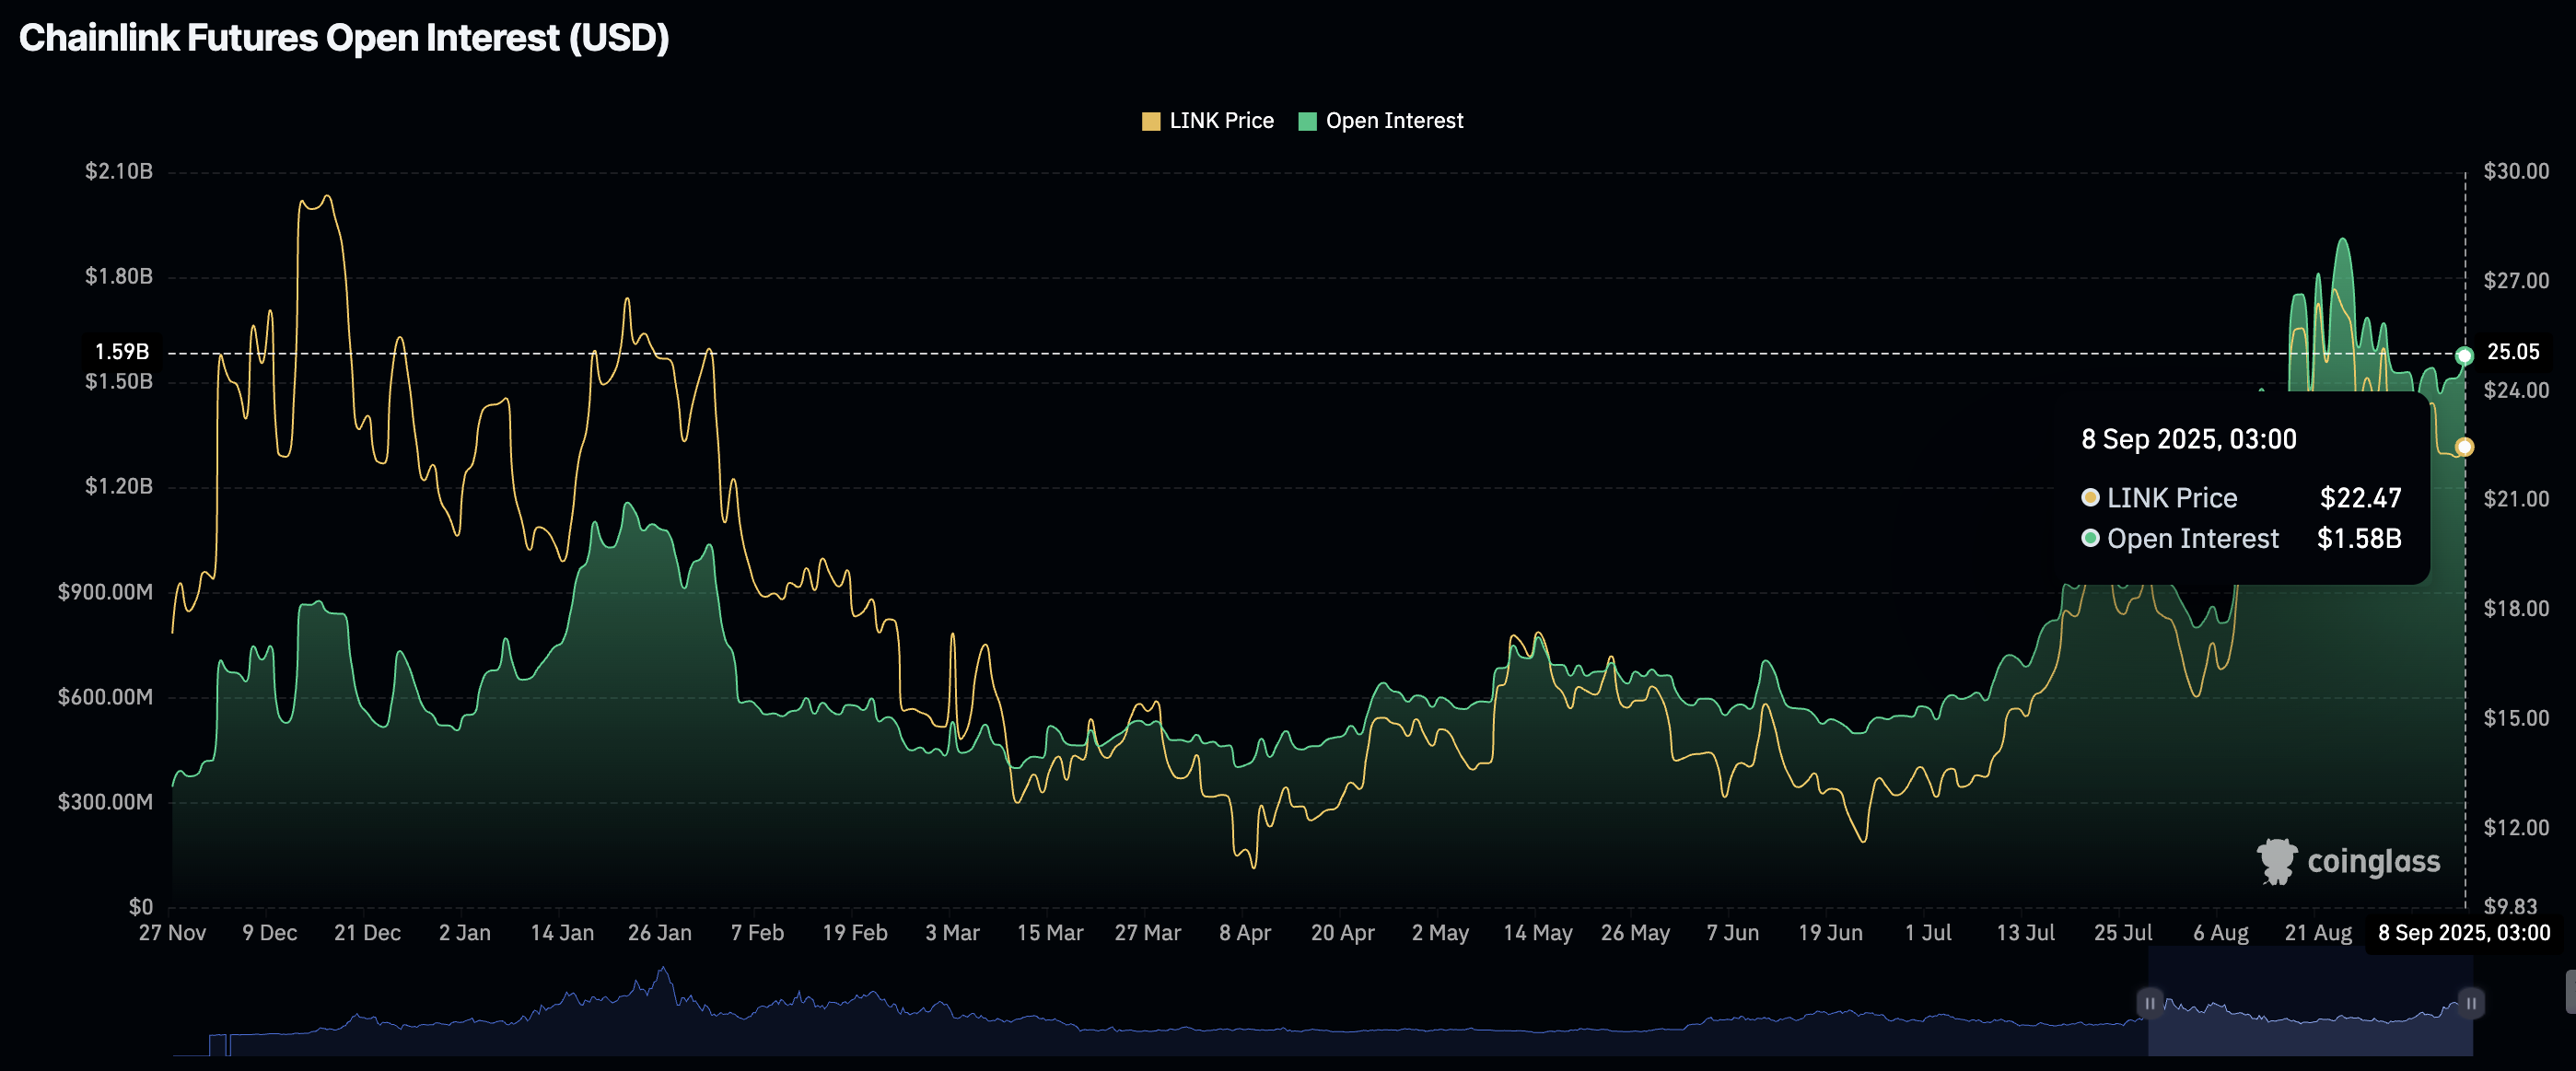
Chainlink Open Interest | Source CoinGlass
Technical outlook: Chainlink bulls tighten grip
Chainlink holds slightly above $23.00 following a recent breakout from a falling wedge pattern on the 4-hour chart below. The oracle token is positioned above the 50-period Exponential Moving Average (EMA) support at $22.87, reinforcing its short-term bullish structure.
A buy signal triggered by the Moving Average Convergence Divergence (MACD) indicator on Sunday reinforces the bullish outlook. As long as the MACD line in blue remains above the red signal line, interest in LINK will steadily increase, indicating bullish momentum.
The breakout from the falling wedge pattern projects an 18% rise to $26.75. This target is determined by measuring the distance between the pattern’s widest points, extrapolating above the breakout point.
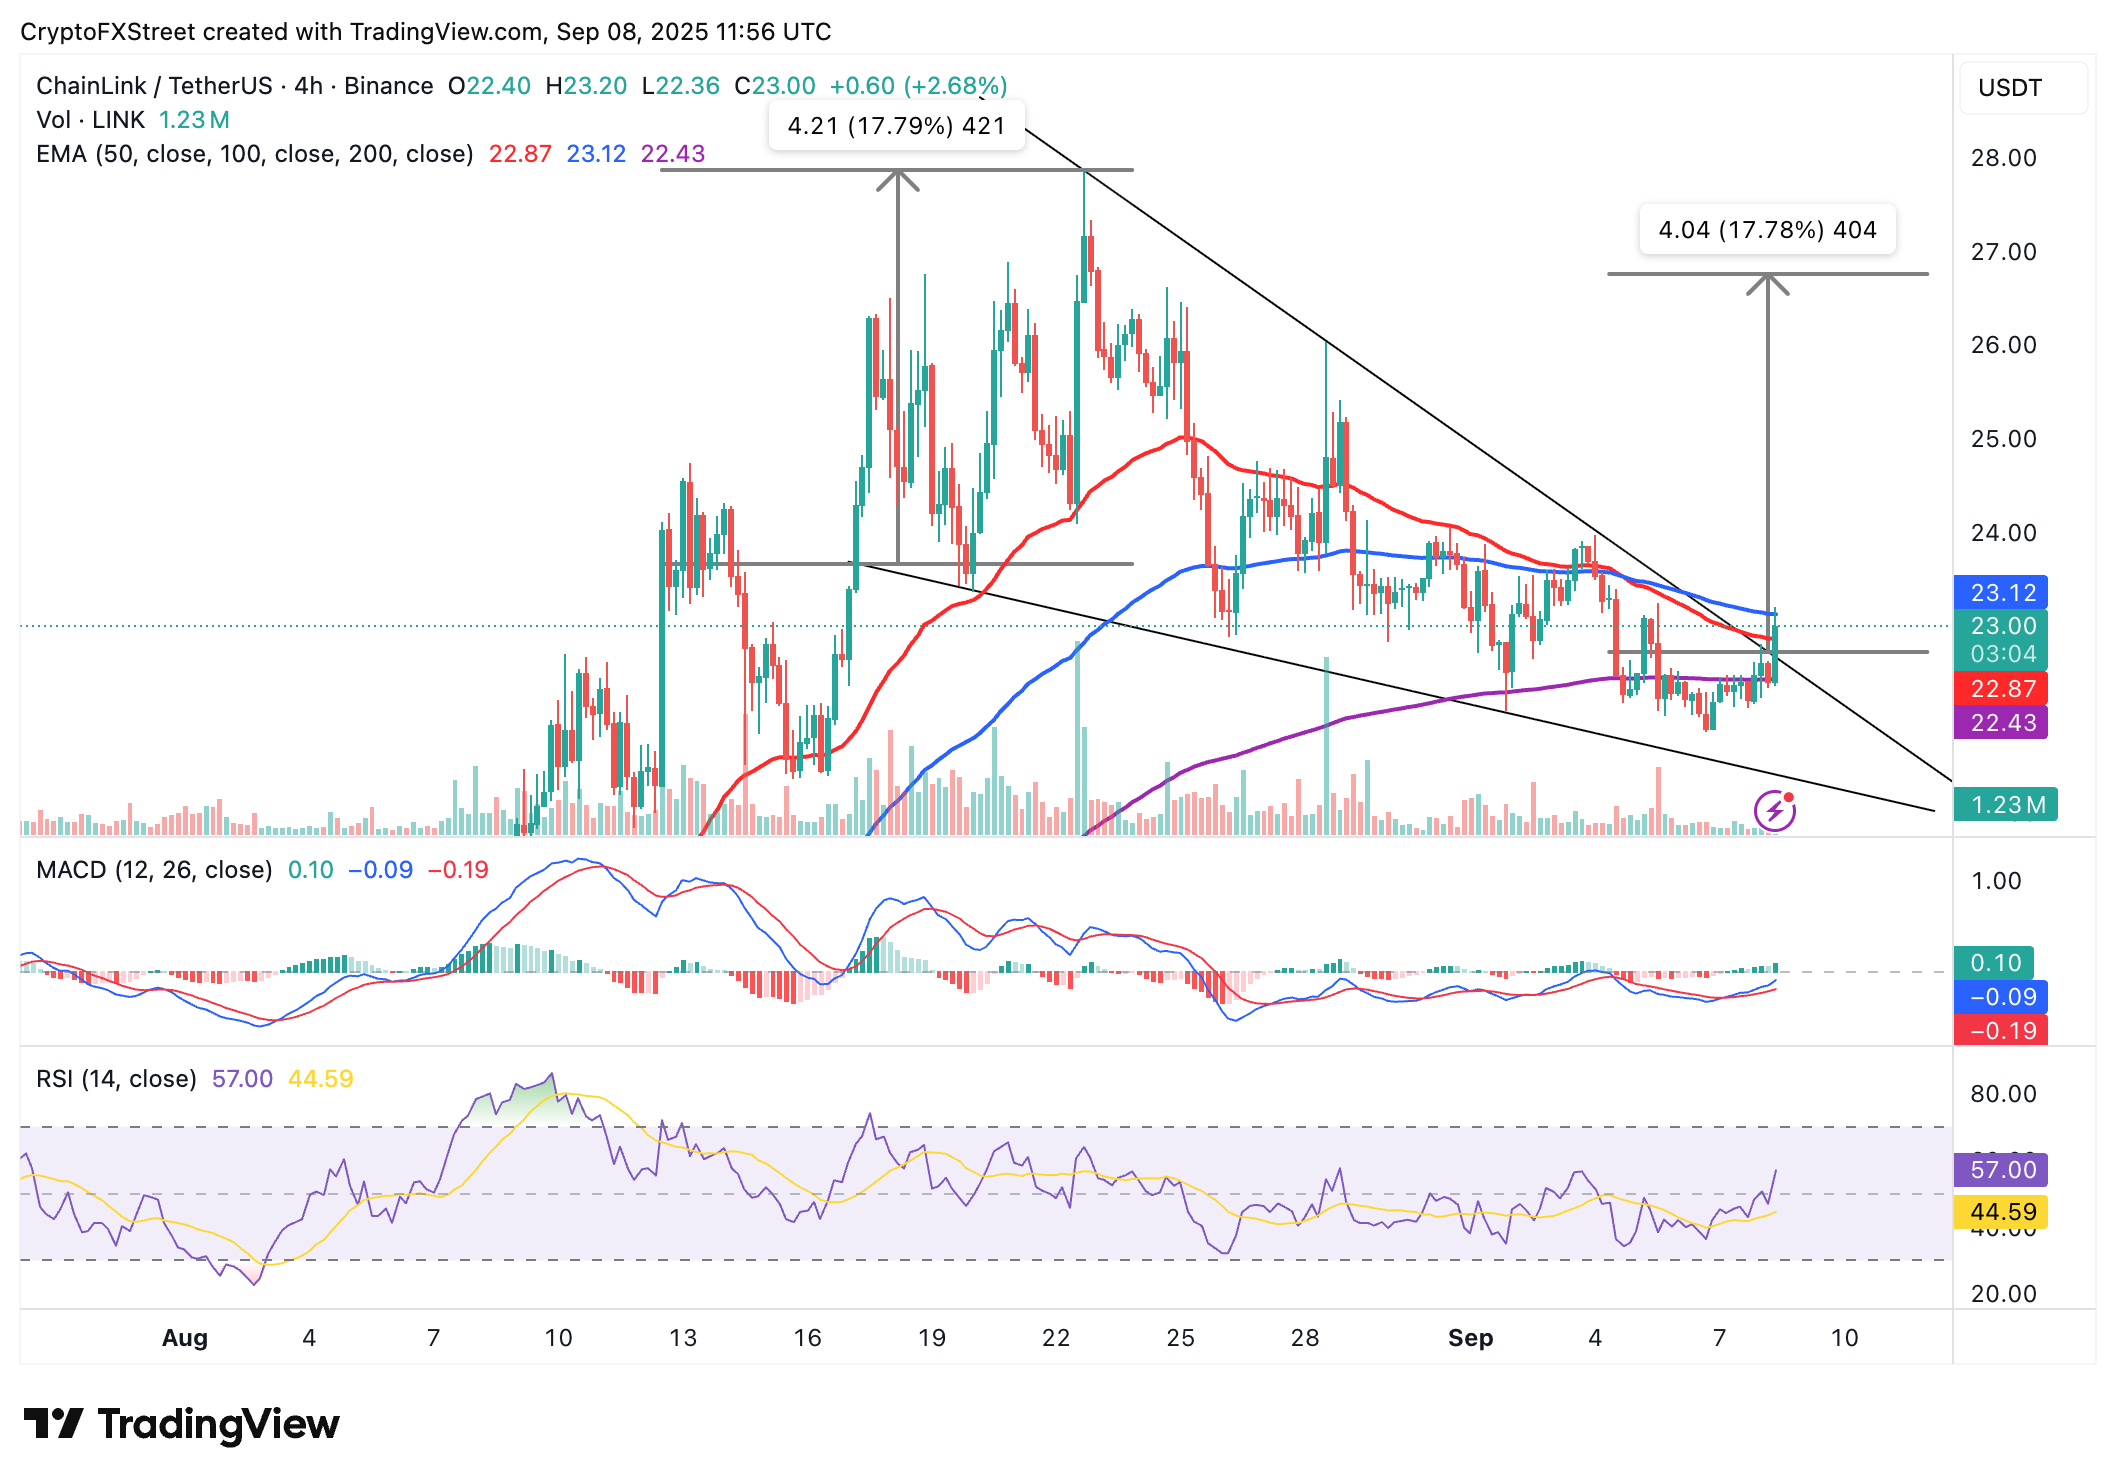
LINK/USDT 4-hour chart
Key bullish indicators include a 4-hour close above the 100-day EMA resistance at $23.12 and the Relative Strength Index (RSI) at 57, which is rising due to increasing momentum. A higher RSI reading indicates bullish momentum as traders increase exposure. If profit-taking takes center stage, the 50-period EMA at $22.87 and the 200-period EMA at $22.43 are in line to absorb the potential selling pressure.
Open Interest, funding rate FAQs
Higher Open Interest is associated with higher liquidity and new capital inflow to the market. This is considered the equivalent of increase in efficiency and the ongoing trend continues. When Open Interest decreases, it is considered a sign of liquidation in the market, investors are leaving and the overall demand for an asset is on a decline, fueling a bearish sentiment among investors.
Funding fees bridge the difference between spot prices and prices of futures contracts of an asset by increasing liquidation risks faced by traders. A consistently high and positive funding rate implies there is a bullish sentiment among market participants and there is an expectation of a price hike. A consistently negative funding rate for an asset implies a bearish sentiment, indicating that traders expect the cryptocurrency’s price to fall and a bearish trend reversal is likely to occur.

FXStreet
100만 명이 넘는 사용자가 FXStreet를 통해 실시간 시장 데이터, 차트 도구, 전문가 인사이트, 포렉스 뉴스를 이용합니다. 포괄적인 경제 캘린더와 교육 웨비나는 트레이더가 정보를 유지하고 신중한 결정을 내리도록 돕습니다. FXStreet는 바르셀로나 본사와 전 세계 지역에 걸쳐 약 60명의 팀으로 구성되어 있습니다.
Read More


