
Trade The World
Chainlink Price Forecast: LINK risks 15% decline amid continued deleveraging
작성자 John Isige
게시일: 16 Oct 2025 | 수정일: 16 Oct 2025


POPULAR ARTICLES

Chainlink (LINK) extends its decline, trading at above $18.00 on Wednesday amid volatility in the broader cryptocurrency market. Since Monday, the oracle token has lost 10% of its value, reinforcing the prevailing bearish outlook.
- Chainlink trims gains, falling alongside crypto majors as volatility spikes on Wednesday.
- LINK’s technical structure remains fragile, underlined by a persistent drop in Open Interest.
- A 15% decrease in the LINK price lingers as bears tighten their grip below the 200-day EMA.
Chainlink (LINK) extends its decline, trading at above $18.00 on Wednesday amid volatility in the broader cryptocurrency market. Since Monday, the oracle token has lost 10% of its value, reinforcing the prevailing bearish outlook.
If bulls remain on the sidelines, shrugging off the buy-the-dip opportunities, Chainlink risks extending the down leg by 15% toward $15.00. A shaky retail market, coupled with extreme volatility, will likely keep the LINK price suppressed longer than expected.
Chainlink decline persists on weak derivatives
Chainlink faced the largest deleveraging event in history on Friday, with a total of $167 million wiped out in long positions and approximately $16 million in short positions.
Although liquidations have reduced significantly over the past few days as the price stabilizes, the prevailing volatility could result in more losses as Chainlink edges lower.
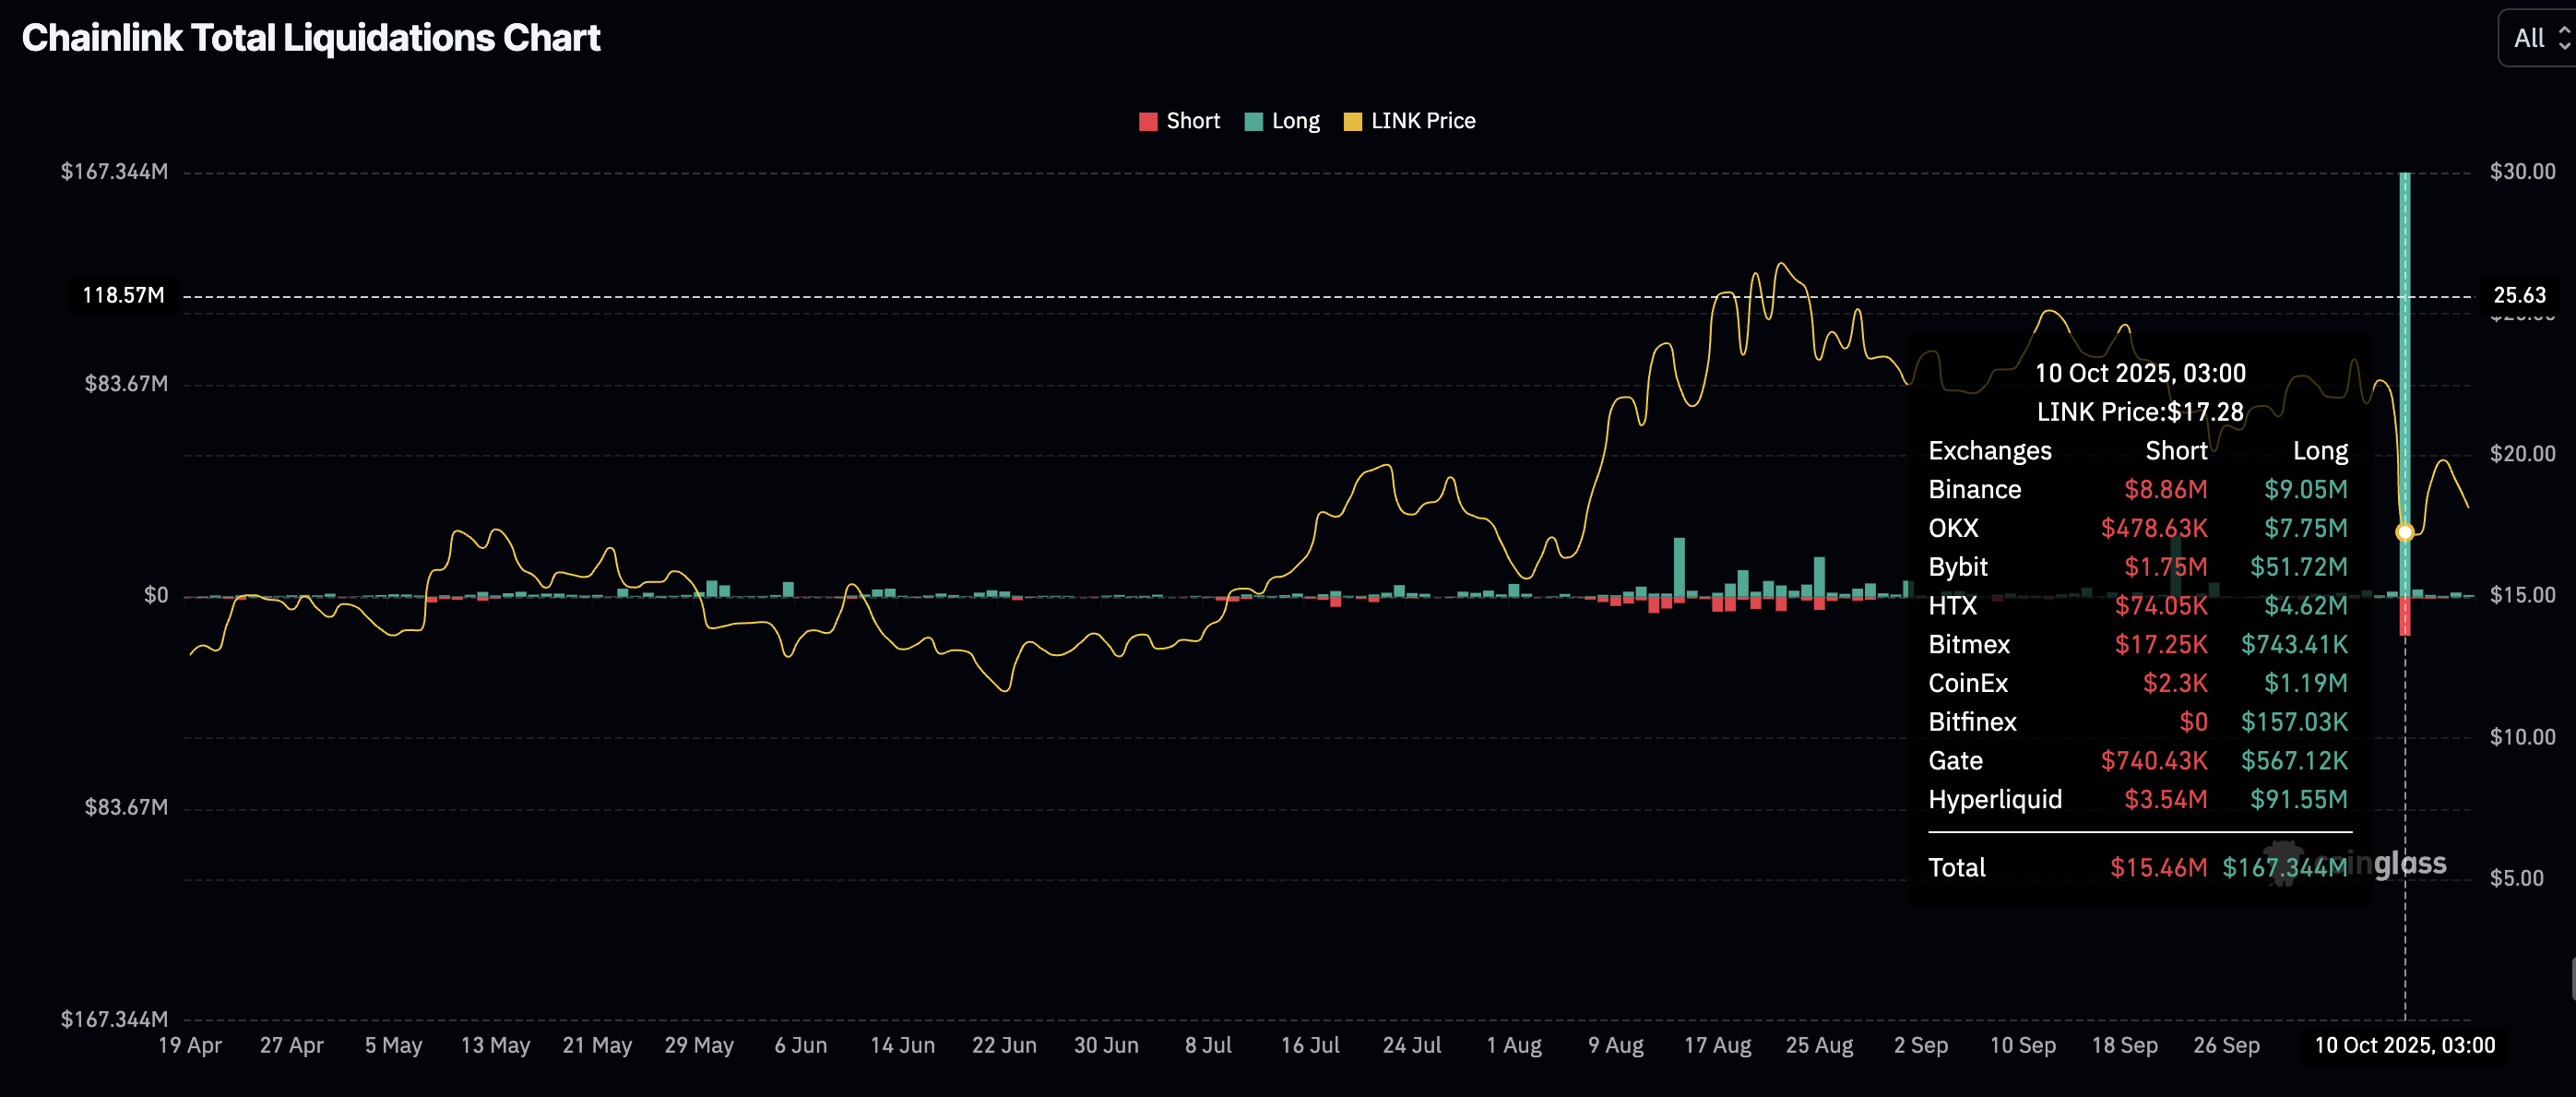
Chainlink liquidations data | Source: CoinGlass
Traders in the derivatives market remain on the sidelines in the wake of the recent sell-off, as evidenced by the futures Open Interest (OI) increasing marginally to approximately $737 million, followed by another smaller correction to $704 million. The OI had declined to $704 million on Friday. If risk-off sentiment persists and OI dips further, it would reinforce a strong bearish grip and increase the odds of the LINK price sliding toward $15.00.
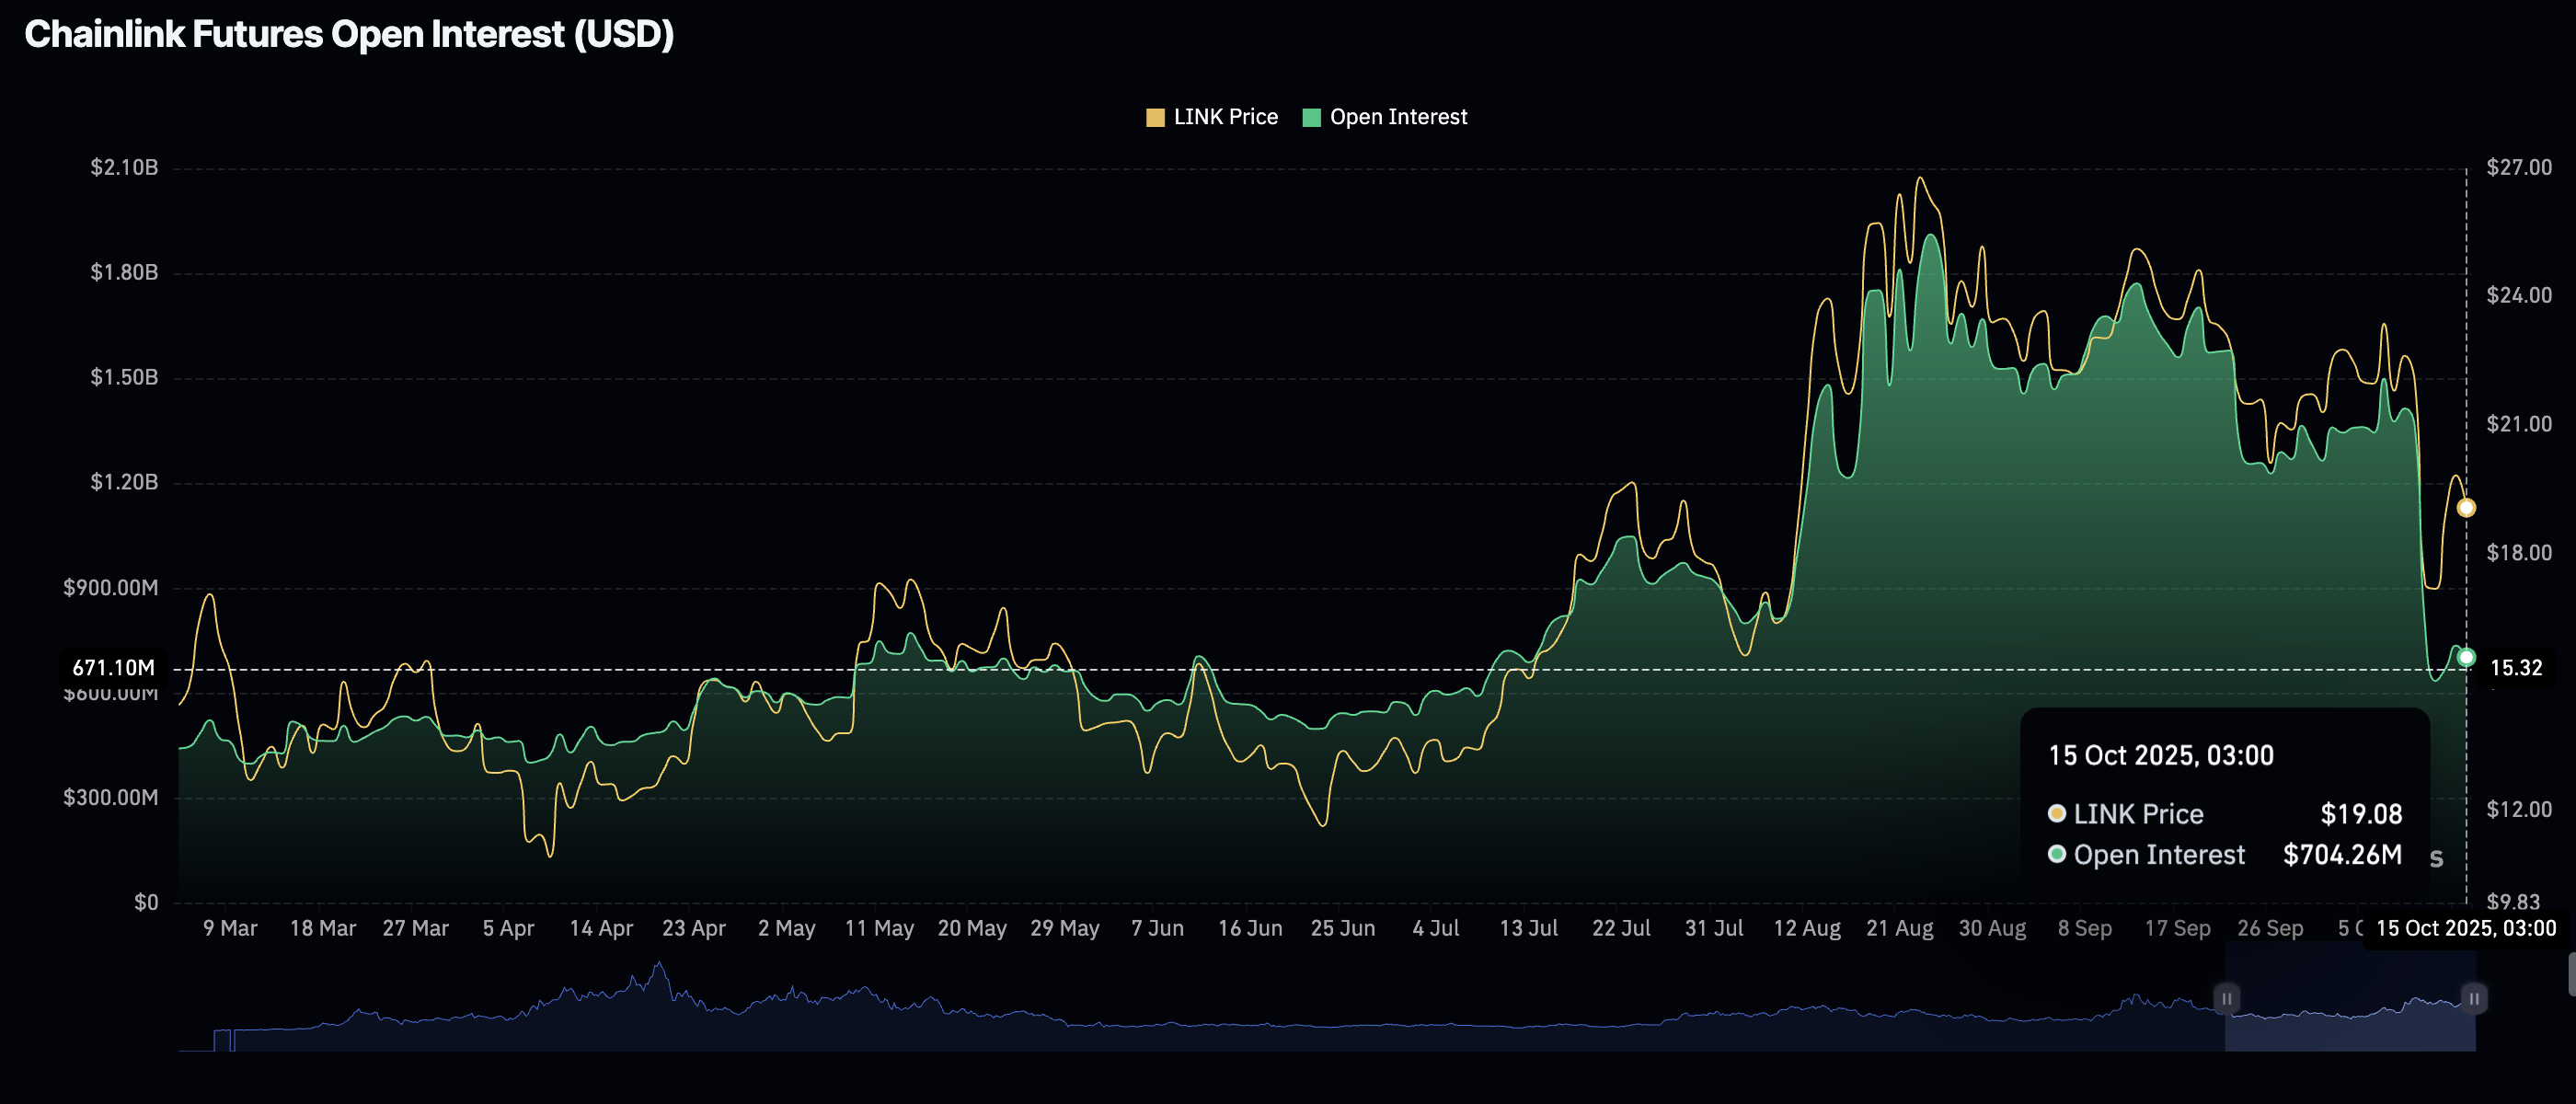
Chainlink Futures Open Interest | Source: CoinGlass
Technical outlook: LINK wobbles amid bearish signals
Chainlink is trading above $18.00 at the time of writing on Wednesday, underpinned by widespread declines in the cryptocurrency market. The token’s position below the 200-day Exponential Moving Average (EMA) at $19.08, the 100-day EMA at $20.59 and the 50-day EMA at $21.40, suggests that bearish sentiment is sticky and could persist in the coming days.
A sell signal maintained by the Moving Average Convergence Divergence (MACD) indicator on the daily chart since Friday, urges investors toward risk-averse sentiment.
The downward-trending Relative Strength Index (RSI) at 38 indicates that bearish momentum is increasing. If the current technical outlook prevails, LINK may extend the down leg toward the $15.00 support, which it previously tested in early August.
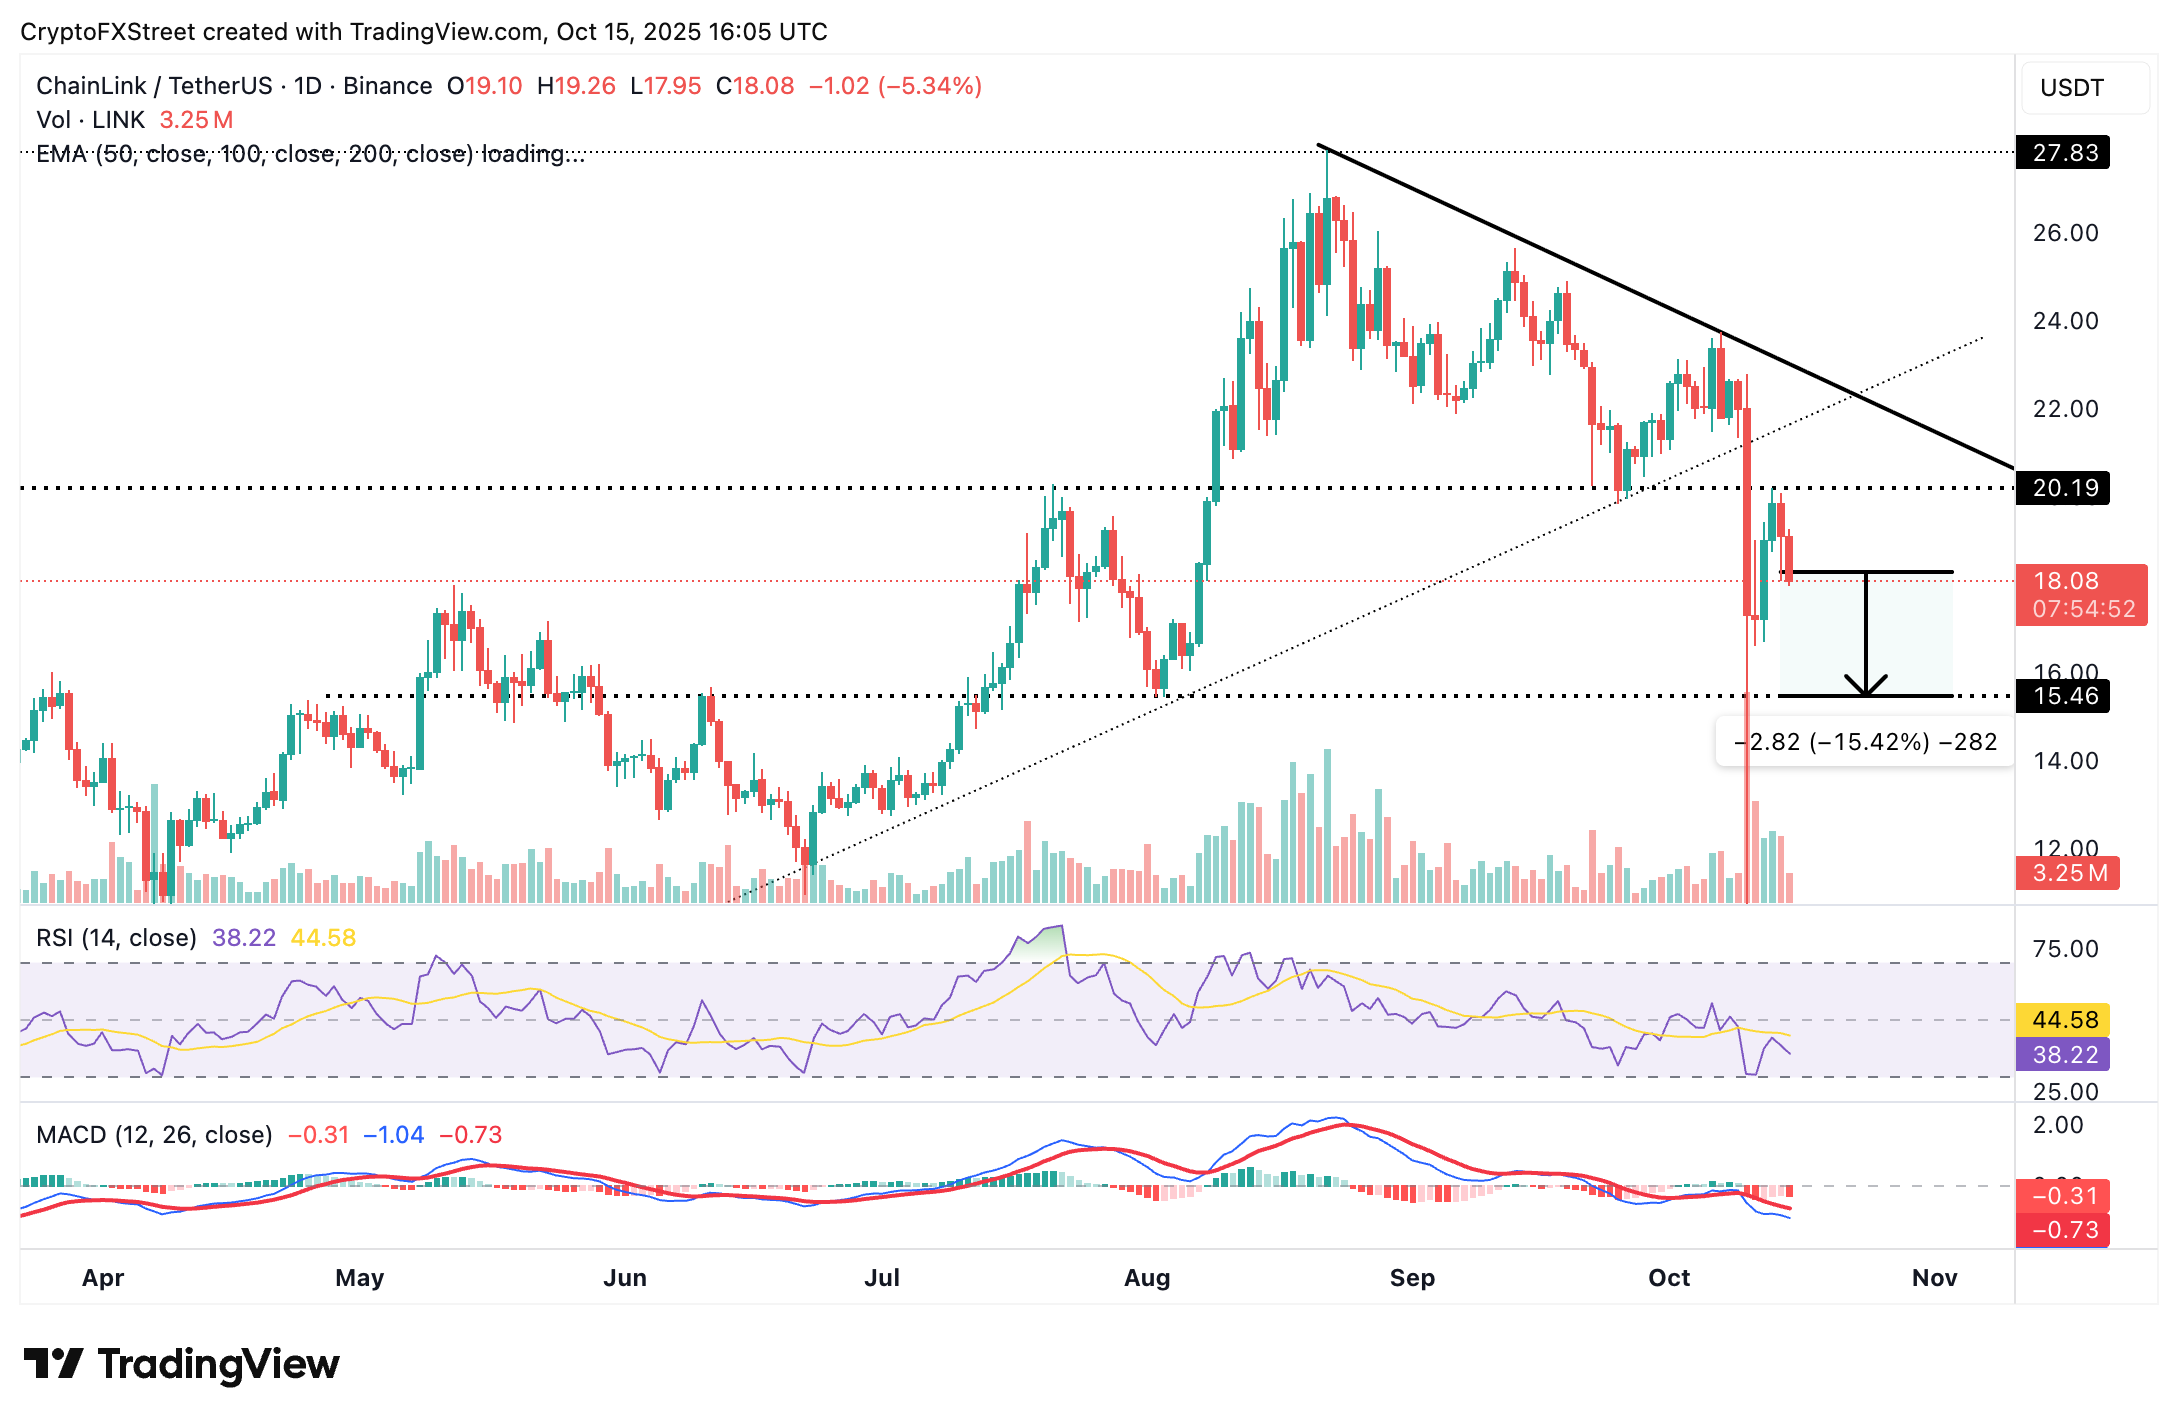
LINK/USDT daily chart
Still, it may be too early to rule out a potential rebound above $20.00, which would be accentuated by investors buying the dip. Key milestones for Chainlink include a break above the 200-day EMA at $19.08, the 100-day EMA at $20.59 and the 50-day EMA at $21.40.
Open Interest, funding rate FAQs
Higher Open Interest is associated with higher liquidity and new capital inflow to the market. This is considered the equivalent of increase in efficiency and the ongoing trend continues. When Open Interest decreases, it is considered a sign of liquidation in the market, investors are leaving and the overall demand for an asset is on a decline, fueling a bearish sentiment among investors.
Funding fees bridge the difference between spot prices and prices of futures contracts of an asset by increasing liquidation risks faced by traders. A consistently high and positive funding rate implies there is a bullish sentiment among market participants and there is an expectation of a price hike. A consistently negative funding rate for an asset implies a bearish sentiment, indicating that traders expect the cryptocurrency’s price to fall and a bearish trend reversal is likely to occur.

FXStreet
100만 명이 넘는 사용자가 FXStreet를 통해 실시간 시장 데이터, 차트 도구, 전문가 인사이트, 포렉스 뉴스를 이용합니다. 포괄적인 경제 캘린더와 교육 웨비나는 트레이더가 정보를 유지하고 신중한 결정을 내리도록 돕습니다. FXStreet는 바르셀로나 본사와 전 세계 지역에 걸쳐 약 60명의 팀으로 구성되어 있습니다.
Read More


