
Trade The World
Crypto Today: Bitcoin, Ethereum, XRP extend decline as ETF outflows pose headwinds
작성자 John Isige
게시일: 8 Jan 2026 | 수정일: 8 Jan 2026


POPULAR ARTICLES

Bitcoin (BTC) is trading around $90,000 at the time of writing on Thursday as volatility grips the broader cryptocurrency market. The decline from BTC’s weekly high of $94,789 can be attributed to uncertainty about wether the early-year rally will continue, which likely triggered profit-taking.
- Bitcoin struggles with selling pressure as institutional investor sentiment deteriorates.
- Ethereum hangs onto the 50-day EMA lifeline amid growing overhead risks and the resumption of ETF outflows.
- XRP falls for the third consecutive day as US-listed spot ETFs experience their first outflow since their launch.
Bitcoin (BTC) is trading around $90,000 at the time of writing on Thursday as volatility grips the broader cryptocurrency market. The decline from BTC’s weekly high of $94,789 can be attributed to uncertainty about wether the early-year rally will continue, which likely triggered profit-taking.
Altcoins, including Ethereum (ETH) and Ripple (XRP), also face increasing selling pressure, which continues to trim early-year gains.
Bitcoin, Ethereum, XRP stumble as ETH outflows weigh
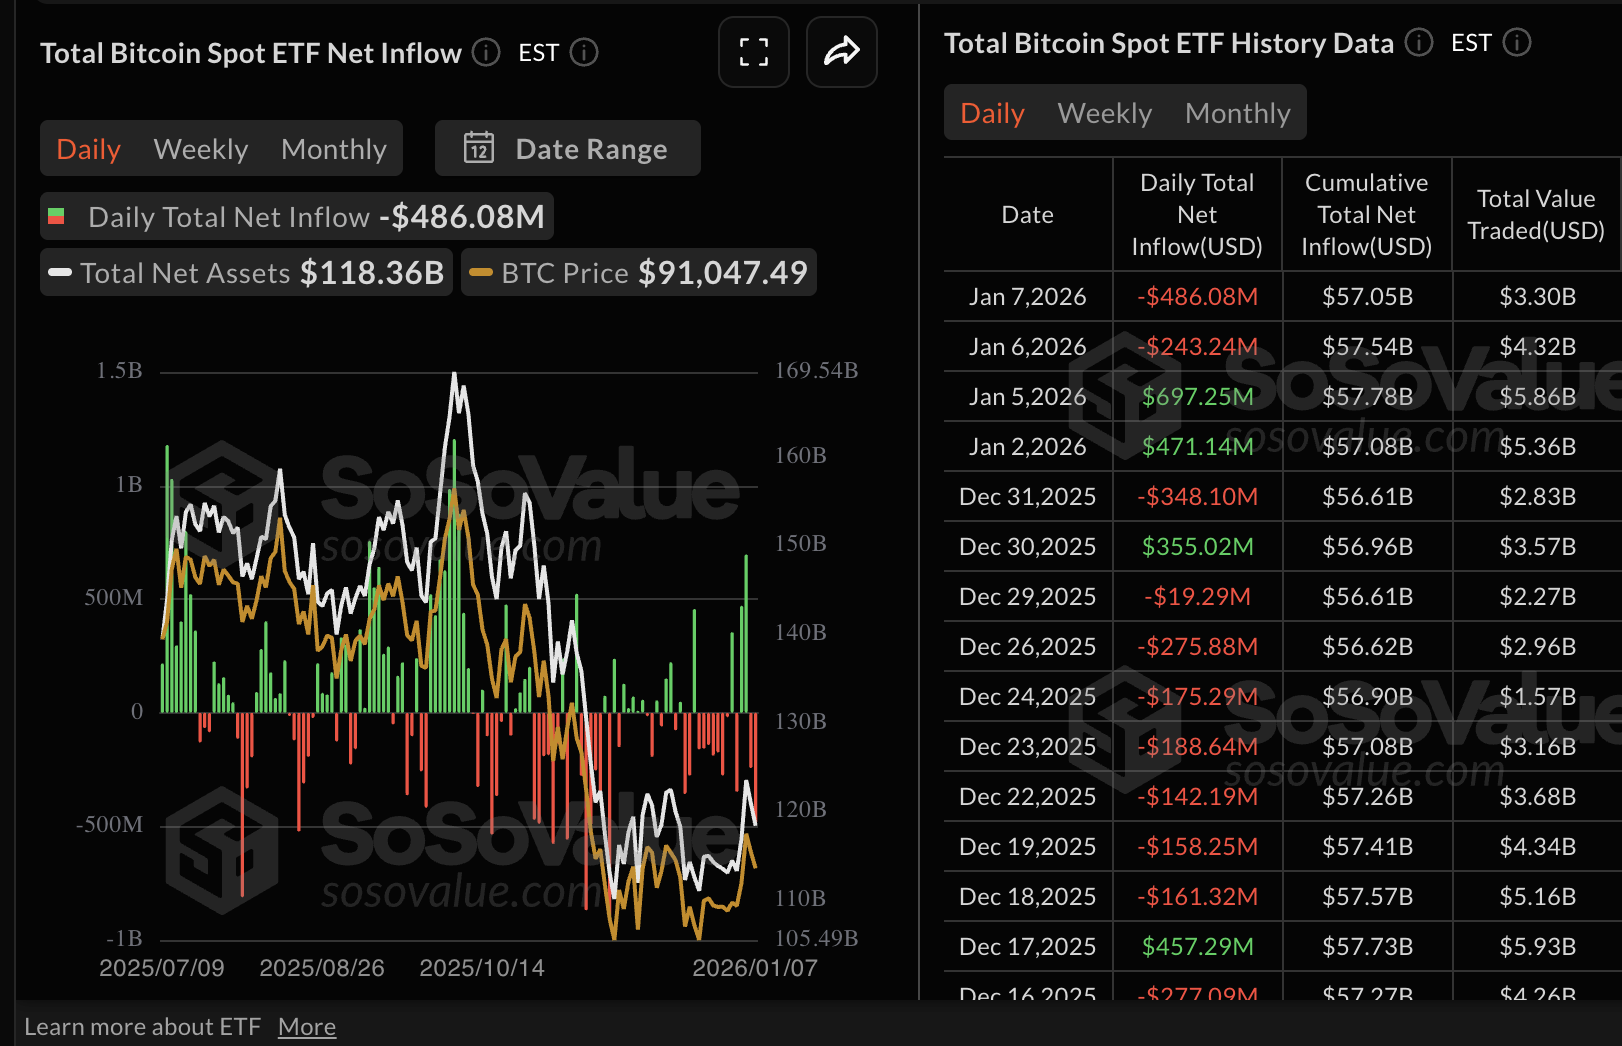
Bitcoin spot Exchange Traded Funds (ETFs) recorded outflows of $486 million on Wednesday, the highest single-day withdrawals since November 20, as prices across the crypto market faltered. Fidelity’s FBTC led with nearly $248 million in outflows, followed by BlackRock’s IBIT with almost $130 million and 21Shares’ ARKB with approximately $42 million.
The cumulative inflow now stands at $57 billion with net assets averaging $118 billion. The desire to offload Bitcoin points to escalating volatility and a lack of key catalysts to sustain the uptrend, which could continue to cap rebounds.
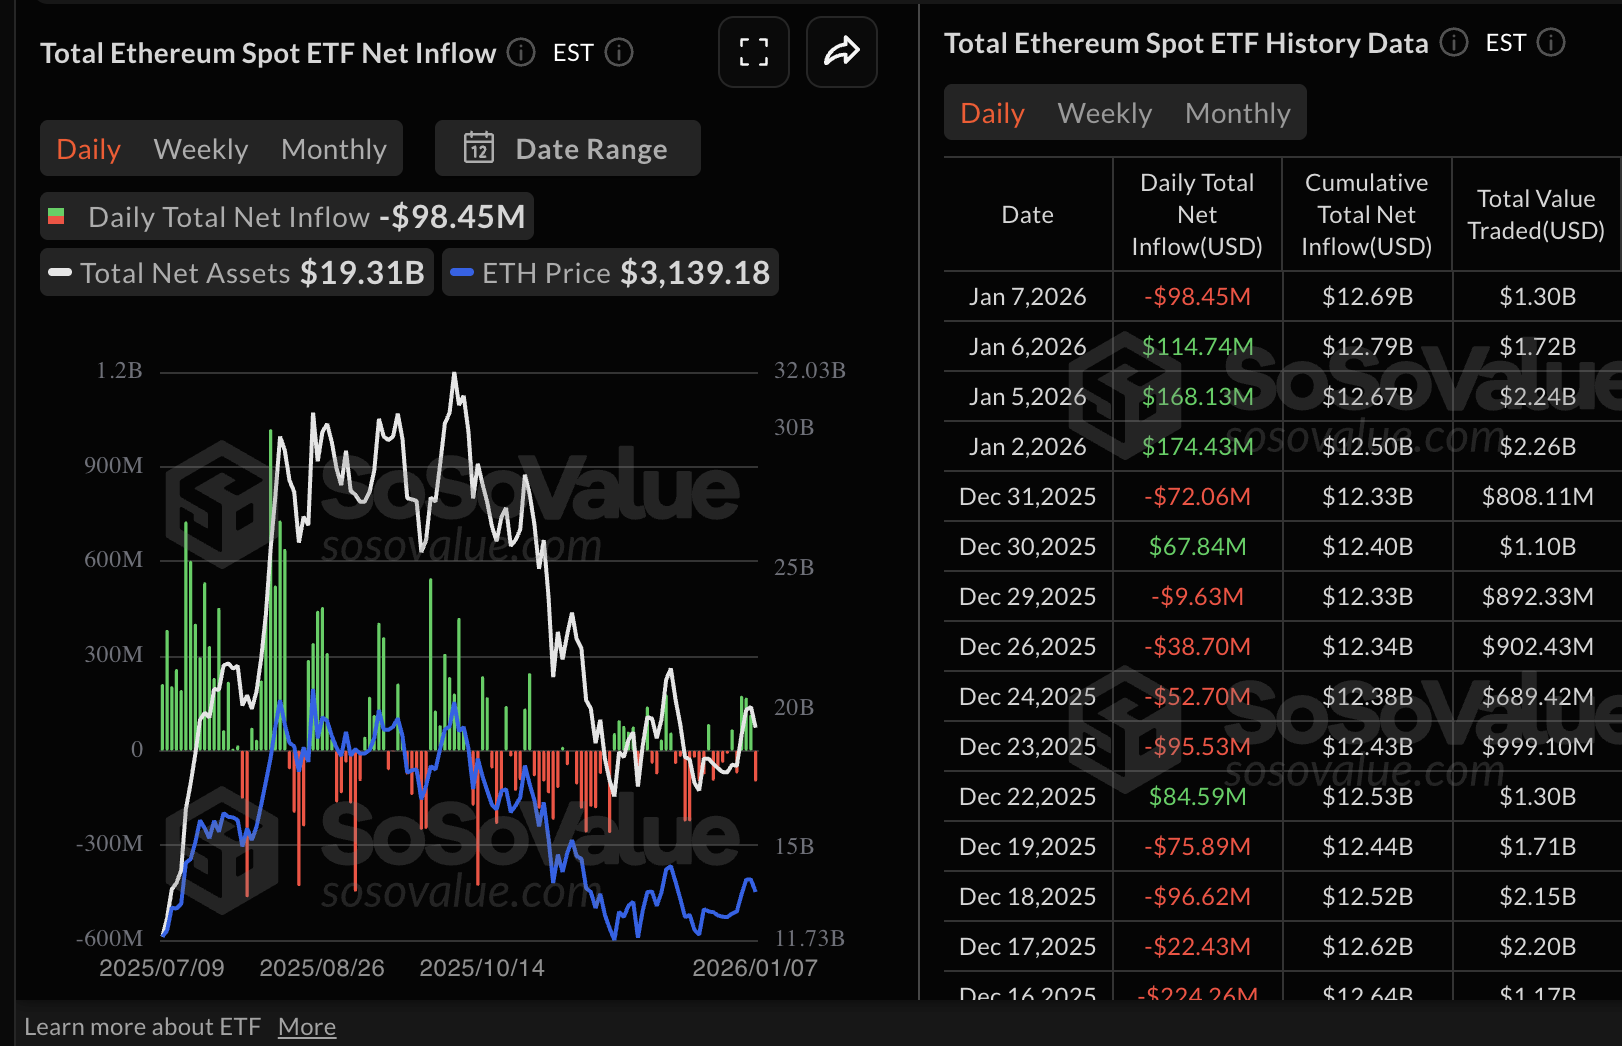
Ethereum spot ETFs, on the other hand, resumed outflows, with investors withdrawing approximately $98 million on Wednesday. Investors had maintained three consecutive days of inflows, which drew $115 million on Tuesday, $168 million on Monday and $174 million on Friday. The cumulative inflow now stands at $12.69 billion with net assets averaging $19.31 billion.
Meanwhile, US-listed XRP spot ETFs posted nearly $41 million in outflows on Wednesday. This marked the first outflow since the ETFs’ debut in November, signaling a potential shift in sentiment as volatility grips the crypto market. The cumulative inflow now stands at $1.2 billion with net assets averaging $1.53 billion, according to SoSoValue data.
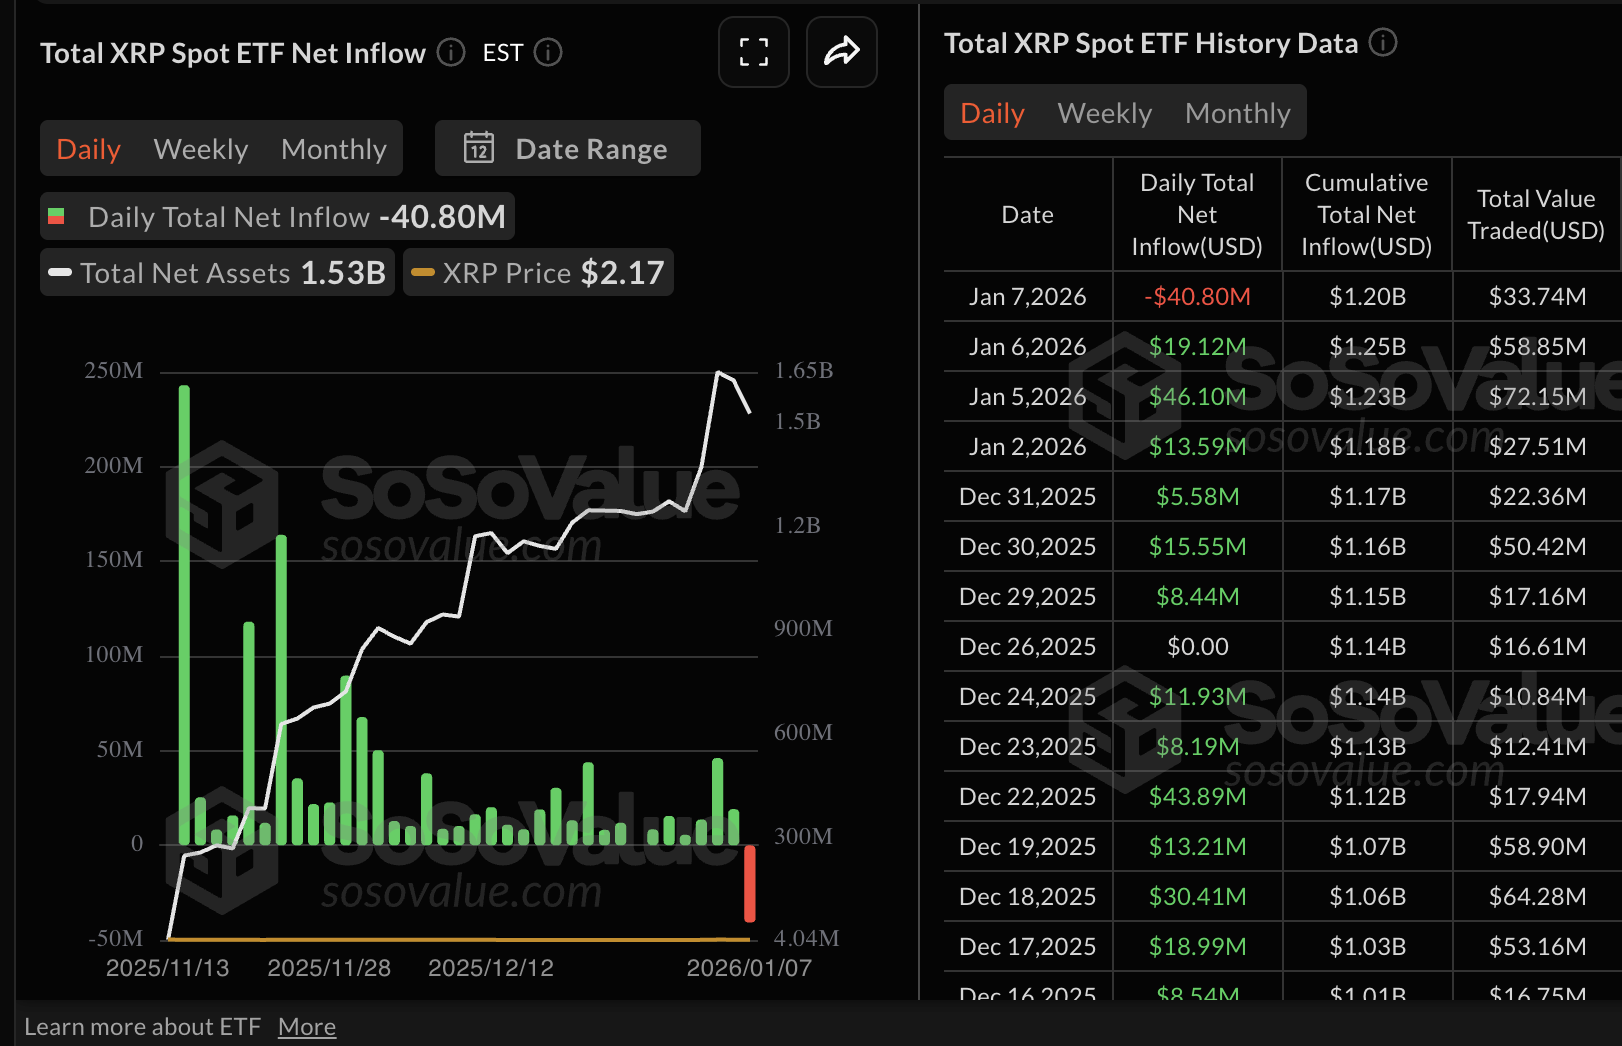
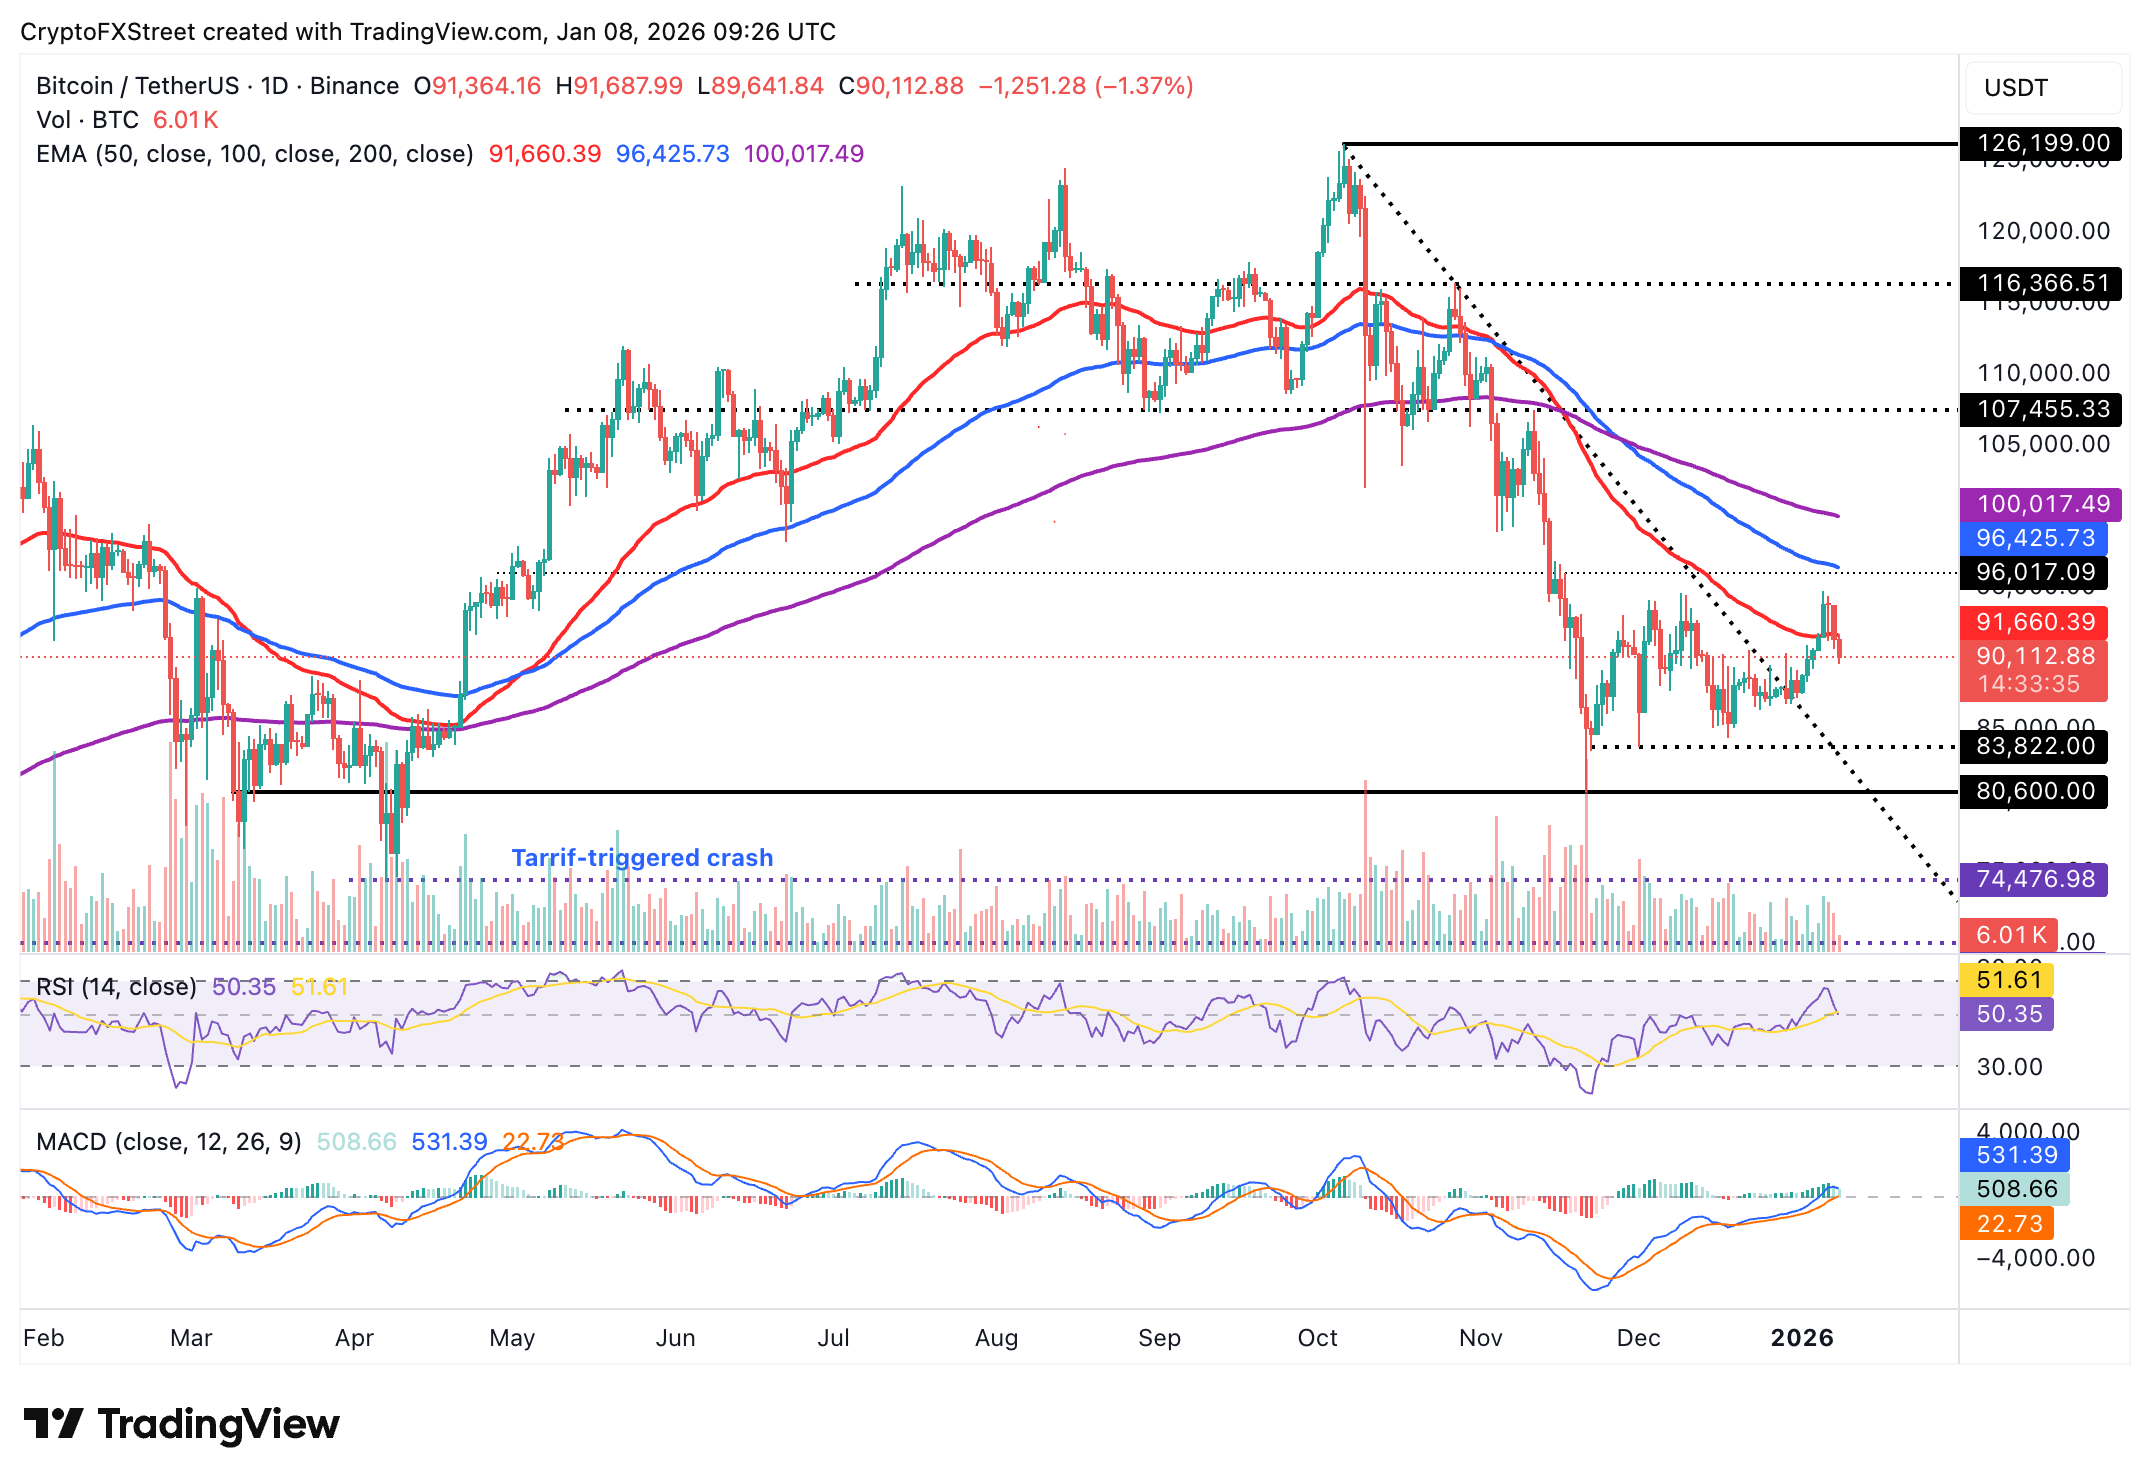
Chart of the day: Bitcoin trades under pressure
Bitcoin is trading in a choppy range around $90,000 at the time of writing on Thursday, following a rejection of the weekly high of $94,789. A weak technical structure characterizes price action, with the Relative Strength Index (RSI) dropping to the midline at 50 on the daily chart. A further decline in the RSI would exacerbate the sell-off below the pivotal $90,000 level.
Despite the Moving Average Convergence Divergence (MACD) showing slight positive divergence, with green histogram bars above the mean line, Bitcoin’s overall outlook remains bearish.
Traders will watch out for the blue MACD line's potential crossover below the red signal line as confirmation to reduce exposure as selling pressure intensifies. Still, a close above the 50-day Exponential Moving Average (EMA) at $91,660 would renew optimism for a breakout targeting $100,000.
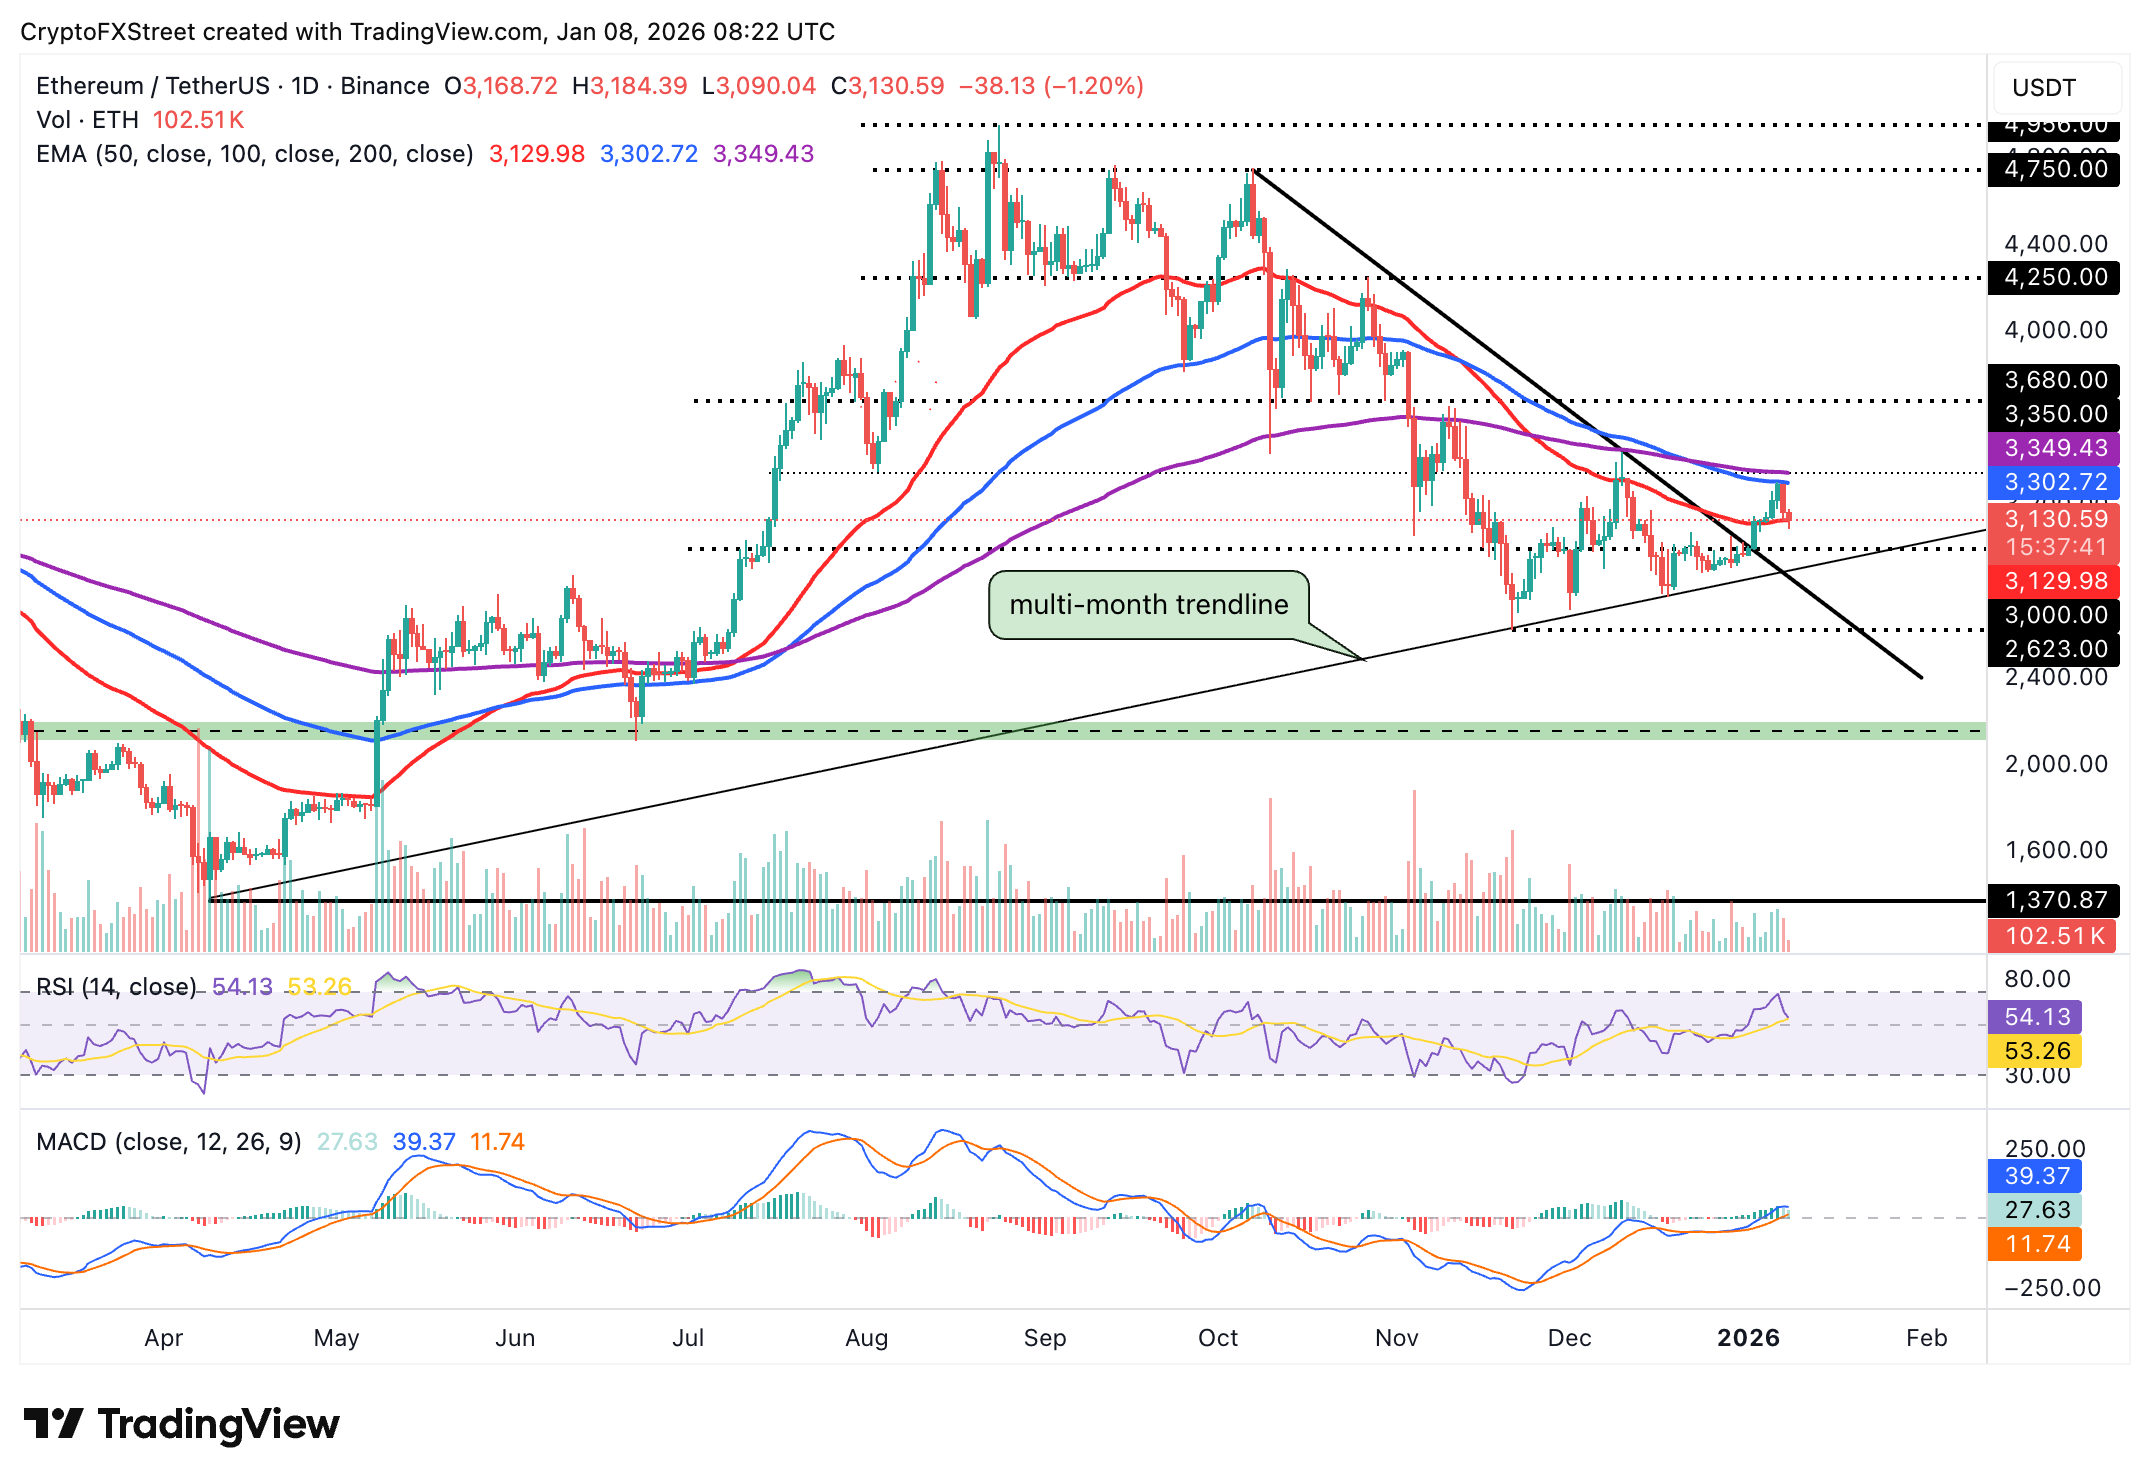
Altcoins technical outlook: Ethereum, XRP selloff persists
Ethereum is sliding toward the $3,000 key level at the time of writing on Thursday, after being rejected at the 100-day EMA at $3,302 earlier in the week. The RSI at 52 on the daily chart is on the cusp of extending the decline below the midline, which would suggest that bearish momentum is increasing.
The 50-day EMA at $3,129 provides short-term support, potentially keeping Ethereum above $3,000. However, the smart contracts token remains in the woods until bulls push for a close above the moving average cluster at the 100-day EMA ($3,302) and the 200-day EMA ($3,349).
The MACD indicator has maintained a positive divergence since December 31, with the green histogram bars above the mean line encouraging investors to stay put or increase risk exposure. However, if the blue MACD line crosses below the red signal line, the odds of Ethereum falling below $3,000 would increase significantly.
As for XRP, the price remains under pressure for the third consecutive day, trading at $2.10 at the time of writing on Thursday. The downtrending RSI at 55 on the daily chart indicates the technical structure could weaken further.
The 50-day EMA at $2.07 is poised to absorb selling pressure, but if broken, the path of least resistance would remain downward. A break below $2.00 is on the cards with the next key areas of interest at $1.77 and $1.61, tested in November and April, respectively.

Still, the MACD indicator is holding onto a buy signal triggered on December 31, which could encourage traders to lean into risk and add to the tailwind. The green histogram bars above the mean line indicate that bulls have a slight edge over bears.
Cryptocurrency prices FAQs
Token launches influence demand and adoption among market participants. Listings on crypto exchanges deepen the liquidity for an asset and add new participants to an asset’s network. This is typically bullish for a digital asset.
A hack is an event in which an attacker captures a large volume of the asset from a DeFi bridge or hot wallet of an exchange or any other crypto platform via exploits, bugs or other methods. The exploiter then transfers these tokens out of the exchange platforms to ultimately sell or swap the assets for other cryptocurrencies or stablecoins. Such events often involve an en masse panic triggering a sell-off in the affected assets.
Macroeconomic events like the US Federal Reserve’s decision on interest rates influence crypto assets mainly through the direct impact they have on the US Dollar. An increase in interest rate typically negatively influences Bitcoin and altcoin prices, and vice versa. If the US Dollar index declines, risk assets and associated leverage for trading gets cheaper, in turn driving crypto prices higher.
Halvings are typically considered bullish events as they slash the block reward in half for miners, constricting the supply of the asset. At consistent demand if the supply reduces, the asset’s price climbs.

FXStreet
100만 명이 넘는 사용자가 FXStreet를 통해 실시간 시장 데이터, 차트 도구, 전문가 인사이트, 포렉스 뉴스를 이용합니다. 포괄적인 경제 캘린더와 교육 웨비나는 트레이더가 정보를 유지하고 신중한 결정을 내리도록 돕습니다. FXStreet는 바르셀로나 본사와 전 세계 지역에 걸쳐 약 60명의 팀으로 구성되어 있습니다.
Read More


