
Crypto Today: Bitcoin, Ethereum, XRP trade under pressure amid mixed ETF flows
작성자 John Isige
게시일: 4 Dec 2025 | 수정일: 4 Dec 2025


인기 기사

Bitcoin (BTC) is holding above its short-term support at $93,000 at the time of writing on Thursday. The uptrend from Monday’s low of $83,822 has shrugged off the wobbly institutional. Still, the much-awaited breakout to $100,000 could face challenges, especially due to low retail demand.
- Bitcoin steadies above $93,000 despite faltering institutional demand and ETF outflows.
- Ethereum uptrend cools below the 50-day EMA as ETF inflows resume.
- XRP ETFs extend their inflow streak to 13 consecutive days, even as the price wobbles below the $2.20 resistance.
Bitcoin (BTC) is holding above its short-term support at $93,000 at the time of writing on Thursday. The uptrend from Monday’s low of $83,822 has shrugged off the wobbly institutional. Still, the much-awaited breakout to $100,000 could face challenges, especially due to low retail demand.
Meanwhile, altcoins, including Ethereum (ETH) and Ripple (XRP), are struggling to maintain their recovery, possibly due to early profit-taking.
Data spotlight: Bitcoin, Ethereum, XRP stabilise, hinting at easing selling pressure
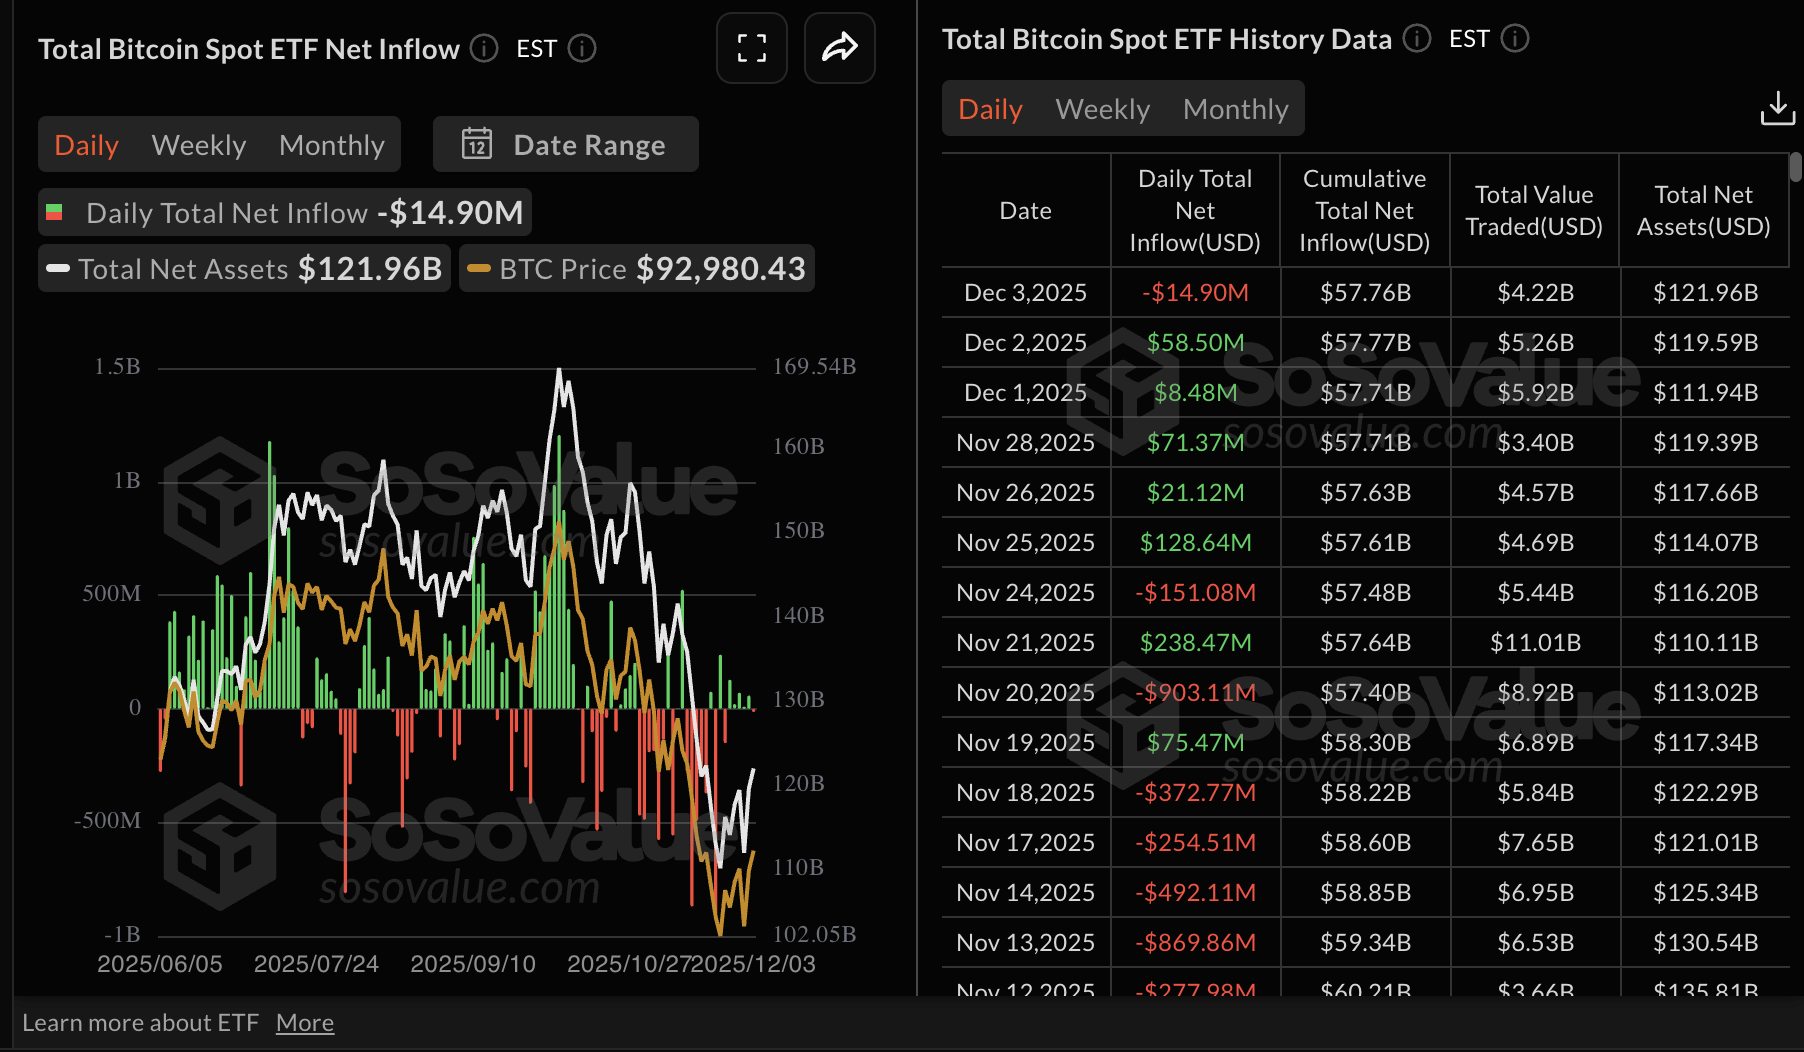
Bitcoin spot Exchange Traded Funds (ETFs) operating in the United States (US) recorded nearly $15 million in outflows on Wednesday, breaking a five-day streak of consecutive inflows.
BlackRock’s IBIT was the only ETF that saw inflows, with approximately $42 million streaming in. 21Shares ARKB was the worst-performing ETF with outflows of $37 million, according to SoSoValue data.
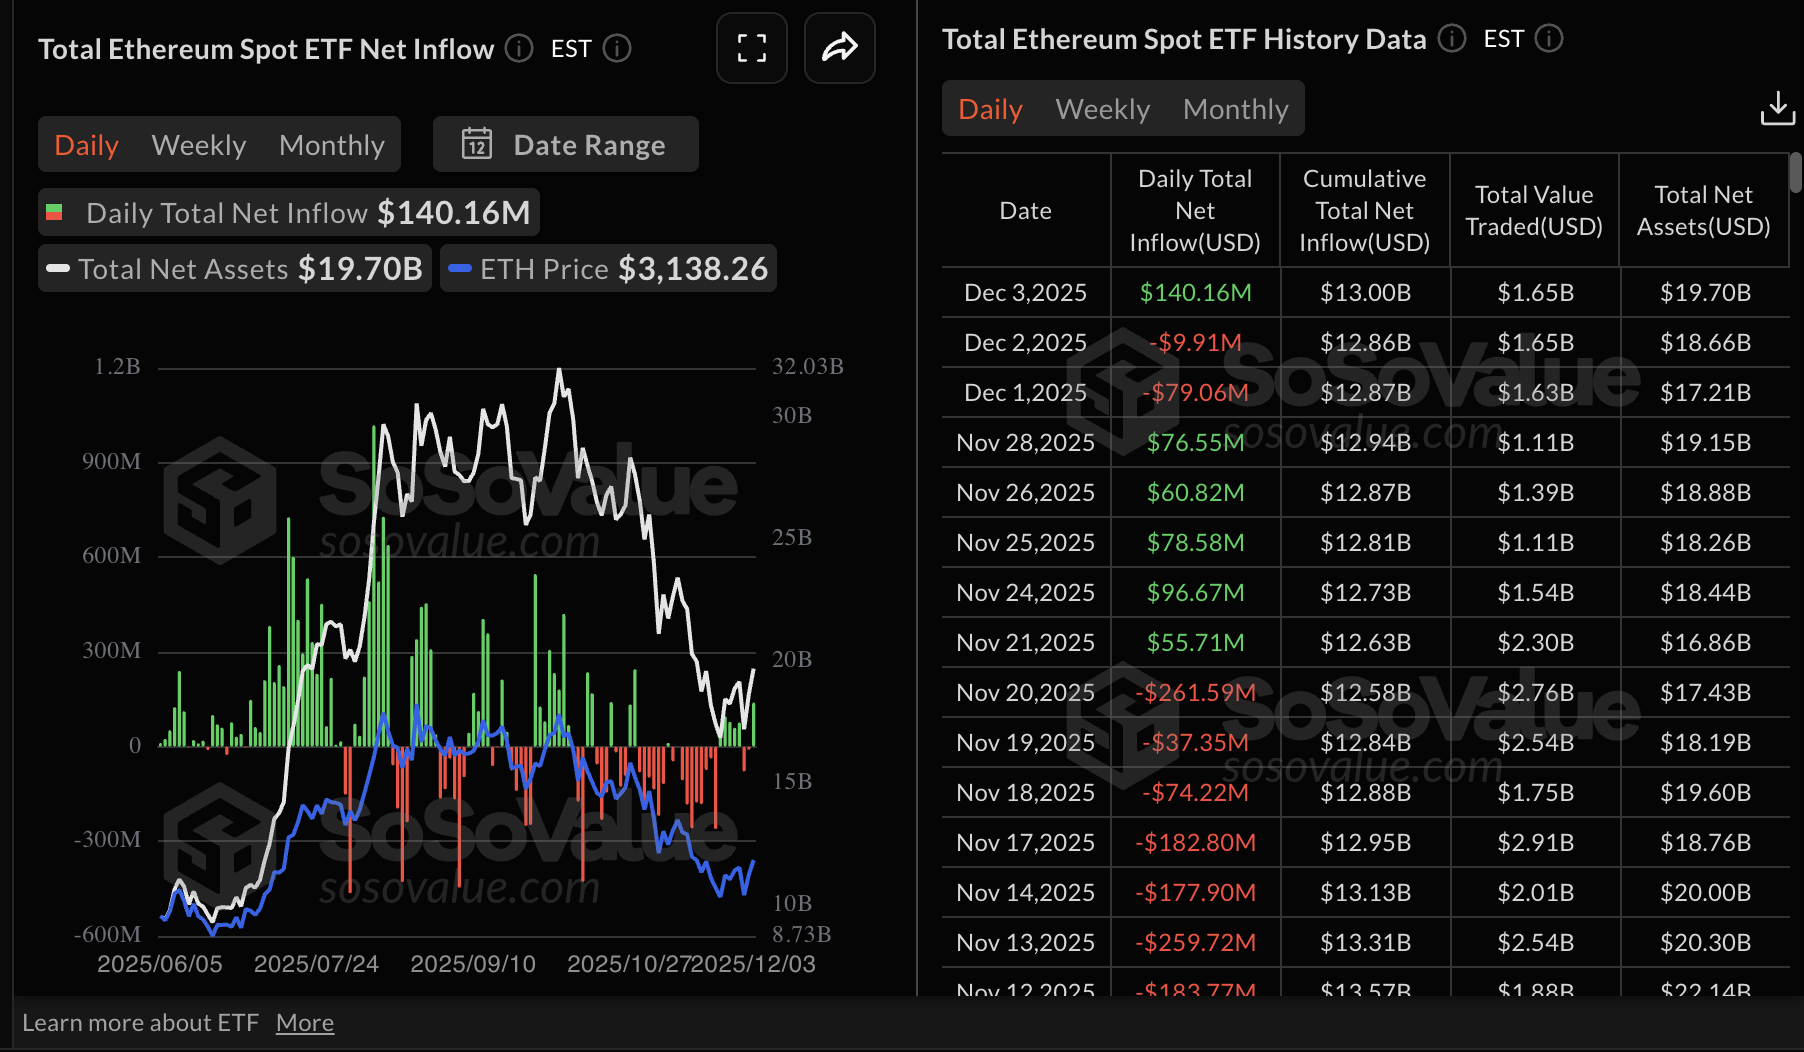
Ethereum spot ETFs saw $140 million in inflows on Wednesday, after recording two consecutive days of outflows. On Tuesday, outflows totalled $10 million, while on Monday they totalled $79 million. The cumulative total net inflow volume averages $13 billion, with net assets of $19.7 billion as of December 3.
XRP, on the other hand, continues to post steady ETF inflows, signaling a potential shift in investors' interest toward altcoin-based investment products. As shown in the chart below, US-listed XRP ETFs recorded roughly $50 million in inflows on Wednesday, extending a 13-day positive streak. So far, XRP ETFs have $874 million in cumulative inflows, with net assets of $906 million.
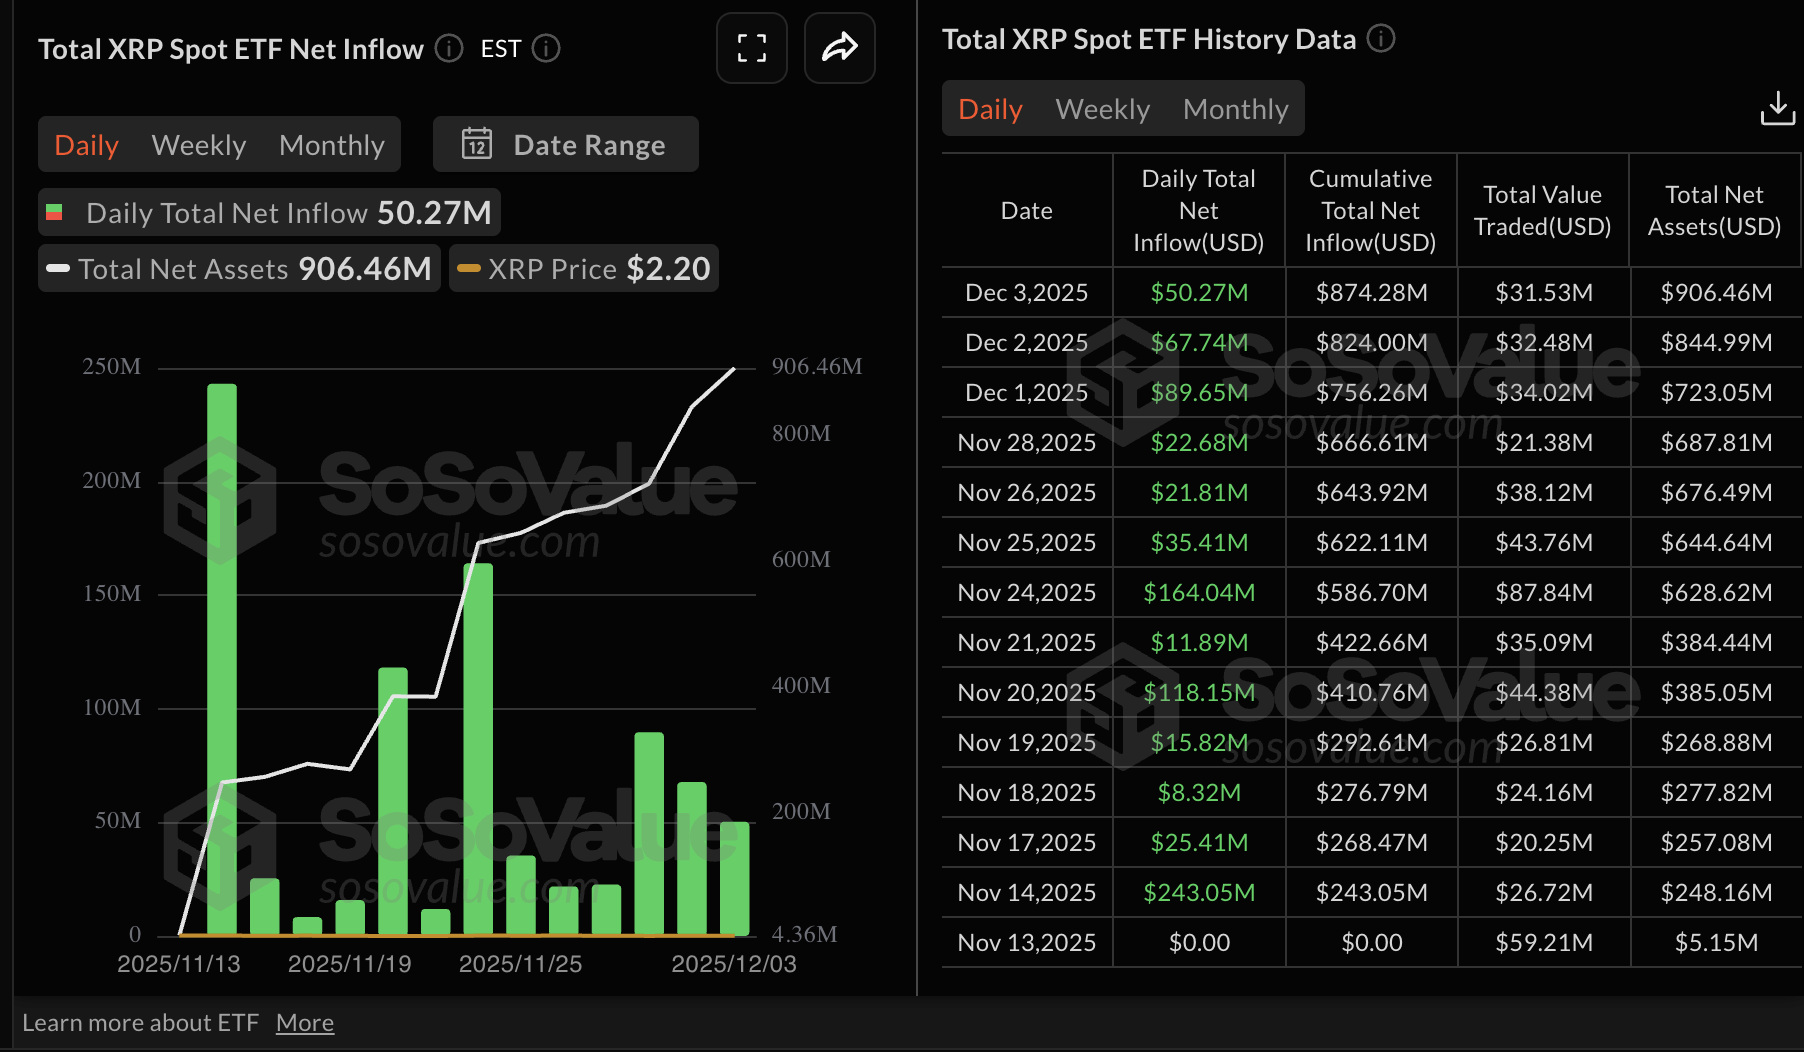
Chart of the day: Bitcoin steadies above key support
Bitcoin is holding above $93,000 at the time of writing on Thursday, as bulls push to regain control and close the gap toward $100,000. The Moving Average Convergence Divergence (MACD) indicator has maintained a buy signal on the daily chart since November 26, suggesting that bearish momentum is easing.
The Relative Strength Index (RSI) on the same chart is poised to close above the neutral line, a move likely to uphold the short-term bullish outlook. Higher RSI readings toward the overbought region indicate that bulls have the upper hand, increasing the probability of a breakout.
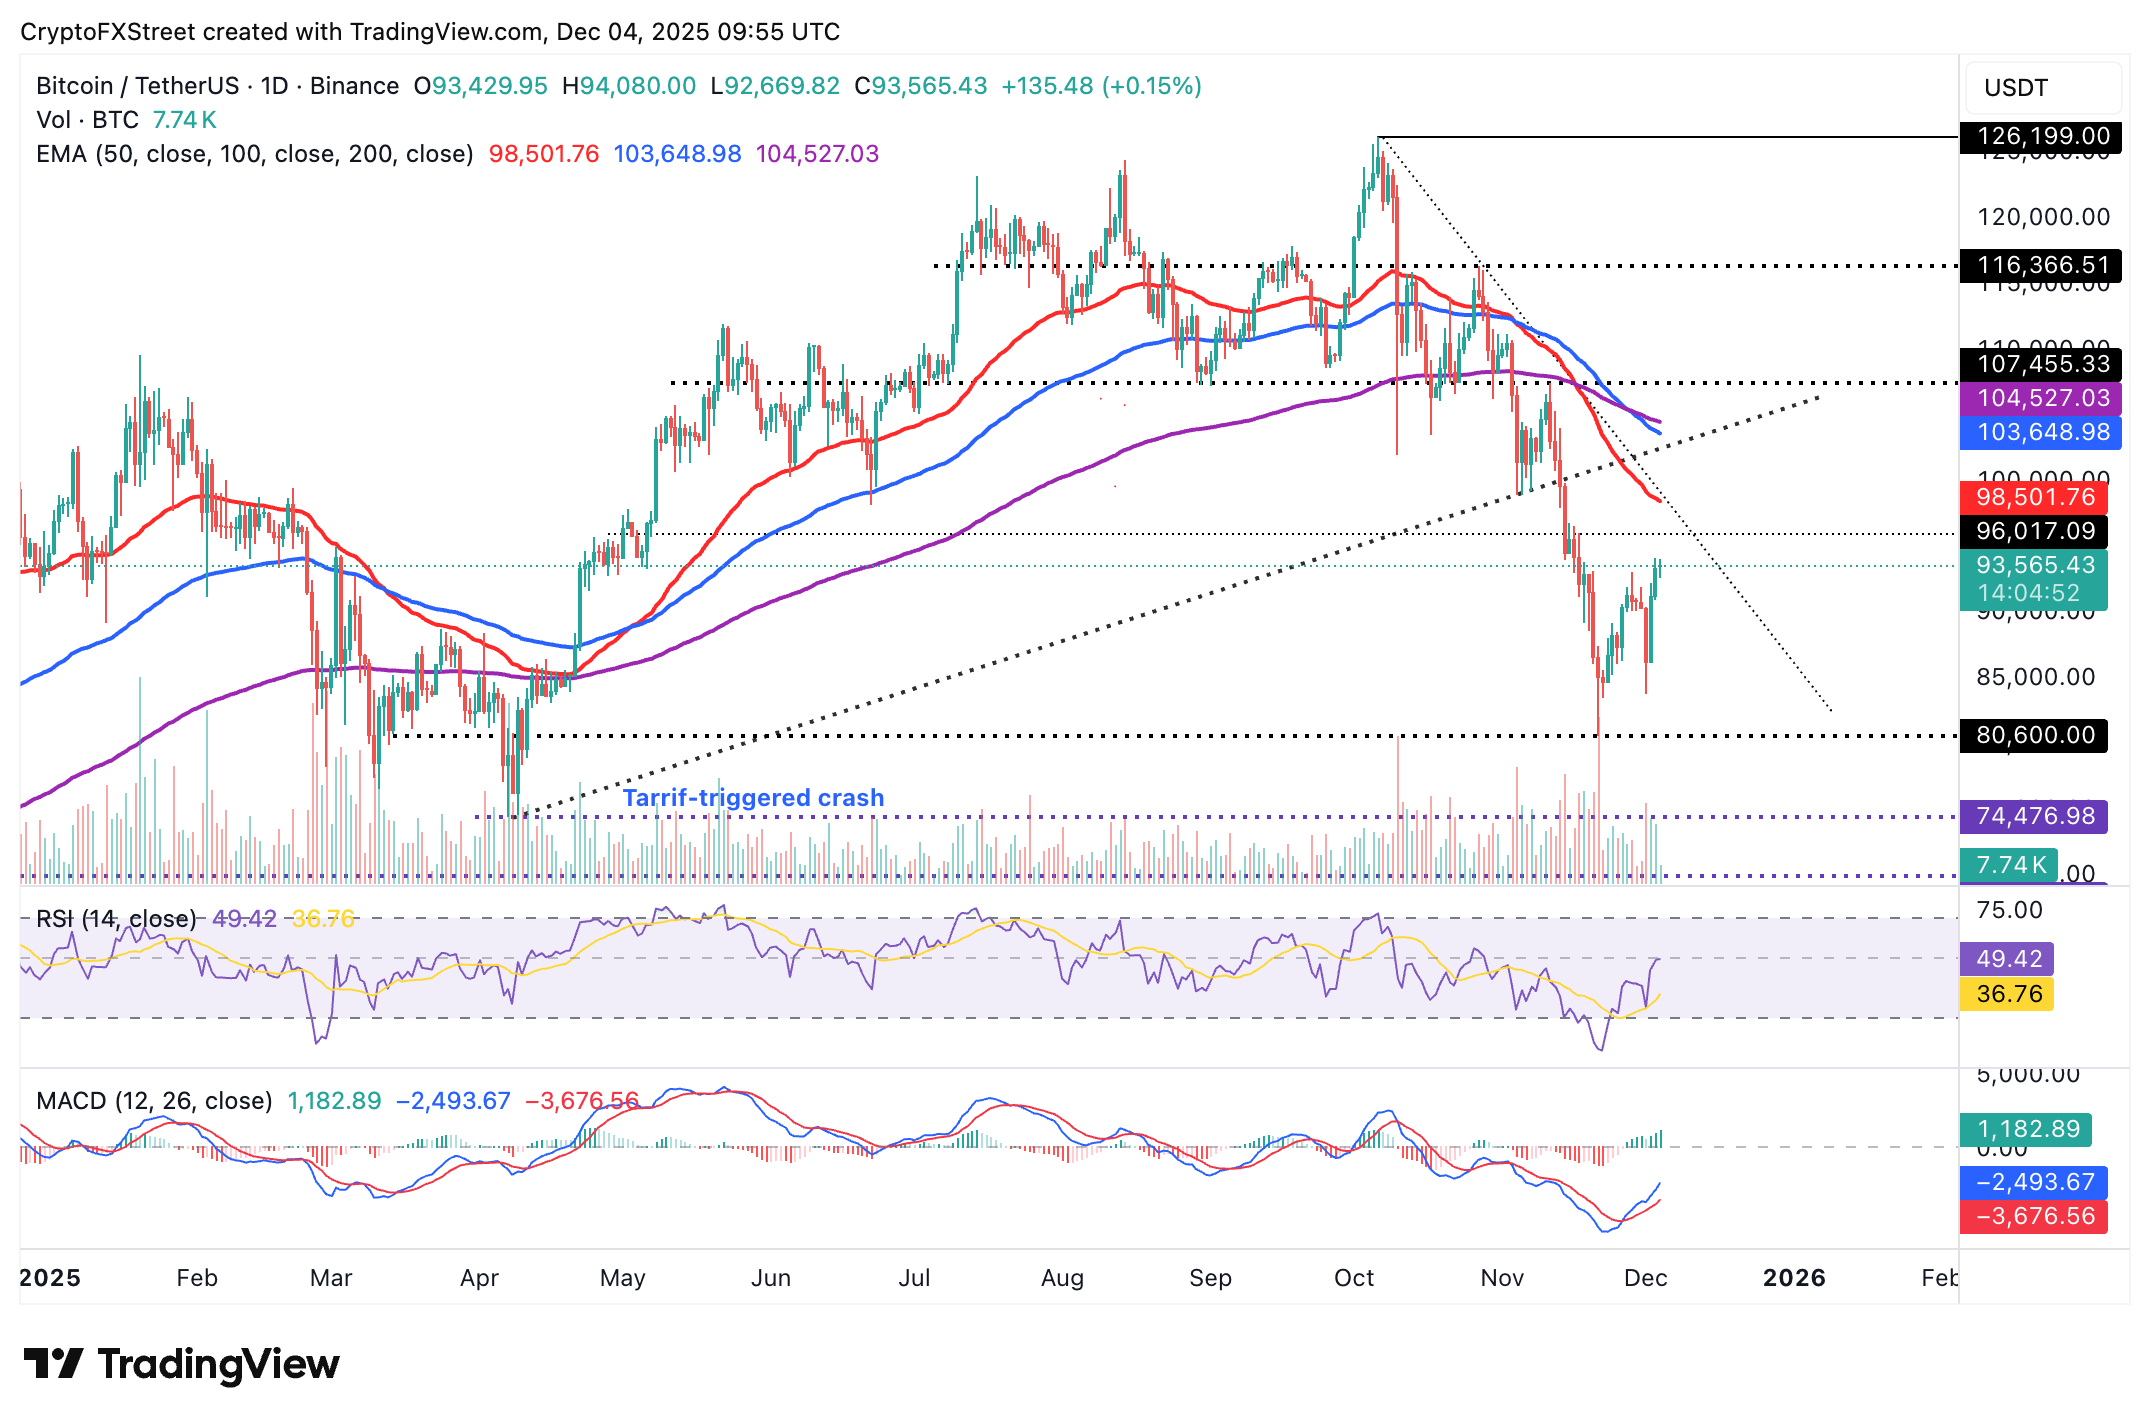
However, investors should temper their bullish expectations, considering Bitcoin is trading below the 50-day Exponential Moving Average (EMA) at $98,501, the 100-day EMA at $103,648 and the 200-day EMA at $104,527, all of which could cap rebounds. A reverse below the $90,000 level could shift the trend downward toward $80,000.
Altcoins update: Ethereum, XRP poised to regain momentum
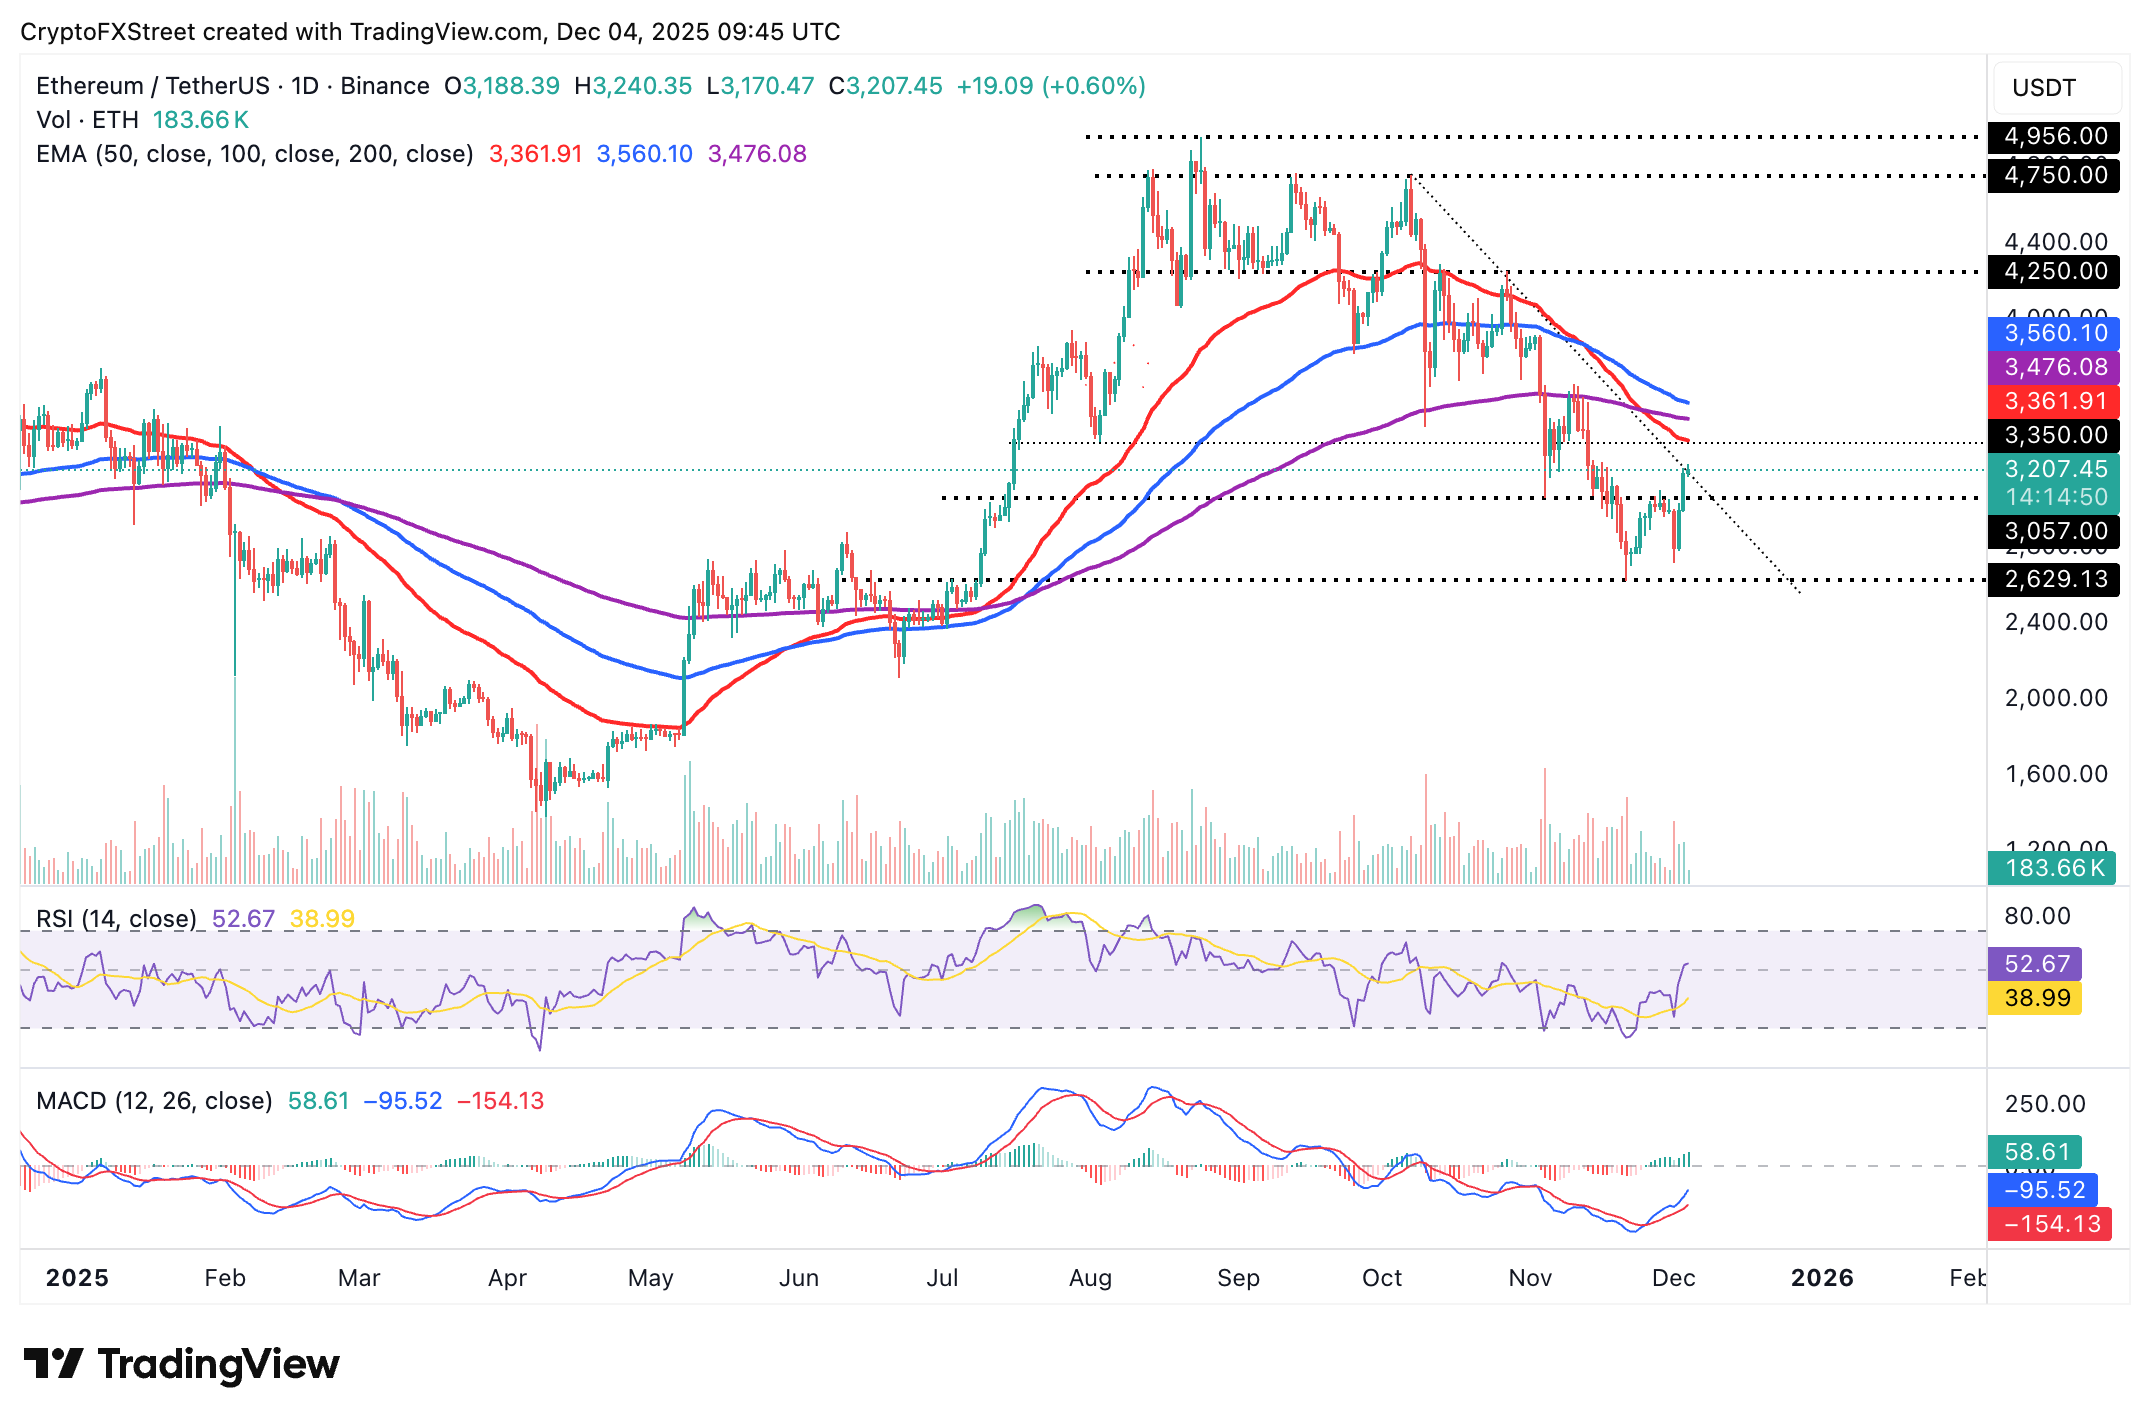
Ethereum is trading above $3,200 at the time of writing on Thursday, supported by the resurgence of ETF inflows and mildly positive sentiment in the broader cryptocurrency market.
The RSI at 52 has crossed into the bullish territory on the daily chart, suggesting that bulls are gaining momentum. At the same time, the MACD indicator maintains a buy signal with the blue line above the red signal line. The green histogram bars increasing reinforce the bullish momentum.
Still, the smart contracts token also sits below the 50-day EMA at $3,361, the 200-day EMA at $3,476, and the 100-day EMA at $3,560, which underpin a bearish trend. A reversal below the $3,000 total support is still on the cards unless Ethereum flips the 50-day EMA into support.
Meanwhile, XRP is trading well below the descending 50-day EMA at $2.31, 100-day EMA at $2.47 the 200-day EMA at $2.49, underscoring a bearish bias. The MACD indicator's histogram bars are mildly positive on the daily chart, with the blue line marginally above the red signal line, hinting at tentative momentum repair.
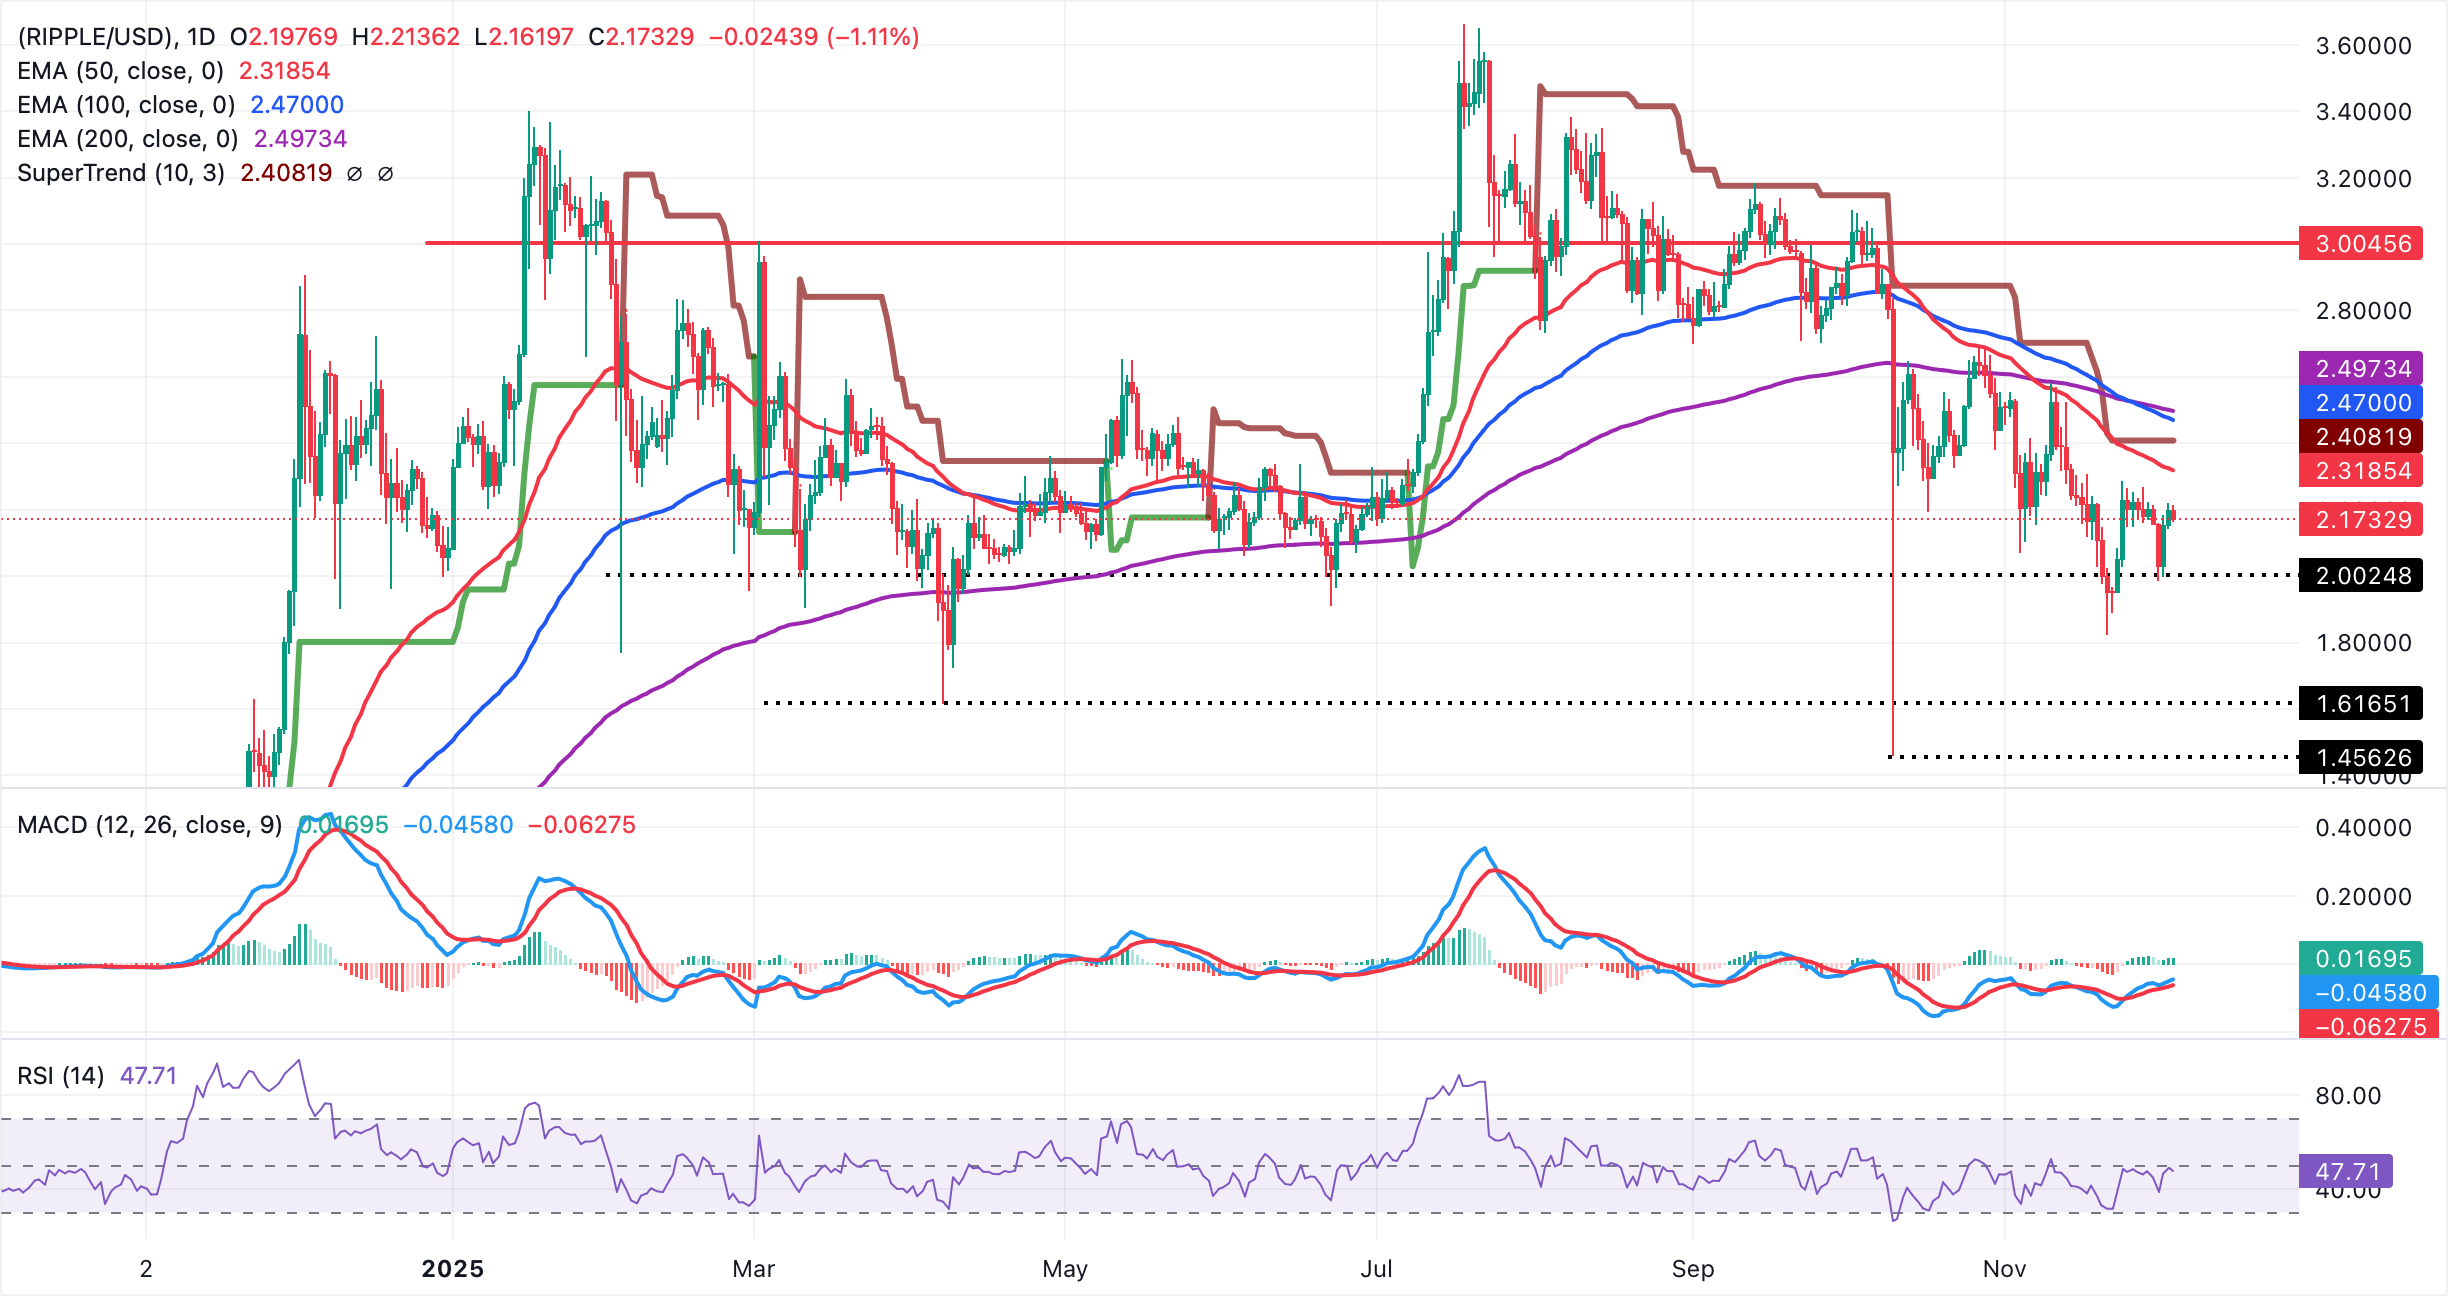
The RSI at 47 (neutral) is easing, indicating limited follow-through without fresh buying pressure. Furthermore, bearish pressure could hold with the SuperTrend at $2.40 obstructing recovery attempts.
Crypto ETF FAQs
An Exchange-Traded Fund (ETF) is an investment vehicle or an index that tracks the price of an underlying asset. ETFs can not only track a single asset, but a group of assets and sectors. For example, a Bitcoin ETF tracks Bitcoin’s price. ETF is a tool used by investors to gain exposure to a certain asset.
Yes. The first Bitcoin futures ETF in the US was approved by the US Securities & Exchange Commission in October 2021. A total of seven Bitcoin futures ETFs have been approved, with more than 20 still waiting for the regulator’s permission. The SEC says that the cryptocurrency industry is new and subject to manipulation, which is why it has been delaying crypto-related futures ETFs for the last few years.
Yes. The SEC approved in January 2024 the listing and trading of several Bitcoin spot Exchange-Traded Funds, opening the door to institutional capital and mainstream investors to trade the main crypto currency. The decision was hailed by the industry as a game changer.
The main advantage of crypto ETFs is the possibility of gaining exposure to a cryptocurrency without ownership, reducing the risk and cost of holding the asset. Other pros are a lower learning curve and higher security for investors since ETFs take charge of securing the underlying asset holdings. As for the main drawbacks, the main one is that as an investor you can’t have direct ownership of the asset, or, as they say in crypto, “not your keys, not your coins.” Other disadvantages are higher costs associated with holding crypto since ETFs charge fees for active management. Finally, even though investing in ETFs reduces the risk of holding an asset, price swings in the underlying cryptocurrency are likely to be reflected in the investment vehicle too.
(The technical analysis of this story was written with the help of an AI tool)

100만 명이 넘는 사용자가 FXStreet를 통해 실시간 시장 데이터, 차트 도구, 전문가 인사이트, 포렉스 뉴스를 이용합니다. 포괄적인 경제 캘린더와 교육 웨비나는 트레이더가 정보를 유지하고 신중한 결정을 내리도록 돕습니다. FXStreet는 바르셀로나 본사와 전 세계 지역에 걸쳐 약 60명의 팀으로 구성되어 있습니다.
더 읽기


