
Trade The World
Crypto Today: Could Bitcoin, Ethereum, XRP flip the historically bearish August trend to bullish?
작성자 John Isige
게시일: 1 Aug 2025 | 수정일: 1 Aug 2025


POPULAR ARTICLES

Investors in the cryptocurrency market are dealing with aggressive headwinds on Friday following a bullish July, which saw Bitcoin (BTC) and select altcoins rally to new record highs.
- Bitcoin slides below $115,000 as bears eye $112,000 support amid surging crypto liquidations.
- Ethereum starts August on a shaky note following a bullish July, targeting support at $3,500.
- XRP extends decline below $3.00, underpinned by multiple bearish technical signals.
Investors in the cryptocurrency market are dealing with aggressive headwinds on Friday following a bullish July, which saw Bitcoin (BTC) and select altcoins rally to new record highs.
Bitcoin is trading below $115,000 at the time of writing, rising slightly from an intraday low of $114,116. Ethereum (ETH) is showing bearish signs after extending its correction from the July peak of $3,941 and falling toward support at $3,500.
Interest in altcoins remains shaky, underpinned by Ripple (XRP) trading below $3.00 on the backdrop of a steady rally to a new record high of $3.66.
Market overview: Crypto liquidations surge as prices drop
Investors in the derivatives market are counting losses after getting caught up in macroeconomic crosshairs, ranging from a hawkish Federal Reserve (Fed) to United States (US) President Donald Trump's higher tariffs.
Leveraged traders have been hit hard, with liquidations in the derivatives market reaching $755 million over the past 24 hours. Ethereum leads with the highest liquidations of $226 million, followed by Bitcoin with $180 million, Solana (SOL) with $44 million and XRP with $42 million, according to CoinGlass.
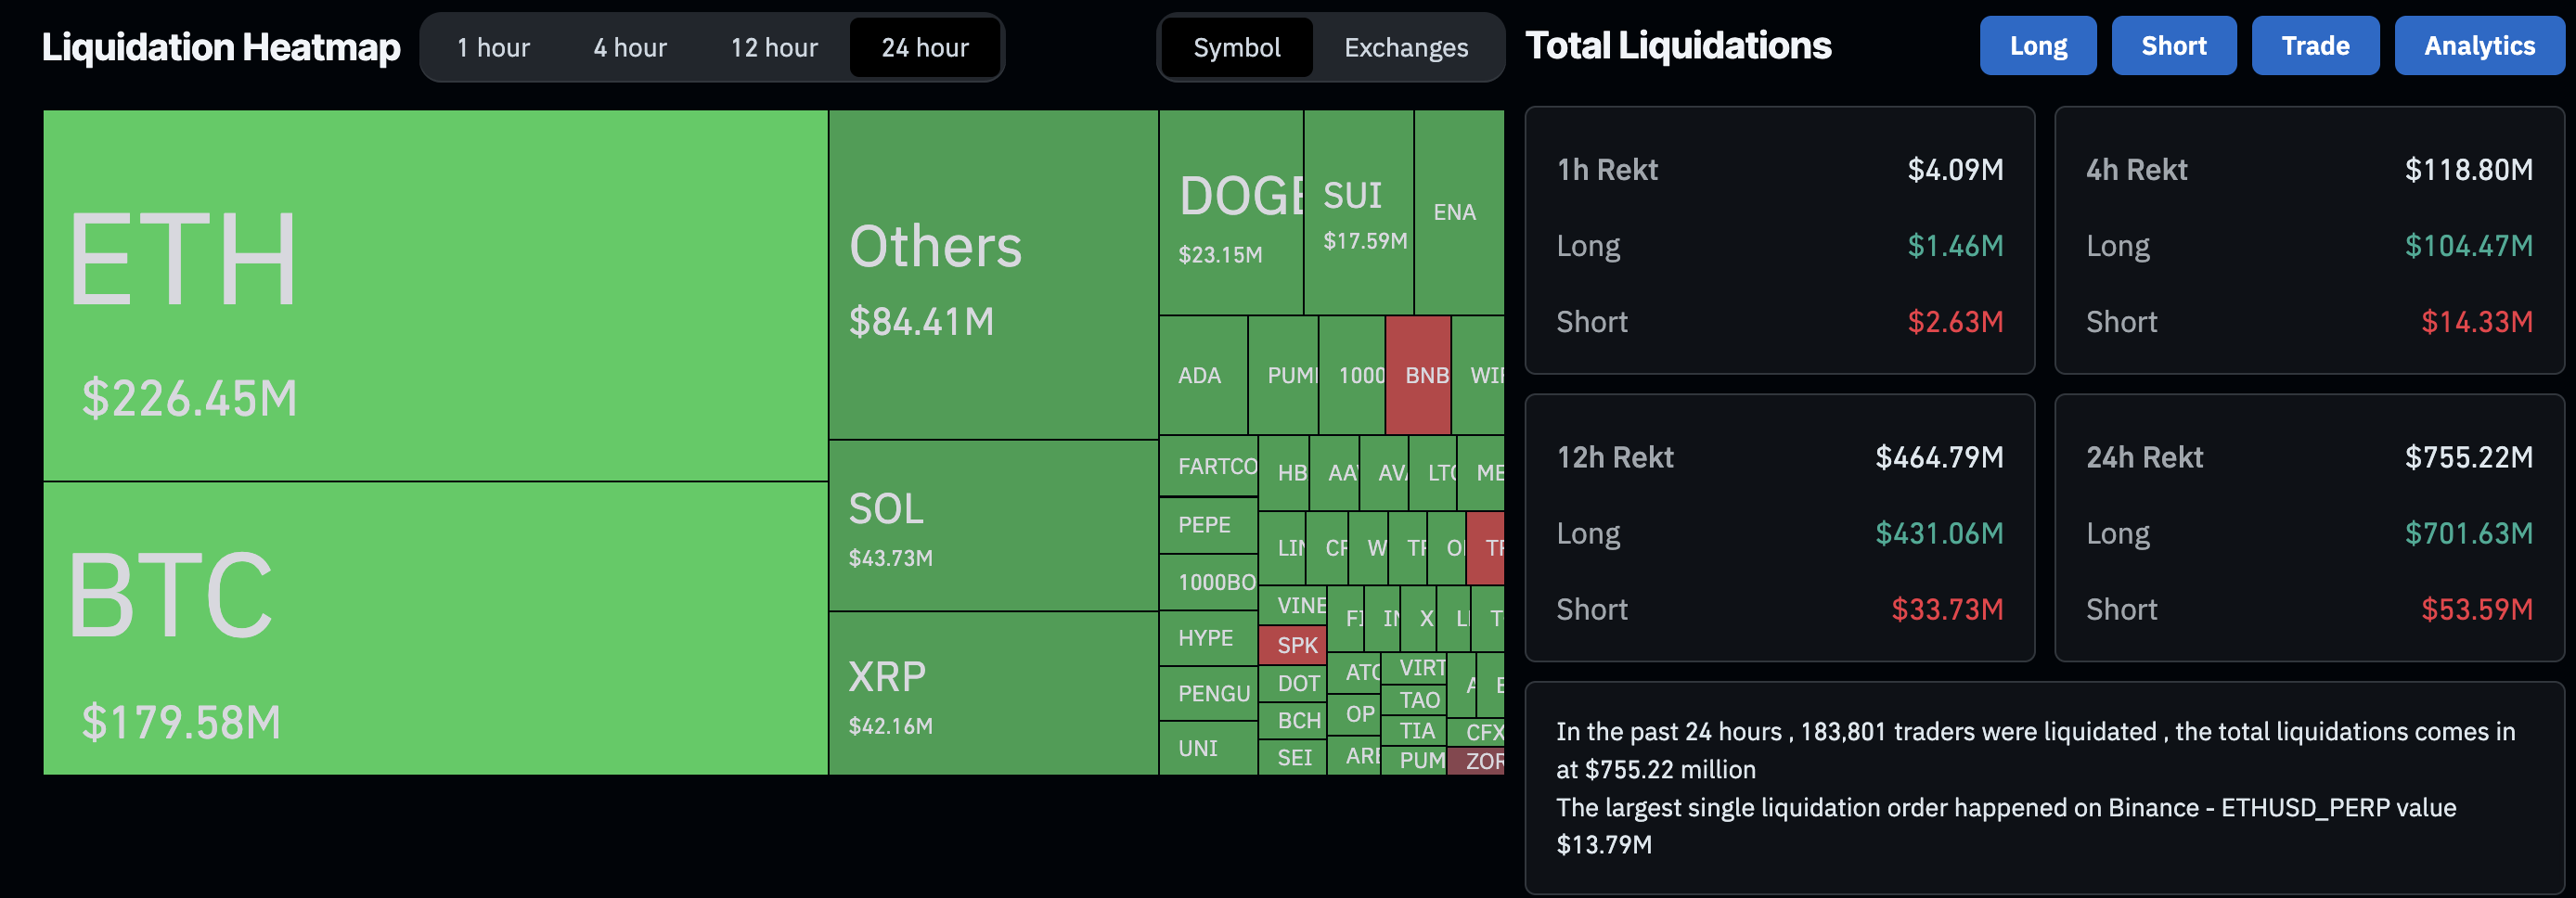
Crypto liquidation heatmap | Source: CoinGlass
Historically, August has been a bearish month, and the current macro headwinds are unlikely to make it better. According to CryptoRank, Bitcoin has not had a bullish August since 2021. Bulls will be looking to change the trend this year, if support above $114,000 holds while attracting speculative demand.
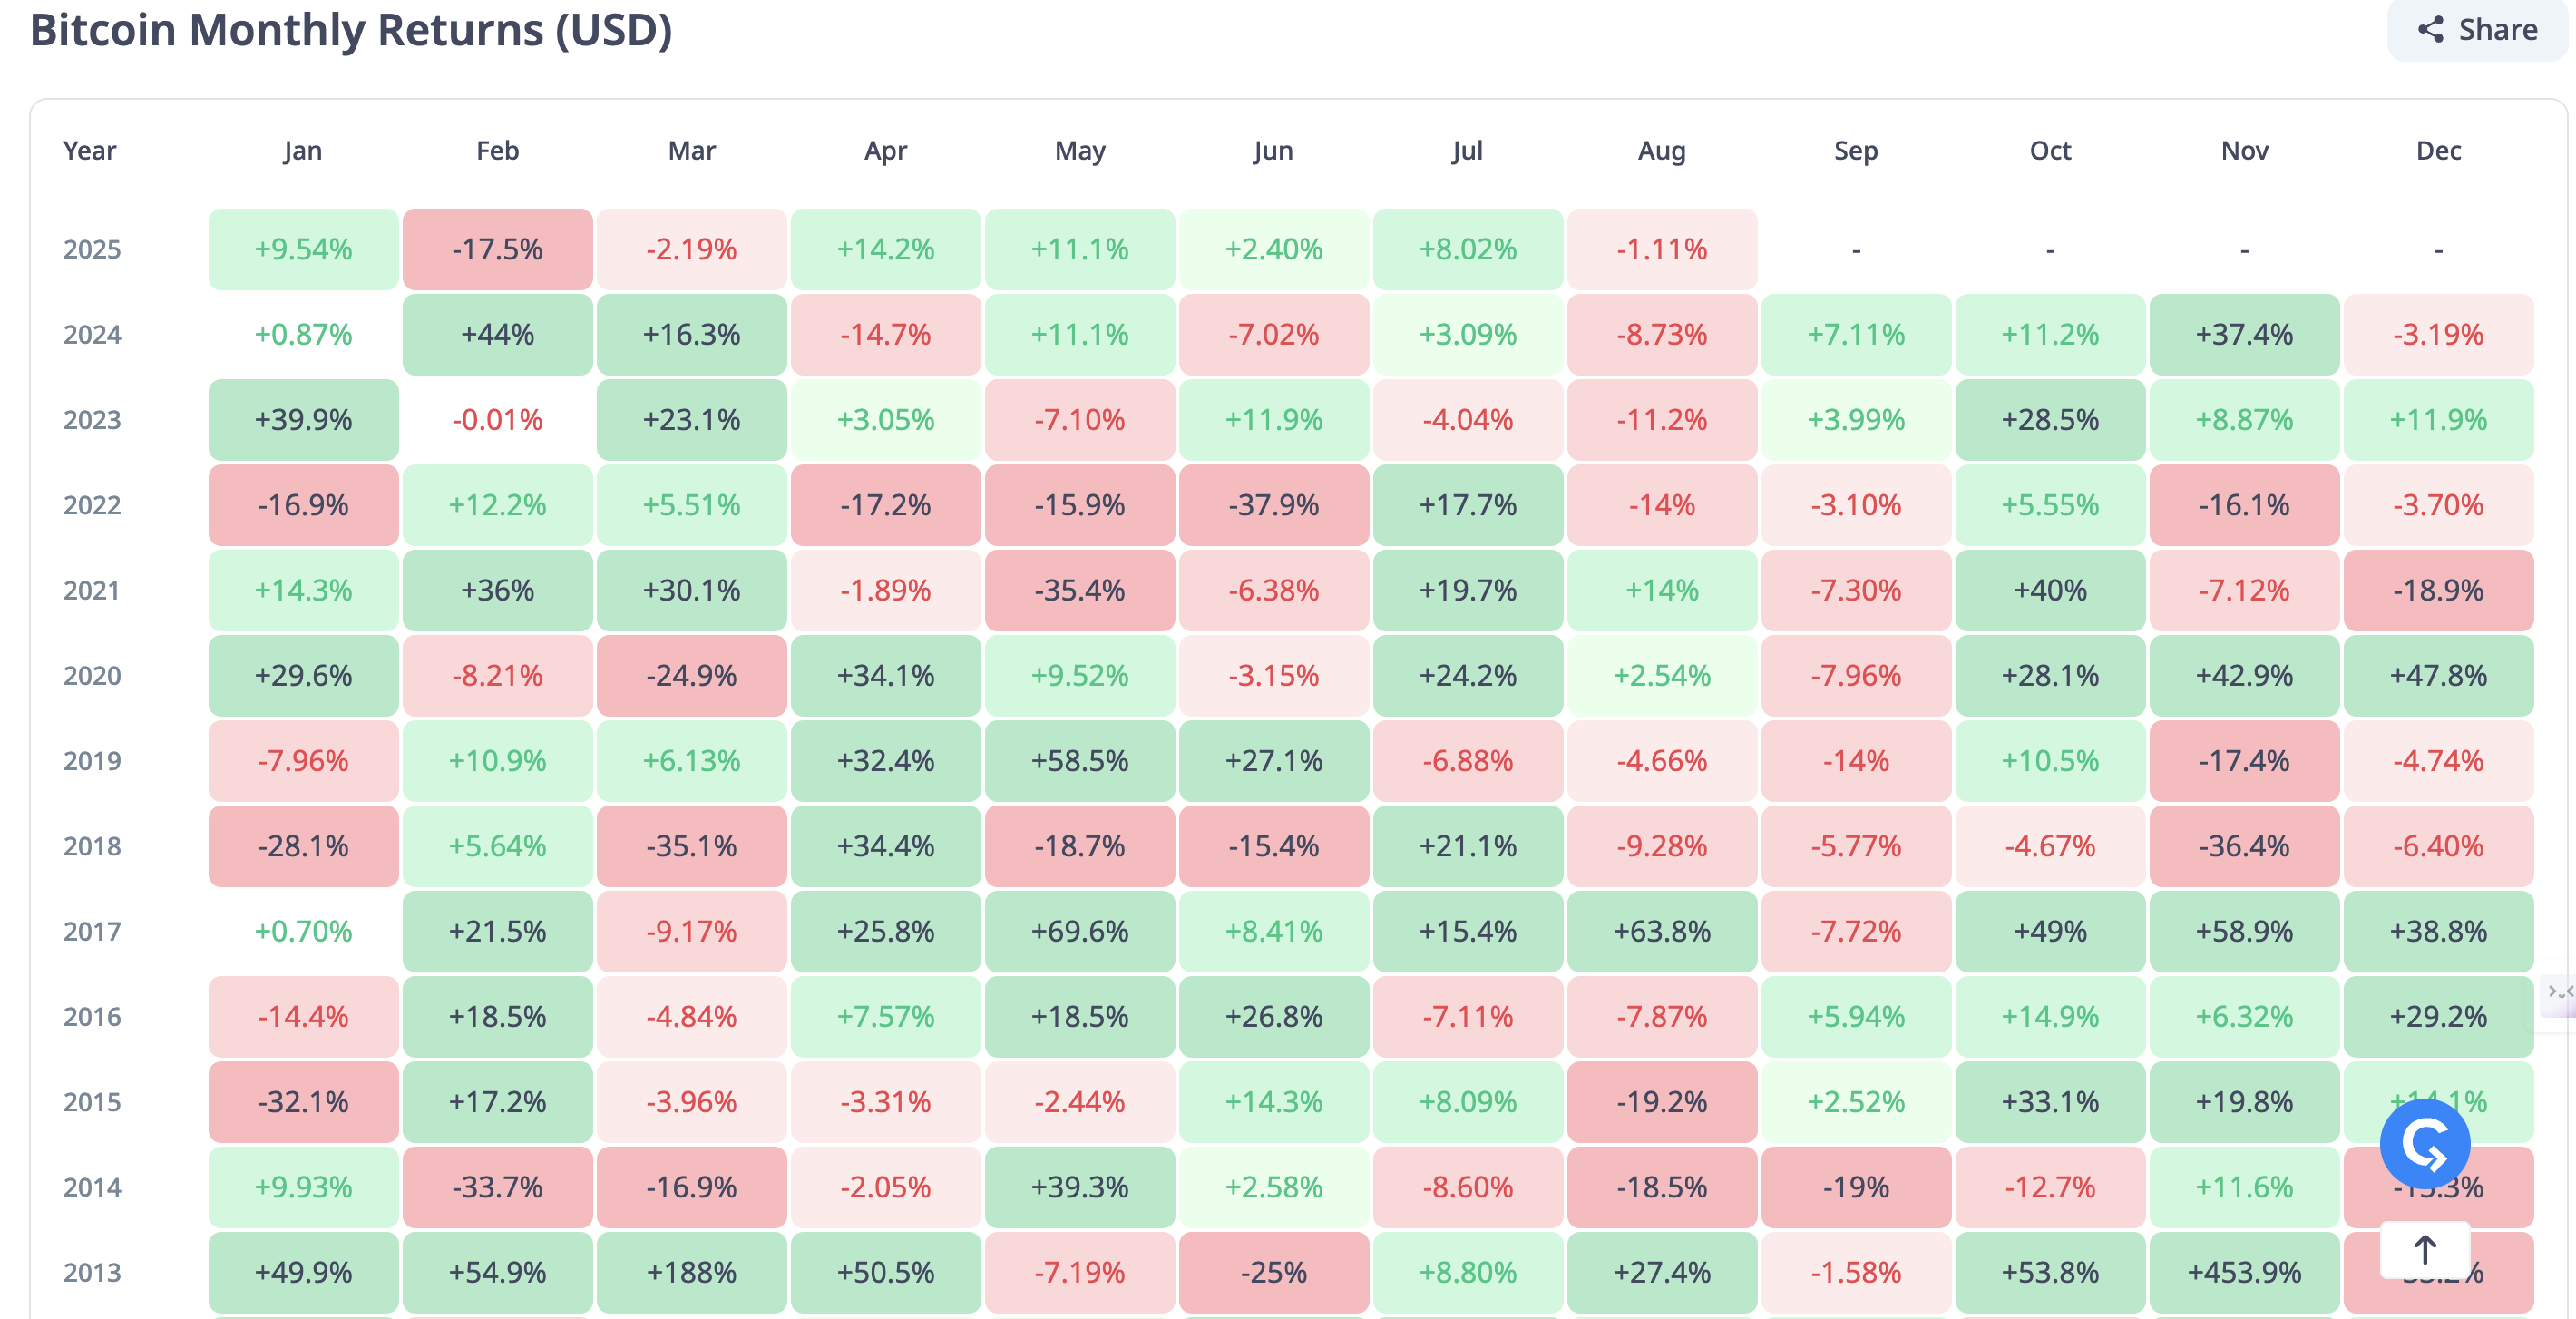
Bitcoin monthly returns | Source: CryptoRank
Ethereum's performance in August has also been dismal, with positive returns dating back to 2021. XRP's performance aligns with the bearish trend observed in August over the last three years.
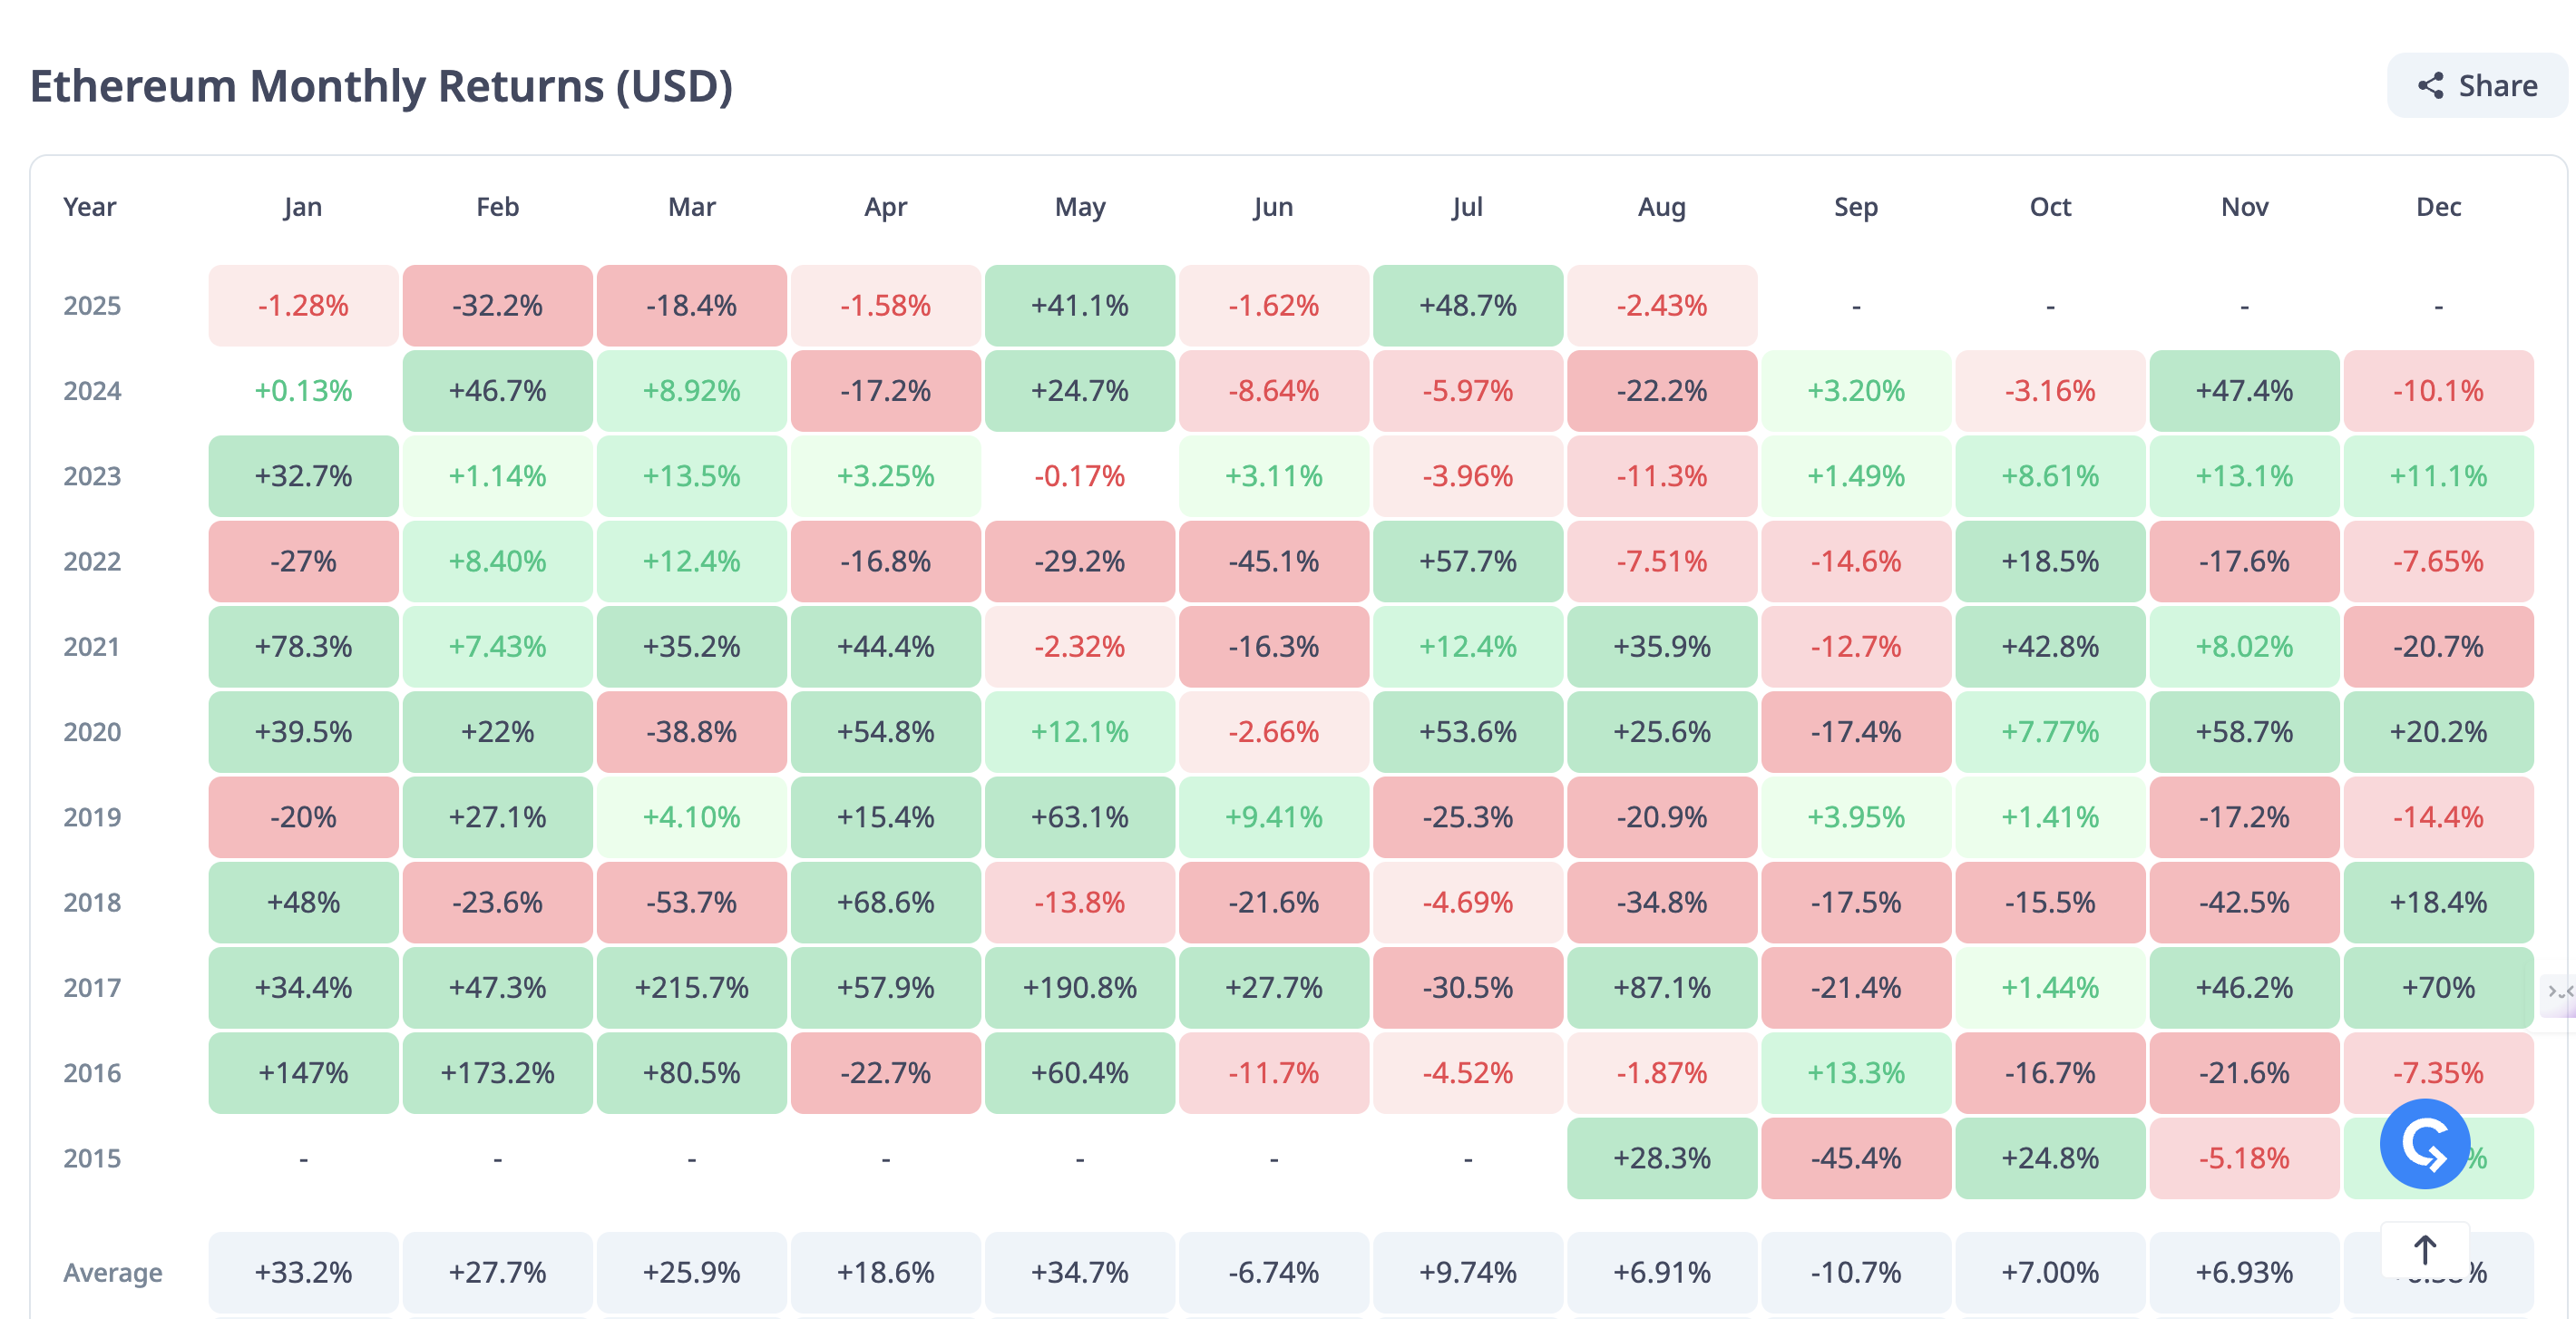
Ethereum monthly returns | Source: CryptoRank
Chart of the day: Bitcoin bears tighten grip
Bitcoin price has extended its decline by 6.6% so far from the record high of $123,128, underpinned by aggressive selling amid concerns about macroeconomic uncertainty. Barely a day after the Fed left interest rates unchanged while taking a hawkish stance, higher tariffs have kept volatility elevated this week.
The technical structure on the daily chart remains largely bearish, as depicted by the Relative Strength Index (RSI) falling below the midline. If investors remain risk-averse in upcoming sessions, demand could shrink further, leaving BTC price susceptible to extend losses toward the next key support level at $112,000.
The Moving Average Convergence Divergence (MACD) indicator sustains a sell signal while descending. This bearish outlook could keep recovery subdued as investors focus on reducing exposure.
Traders will also monitor for a potential rebound if Bitcoin reclaims the immediate $115,000 support. Other key areas of interest are the 50-day Exponential Moving Average (EMA) at $112,928 and the stubborn resistance in the range of $119,000 to $120,000.
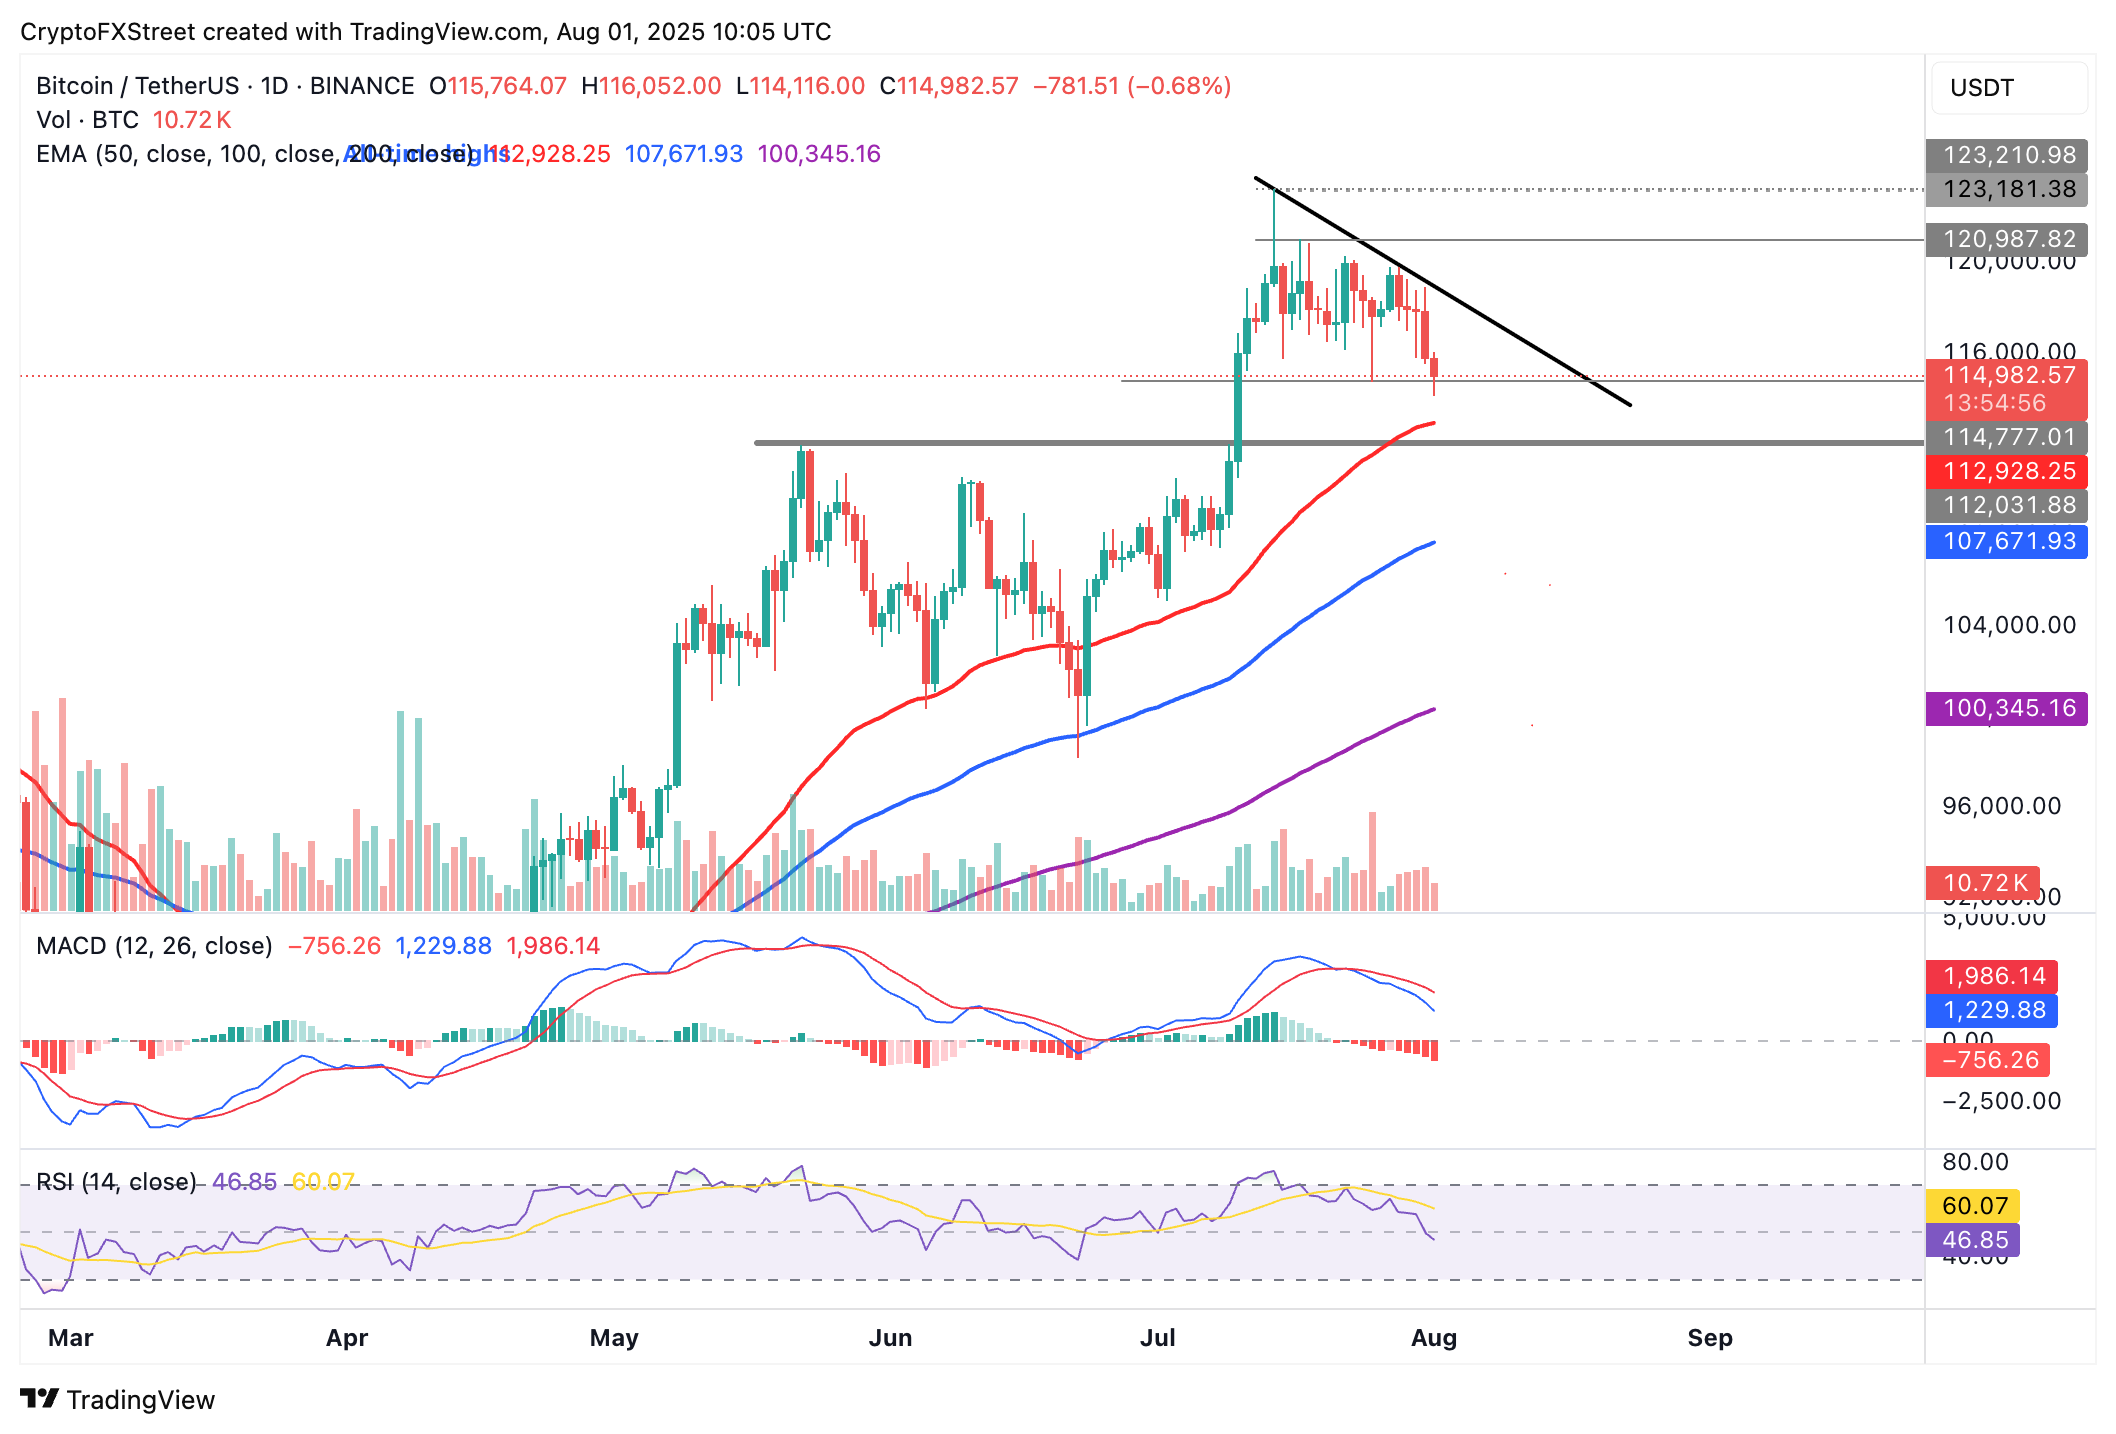
BTC/USDT daily chart
Altcoins update: Ethereum, XRP decline persists
Ethereum's price has declined by over 7% from its recent high to trade at $3,630 as of Friday's writing. The largest smart contract token reached a July peak of $3,941 before trimming some of the gains, and falling short of bullish expectations to break the key resistance at $4,000.
A MACD indicator sell signal alongside a downward-trending RSI underscores the prevalent bearish forces. If investors continue de-risking, the price of ETH could accelerate toward support at $3,500, which was tested on July 24. Other key levels of interest for traders would be the 50-day EMA, currently at $3,135 and the 100-day EMA at $2,827.
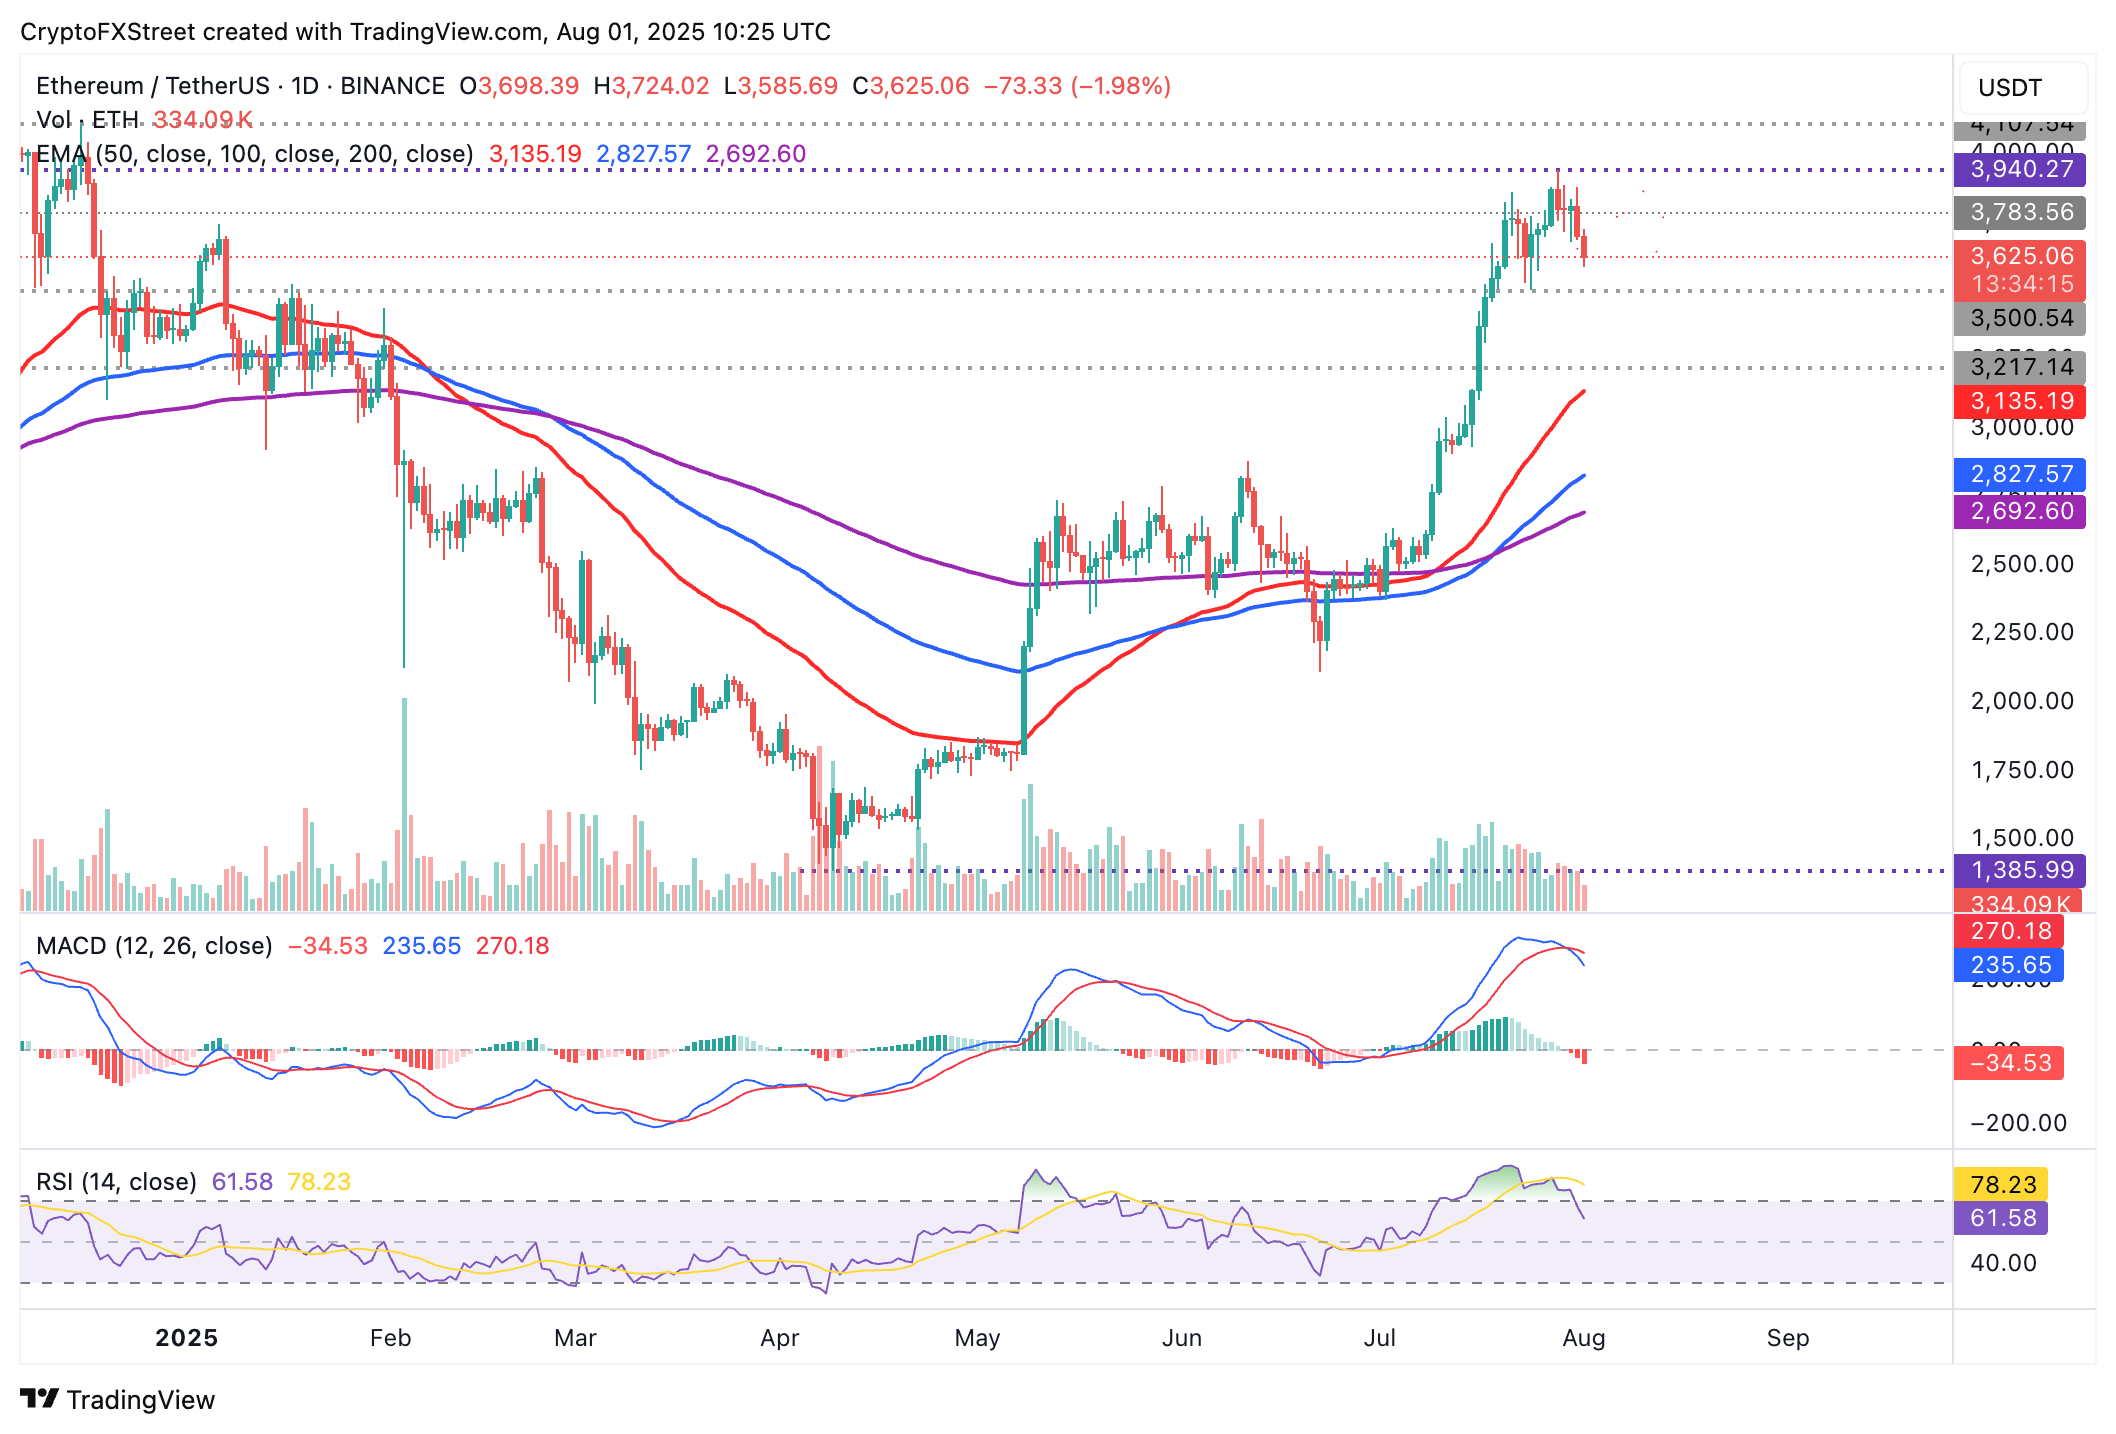
ETH/USDT daily chart
As for XRP, bulls are fighting to reverse the trend upward and reclaim support at $3.00. However, its technical picture depicts a bearish bias, backed by a sell signal from the MACD indicator, descending toward the mean line, and the RSI, which holds slightly below the midline.
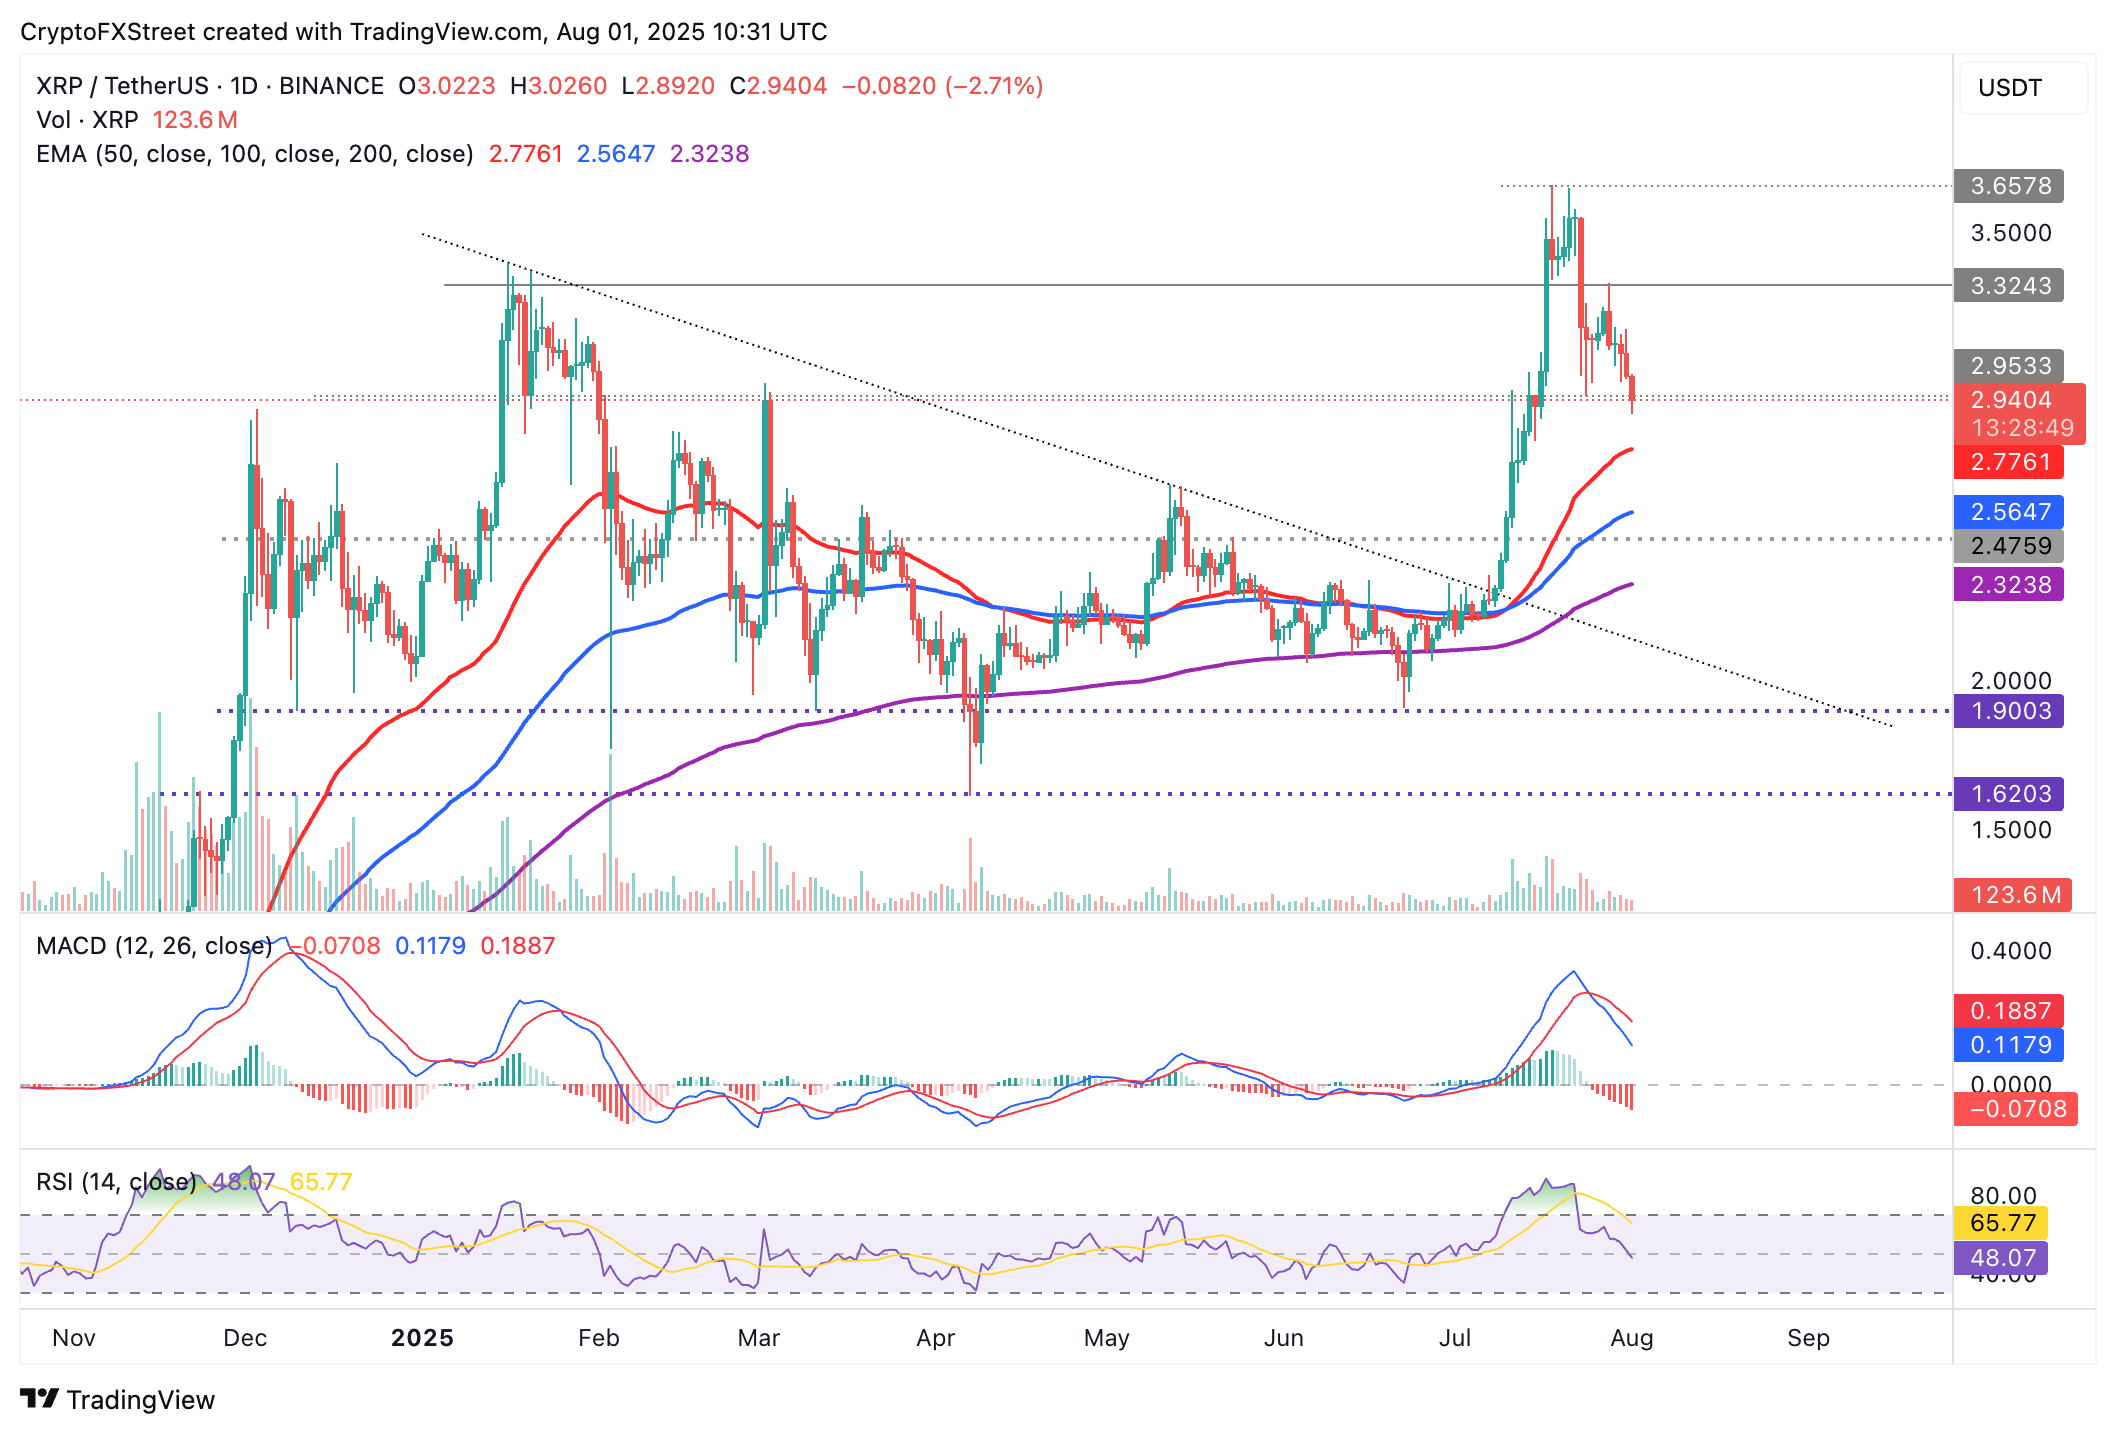
XRP/USDT daily chart
If the downtrend persists, the 50-day EMA, currently at $2.77 and the 100-day EMA at $2.56 could serve as tentative support levels to absorb the selling pressure. A potential rebound above $3.00 could reinforce the bullish outlook and set XRP price on the path to its record high.
Bitcoin, altcoins, stablecoins FAQs
Bitcoin is the largest cryptocurrency by market capitalization, a virtual currency designed to serve as money. This form of payment cannot be controlled by any one person, group, or entity, which eliminates the need for third-party participation during financial transactions.
Altcoins are any cryptocurrency apart from Bitcoin, but some also regard Ethereum as a non-altcoin because it is from these two cryptocurrencies that forking happens. If this is true, then Litecoin is the first altcoin, forked from the Bitcoin protocol and, therefore, an “improved” version of it.
Stablecoins are cryptocurrencies designed to have a stable price, with their value backed by a reserve of the asset it represents. To achieve this, the value of any one stablecoin is pegged to a commodity or financial instrument, such as the US Dollar (USD), with its supply regulated by an algorithm or demand. The main goal of stablecoins is to provide an on/off-ramp for investors willing to trade and invest in cryptocurrencies. Stablecoins also allow investors to store value since cryptocurrencies, in general, are subject to volatility.
Bitcoin dominance is the ratio of Bitcoin's market capitalization to the total market capitalization of all cryptocurrencies combined. It provides a clear picture of Bitcoin’s interest among investors. A high BTC dominance typically happens before and during a bull run, in which investors resort to investing in relatively stable and high market capitalization cryptocurrency like Bitcoin. A drop in BTC dominance usually means that investors are moving their capital and/or profits to altcoins in a quest for higher returns, which usually triggers an explosion of altcoin rallies.

FXStreet
100만 명이 넘는 사용자가 FXStreet를 통해 실시간 시장 데이터, 차트 도구, 전문가 인사이트, 포렉스 뉴스를 이용합니다. 포괄적인 경제 캘린더와 교육 웨비나는 트레이더가 정보를 유지하고 신중한 결정을 내리도록 돕습니다. FXStreet는 바르셀로나 본사와 전 세계 지역에 걸쳐 약 60명의 팀으로 구성되어 있습니다.
Read More


