
Trade The World
Dog-themed meme coins DOGE and SHIB extend gains as bearish pressure eases
작성자 Manish Chhetri
게시일: 2 Oct 2025 | 수정일: 2 Oct 2025


POPULAR ARTICLES

Dogecoin (DOGE) and Shiba Inu (SHIB) prices extend their gains on Thursday, after rallying over 7% and 5% so far this week. Both dog-themed meme coins signal fading bearish pressure on the momentum indicators and open the door for a continued rally in both meme coins.
- Dogecoin price extends its gains on Thursday, rallying over 7% so far this week.
- Shiba Inu trades in the green on Thursday after retesting the key support earlier this week.
- Momentum indicators for both meme coins suggest fading bearish pressure, supporting prospects of continued rally.
Dogecoin (DOGE) and Shiba Inu (SHIB) prices extend their gains on Thursday, after rallying over 7% and 5% so far this week. Both dog-themed meme coins signal fading bearish pressure on the momentum indicators and open the door for a continued rally in both meme coins.
Dogecoin holders buy dips, bullish bets on the rise
Santiment’s Supply Distribution data supports a bullish outlook for Dogecoin, as certain wallet holders accumulated DOGE during recent price dips.
The metric indicates that whales holding between 100,000 and 1 million DOGE tokens (red line) and those with 10 to 100 million (blue line) have accumulated 450 million tokens from September 19 to Thursday. During the same period, wallets holding between 1 and 10 million DOGE tokens (yellow line) have shed 300 million tokens.
This shows that the second cohort of whales could have fallen prey to the capitulation event. In contrast, the first set of wallets seized the opportunity and accumulated Dogecoin at a discount.
 [09-1759382214968-1759382214970.37.52, 02 Oct, 2025].png)
Dogecoin supply distribution chart. Source: Santiment
Dogecoin’s Coinglass long-to-short ratio reads 1.05 on Thursday, nearing the highest monthly level. This ratio, above one, reflects bullish sentiment in the markets, as more traders are betting on the DOGE price to rise.
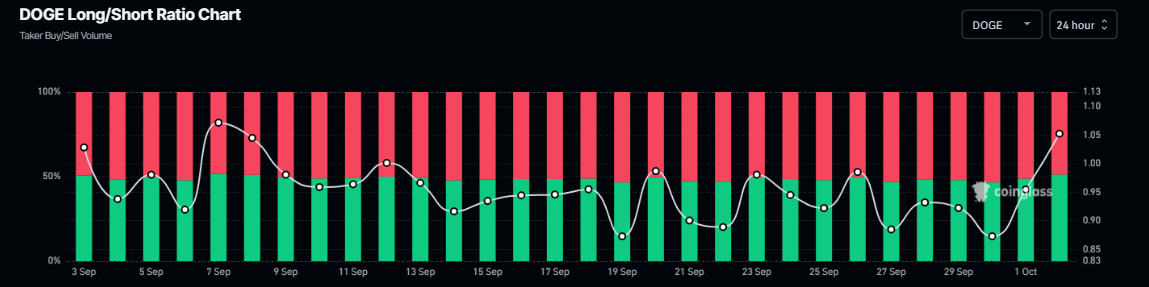
Dogecoin long-to-short ratio chart. Source: Coinglass
Dogecoin Price Forecast: Momentum indicators show fading bearish pressure
Dogecoin price found support around the 200-day Exponential Moving Average (EMA) at $0.220 on September 25 and rose 11.73% by Wednesday. This 200-day EMA roughly coincides with the 50% Fibonacci retracement level at $0.225, making this a key support zone. At the time of writing on Thursday, it continues to trade at a higher level at $0.252.
If DOGE continues its upward trend and closes above the daily resistance level at $0.256 on a daily basis, it could extend the rally toward the next daily resistance at $0.311.
The Relative Strength Index (RSI) on the daily chart reads 54, which is above the neutral level of 50, indicating that bullish momentum is gaining traction. Moreover, the Moving Average Convergence Divergence (MACD) lines are also about to flip to a bullish crossover, while the falling red histogram bars also indicate the fading of bearish momentum.
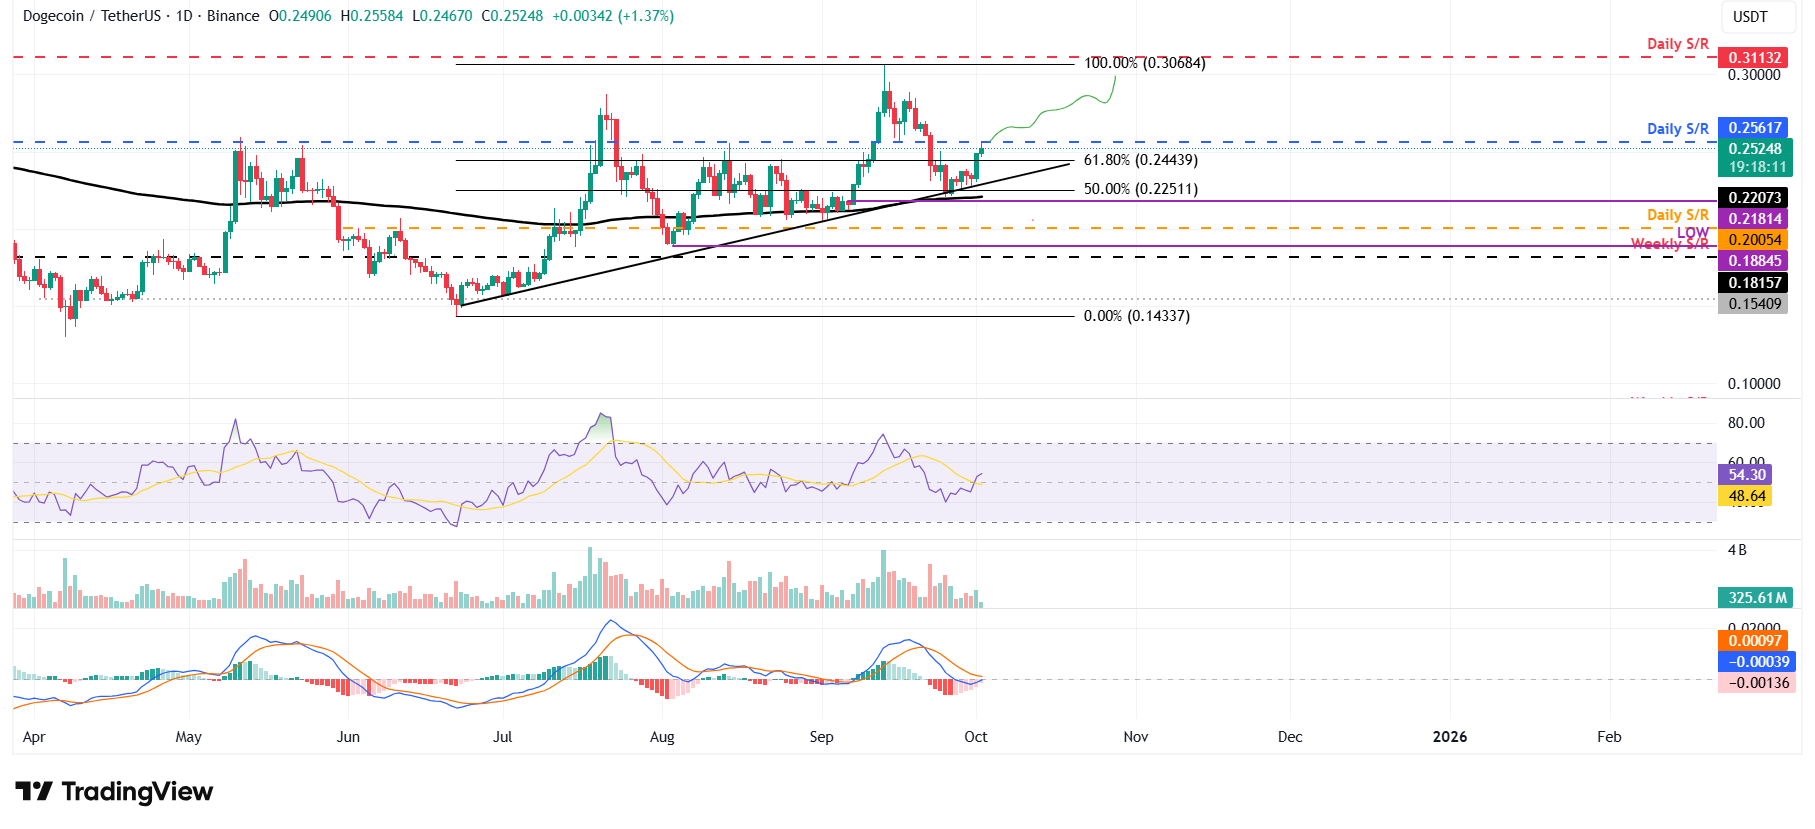
DOGE/USDT daily chart
However, if DOGE faces a correction, it could extend the decline to retest its 200-day EMA at $0.220.
Shiba Inu derivatives show bullish bias
CoinGlass’s OI-Weighted Funding Rate data for SHIB shows that the number of traders betting that the price of SHIB meme coin will slide further is lower than that anticipating a price increase. Generally, a positive rate (longs pay shorts) indicates bullish sentiment, while negative numbers (shorts pay longs) indicate bearishness.
The metric flipped to a positive rate on Wednesday and reads 0.0102% on Thursday, indicating that longs are paying shorts. Generally, as shown in the chart below, when funding rates have flipped from negative to positive and have remained positive, the SHIB price has rallied sharply.
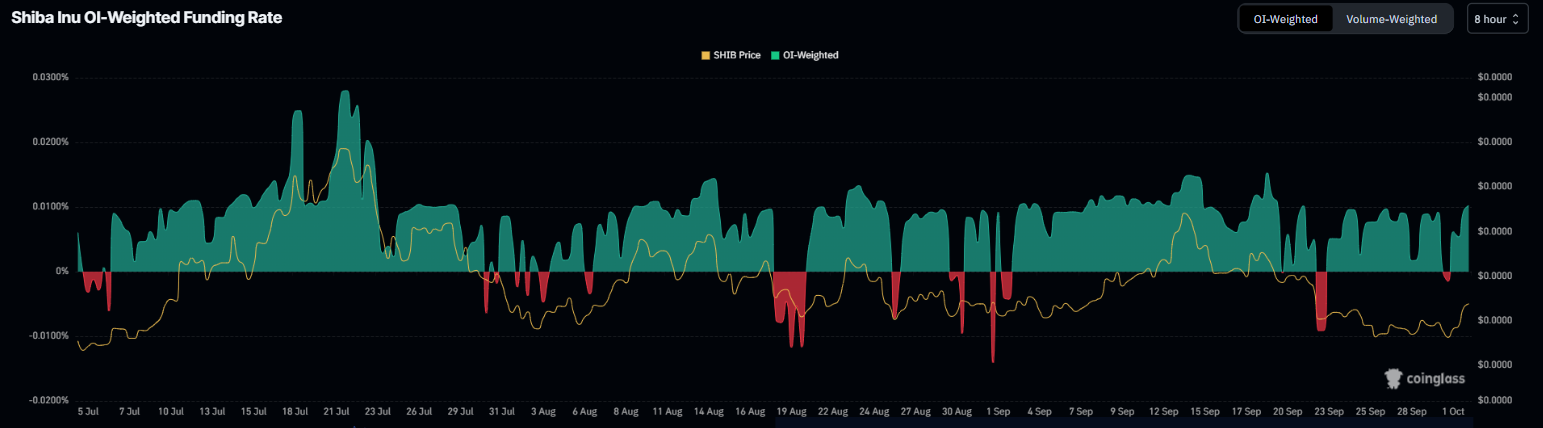
SHIB funding rate chart. Source: CoinGlass
Moreover, Coinglass' long-to-short ratio reads 1.20 on Thursday, the highest level in over a month. This ratio, above one, reflects bullish sentiment in the markets, as more traders are betting on the SHIB price to rise.
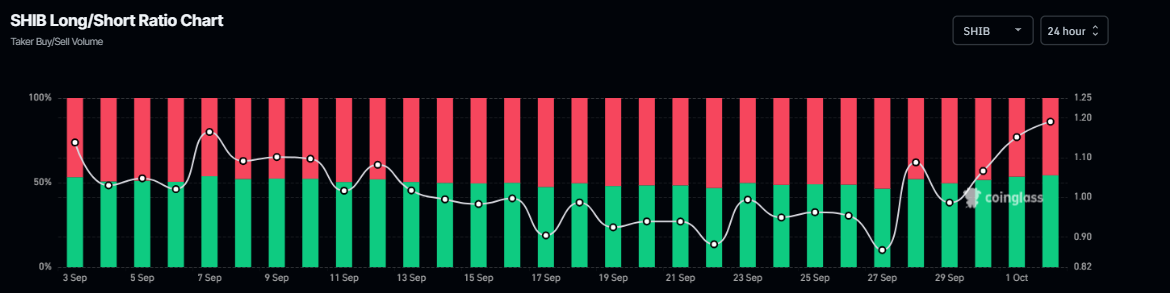
SHIB long-to-short ratio chart. Source: Coinglass
Shiba Inu Price Forecast: SHIB finds support around a key level
Shiba Inu price found support around the daily level of $0.0000115 on Tuesday and rose nearly 5% the next day. At the time of writing on Thursday, it continues to trade at a higher level, around $0.0000125.
If SHIB continues its upward momentum, it could extend the rally toward the 200-day EMA at $0.0000136.
The RSI on the daily chart rose above the neutral level of 50 on Thursday, indicating a fading of bearish momentum. Moreover, the MACD lines are also about to flip to a bullish crossover, while the falling red histogram bars also indicate the fading of bearish momentum.
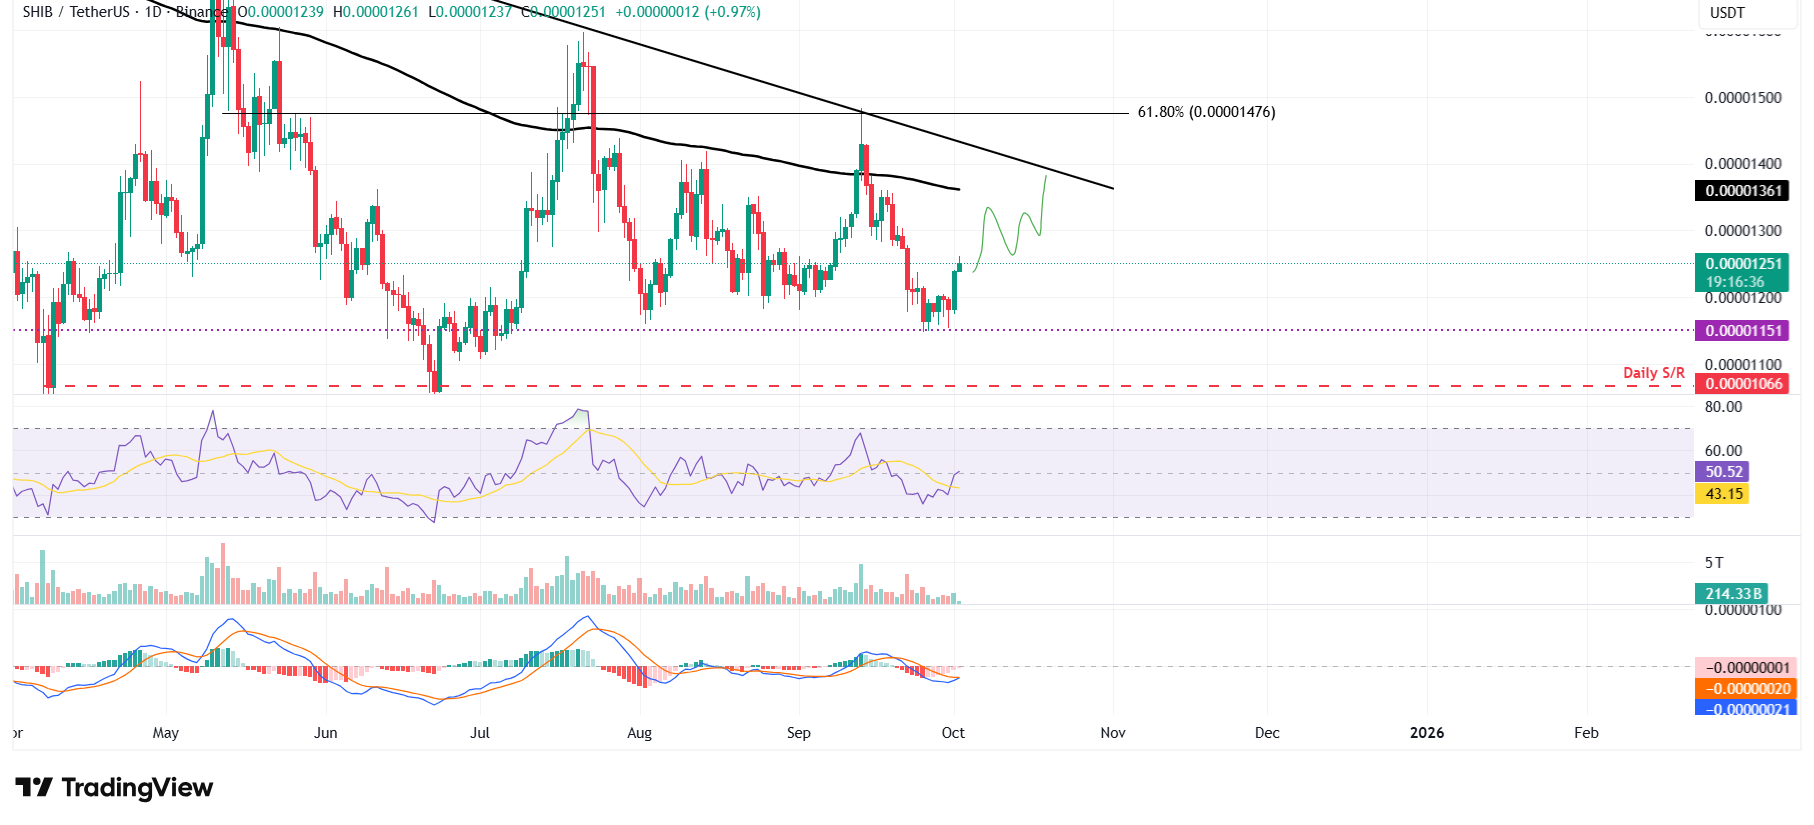
SHIB/USDT daily chart
However, if SHIB faces a correction, it could extend the decline to retest its daily support at $0.0000115.

FXStreet
100만 명이 넘는 사용자가 FXStreet를 통해 실시간 시장 데이터, 차트 도구, 전문가 인사이트, 포렉스 뉴스를 이용합니다. 포괄적인 경제 캘린더와 교육 웨비나는 트레이더가 정보를 유지하고 신중한 결정을 내리도록 돕습니다. FXStreet는 바르셀로나 본사와 전 세계 지역에 걸쳐 약 60명의 팀으로 구성되어 있습니다.
Read More


