
Trade The World
Dow Jones Industrial Average struggles as equities buckle under new tariff threats
작성자 Joshua Gibson
게시일: 12 Jul 2025 | 수정일: 12 Jul 2025


POPULAR ARTICLES

losing
losing
- The Dow Jones fell back into the weekly red zone on Friday.
- President Trump has stepped up fresh tariff threats, targeting Canadian goods with new import fees.
- Investor sentiment remains hobbled in a constantly changing trade policy environment.
The Dow Jones Industrial Average (DJIA) snapped a two-day recovery on Friday, testing below the 44,400 level once again as equities grapple with a new reality where trade tariffs exist in a quantum state, prone to popping in and out of existence at a moment’s notice. President Donald Trump has been busy this week, laying out a raft of new tariff threats against a slew of countries after again suspending “reciprocal” tariffs that were announced in April.
President Trump is piling on additional double-digit tariffs on key trading allies of the US, including South Korea, Japan, and now Canada, as well as threatening a 50% tariff on all copper imports into the US. The new round of tariff threats are slated to come into effect on August 1 unless countries successfully negotiate acceptable trade deals with the Trump administration, the same day that Trump’s “reciprocal” tariffs announced in early April are set to come into effect. The Liberation Day tariff announcements were quickly suspended for 90 days, which were then extended to August 1 in the runup to the July 9 deadline.
Equity markets ended on the back foot despite testing new highs through the midweek. Investors are gearing up for the start of the Q2 earnings season, as well as a fresh round of US Consumer Price Index (CPI) inflation figures due next Tuesday. Headline CPI inflation data is expected to tick upwards in June, which will make it harder for the Federal Reserve (Fed) to step into a new rate-cutting cycle, much to the dismay of President Trump and some Fed policymakers who have been tilting toward summer rate cuts in an effort to make themselves more appealing as potential picks to replace Fed Chair Jerome Powell when the Fed head’s term ends next year.
Dow Jones price forecast
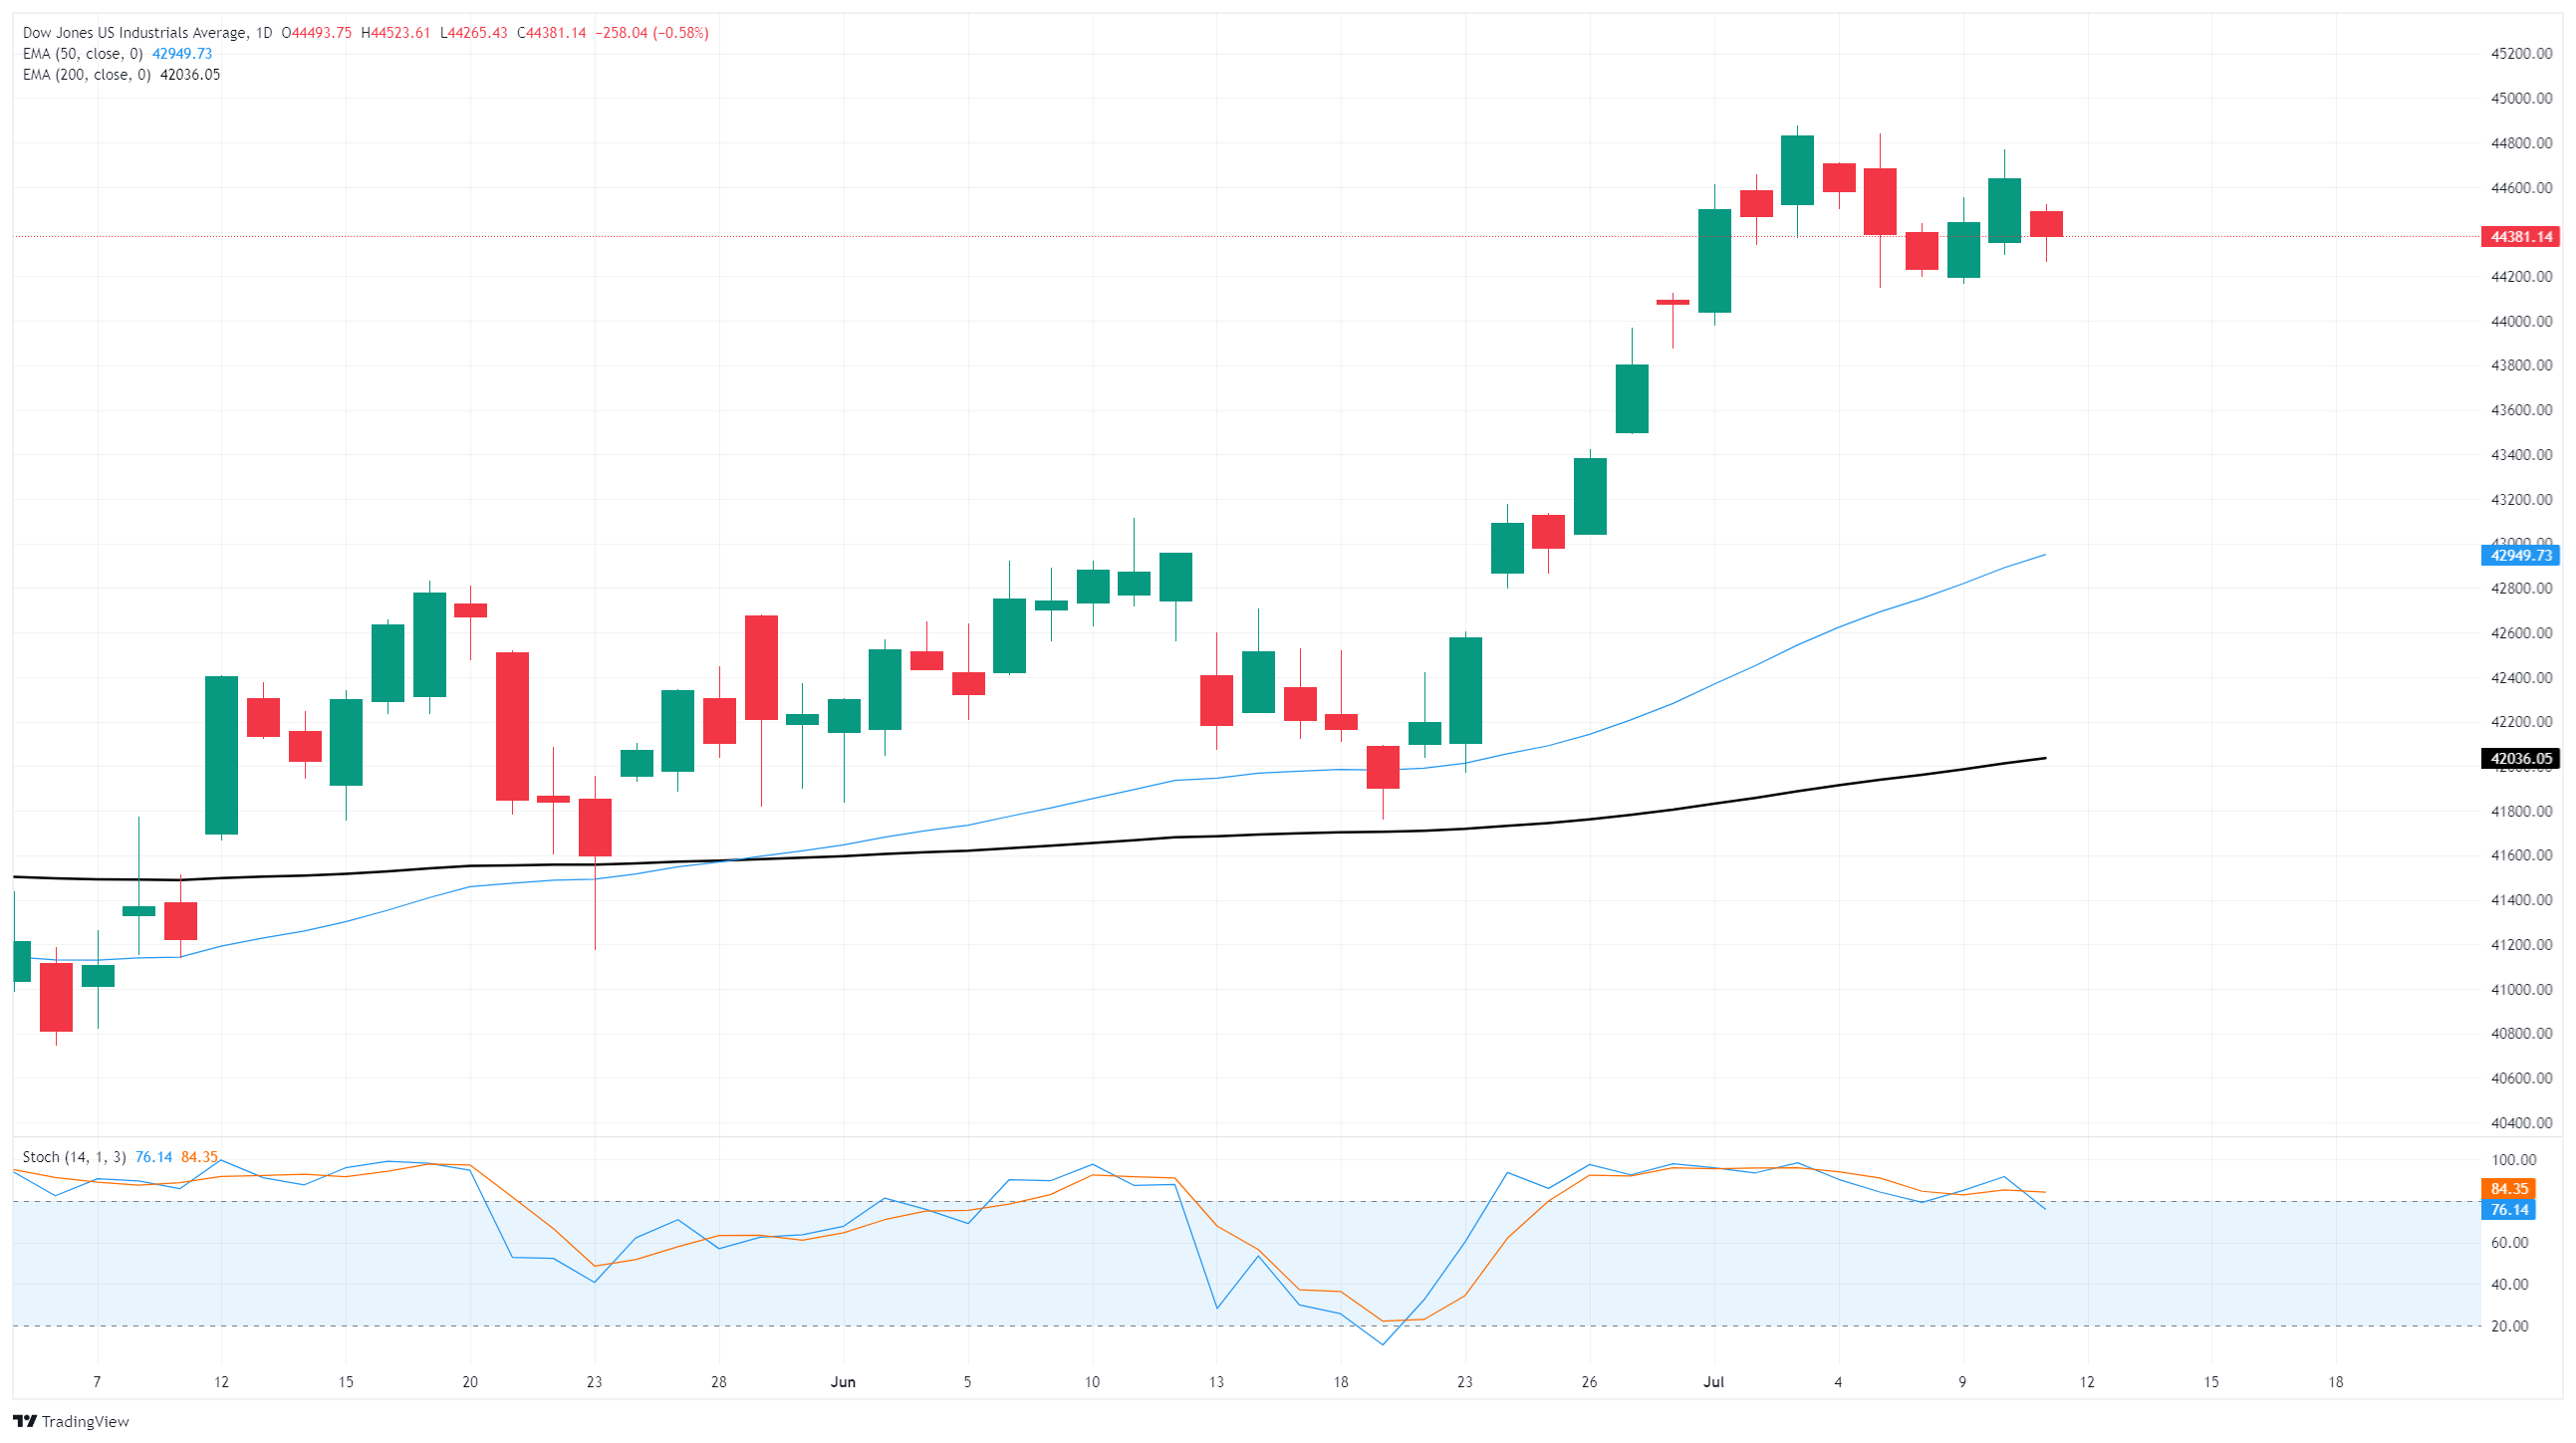
The Dow Jones remains capped below the 45,000 major price handle, and a near-term pivot into fresh bullish momentum ran aground of geopolitical rocks this week, keeping intraday bids hobbled in the 44,400 region. Despite losing some footing this week, the Dow remains firmly buried in bull country, trading well north of the 200-day Exponential Moving Average (EMA) near 42,330.
Dow Jones daily chart
Economic Indicator
Consumer Price Index (YoY)
Inflationary or deflationary tendencies are measured by periodically summing the prices of a basket of representative goods and services and presenting the data as The Consumer Price Index (CPI). CPI data is compiled on a monthly basis and released by the US Department of Labor Statistics. The YoY reading compares the prices of goods in the reference month to the same month a year earlier.The CPI is a key indicator to measure inflation and changes in purchasing trends. Generally speaking, a high reading is seen as bullish for the US Dollar (USD), while a low reading is seen as bearish.
Read more.Next release: Tue Jul 15, 2025 12:30
Frequency: Monthly
Consensus: 2.6%
Previous: 2.4%
Source: US Bureau of Labor Statistics
The US Federal Reserve (Fed) has a dual mandate of maintaining price stability and maximum employment. According to such mandate, inflation should be at around 2% YoY and has become the weakest pillar of the central bank’s directive ever since the world suffered a pandemic, which extends to these days. Price pressures keep rising amid supply-chain issues and bottlenecks, with the Consumer Price Index (CPI) hanging at multi-decade highs. The Fed has already taken measures to tame inflation and is expected to maintain an aggressive stance in the foreseeable future.

FXStreet
100만 명이 넘는 사용자가 FXStreet를 통해 실시간 시장 데이터, 차트 도구, 전문가 인사이트, 포렉스 뉴스를 이용합니다. 포괄적인 경제 캘린더와 교육 웨비나는 트레이더가 정보를 유지하고 신중한 결정을 내리도록 돕습니다. FXStreet는 바르셀로나 본사와 전 세계 지역에 걸쳐 약 60명의 팀으로 구성되어 있습니다.
Read More


