
Trade The World
EUR/JPY Price Forecast: Rises above 173.00 due to prevailing bullish bias
작성자 Akhtar Faruqui
게시일: 3 Sep 2025 | 수정일: 3 Sep 2025


POPULAR ARTICLES

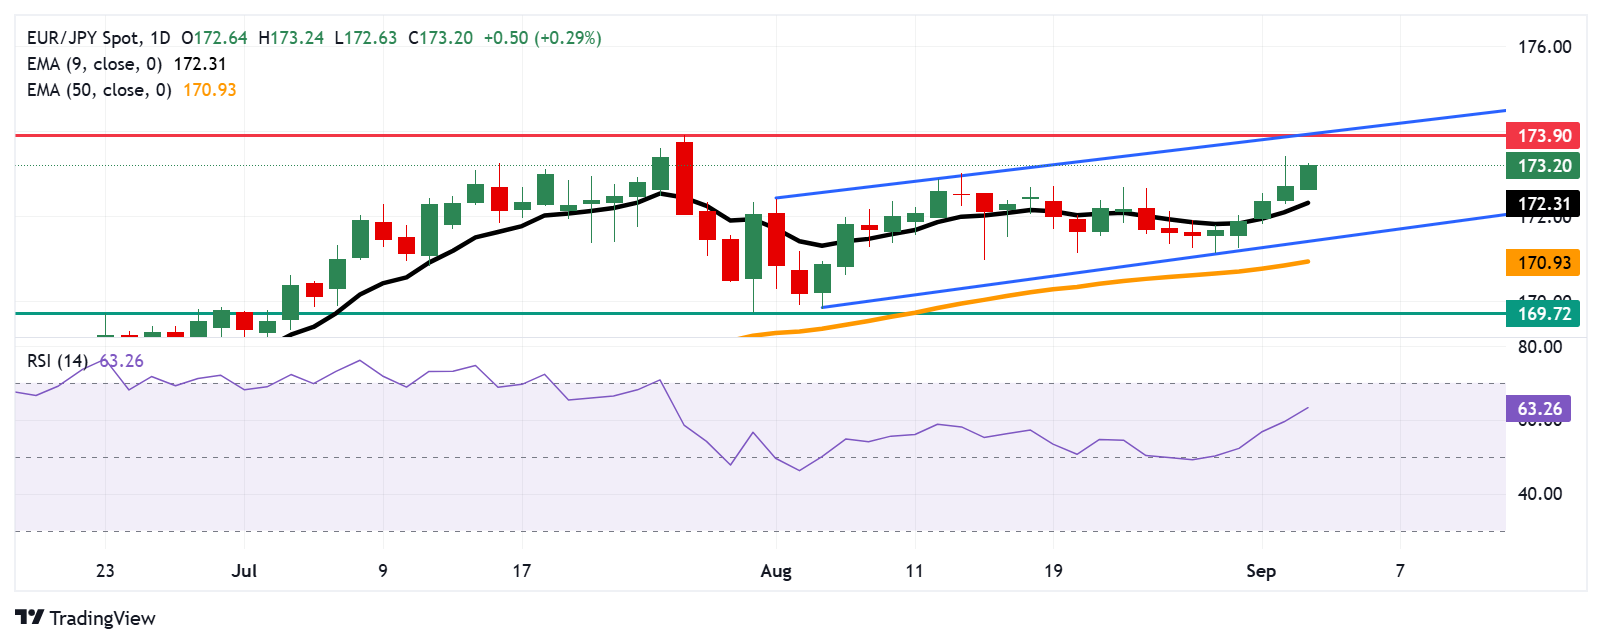
EUR/JPY continues its winning streak for the fifth successive session, trading around 173.20 during the European hours on Wednesday. The technical analysis of the daily chart suggests the prevailing bullish market bias as the currency cross is remaining within the ascending channel pattern.
- EUR/JPY may find its primary barrier at 173.90, the highest since July 2024.
- Bullish bias strengthens as the 14-day Relative Strength Index remains above the 50 mark.
- The initial support lies at nine-day EMA of 172.31.
EUR/JPY continues its winning streak for the fifth successive session, trading around 173.20 during the European hours on Wednesday. The technical analysis of the daily chart suggests the prevailing bullish market bias as the currency cross is remaining within the ascending channel pattern.
The 14-day Relative Strength Index (RSI) is positioned above the 50 mark, strengthening the bullish bias. Additionally, the short-term price momentum is stronger as the EUR/JPY cross remains above the nine-day Exponential Moving Average (EMA).
On the upside, the EUR/JPY cross may approach the 173.90, the highest since July 2024, recorded on July 28, 2025, aligned with the upper boundary of the ascending channel around the psychological level of 174.00.
The EUR/JPY cross may find its primary support at the nine-day EMA of 172.31. A break below this level could weaken the short-term price momentum and prompt the currency cross to test the ascending channel’s lower boundary around 171.40, followed by the 50-day EMA of 170.93.
Further declines below the confluence support zone would weaken the medium-term price momentum and put downward pressure on the EUR/JPY cross to navigate the region around the nine-week low at 169.72, which was recorded on July 31.
EUR/JPY: Daily Chart
Euro Price Today
The table below shows the percentage change of Euro (EUR) against listed major currencies today. Euro was the strongest against the Japanese Yen.
| USD | EUR | GBP | JPY | CAD | AUD | NZD | CHF | |
|---|---|---|---|---|---|---|---|---|
| USD | -0.08% | 0.06% | 0.24% | 0.12% | -0.06% | 0.06% | 0.00% | |
| EUR | 0.08% | 0.13% | 0.31% | 0.21% | -0.11% | 0.12% | 0.07% | |
| GBP | -0.06% | -0.13% | 0.16% | 0.06% | -0.24% | 0.00% | -0.06% | |
| JPY | -0.24% | -0.31% | -0.16% | -0.14% | -0.39% | -0.28% | -0.23% | |
| CAD | -0.12% | -0.21% | -0.06% | 0.14% | -0.26% | -0.06% | -0.12% | |
| AUD | 0.06% | 0.11% | 0.24% | 0.39% | 0.26% | 0.07% | 0.18% | |
| NZD | -0.06% | -0.12% | -0.00% | 0.28% | 0.06% | -0.07% | -0.06% | |
| CHF | -0.00% | -0.07% | 0.06% | 0.23% | 0.12% | -0.18% | 0.06% |
The heat map shows percentage changes of major currencies against each other. The base currency is picked from the left column, while the quote currency is picked from the top row. For example, if you pick the Euro from the left column and move along the horizontal line to the US Dollar, the percentage change displayed in the box will represent EUR (base)/USD (quote).

FXStreet
100만 명이 넘는 사용자가 FXStreet를 통해 실시간 시장 데이터, 차트 도구, 전문가 인사이트, 포렉스 뉴스를 이용합니다. 포괄적인 경제 캘린더와 교육 웨비나는 트레이더가 정보를 유지하고 신중한 결정을 내리도록 돕습니다. FXStreet는 바르셀로나 본사와 전 세계 지역에 걸쳐 약 60명의 팀으로 구성되어 있습니다.
Read More


