
Trade The World
GBP/JPY Price Forecast: Breaks above 203.00 as bulls eye 204.25
작성자 Christian Borjon Valencia
게시일: 11 Nov 2025 | 수정일: 11 Nov 2025


POPULAR ARTICLES

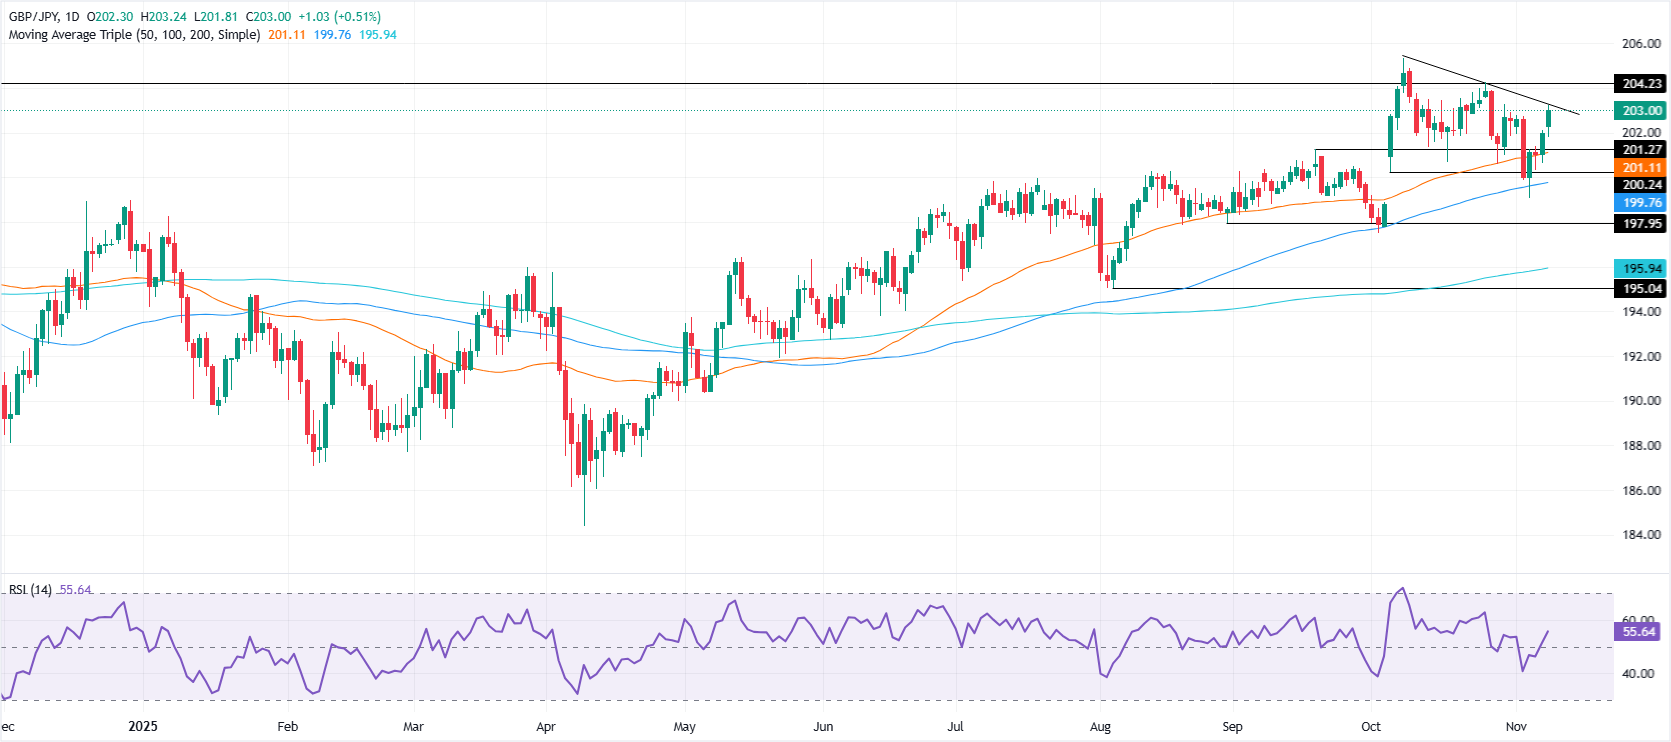
The Pound Sterling extended its gains versus the Japanese Yen on Monday, surpassing the 203.00 milestone as it gains over 0.54% clearing key previous resistance level turned support at the 20-day SMA at 202.37.
- GBP/JPY climbs above resistance amid renewed buying, turning 202.37 into key support zone.
- Bulls eye 204.24 and year-to-date high near 205.32 as RSI signals further upside momentum.
- Break below 202.00 risks deeper pullback toward 50-day SMA and November 7 swing low.
The Pound Sterling extended its gains versus the Japanese Yen on Monday, surpassing the 203.00 milestone as it gains over 0.54% clearing key previous resistance level turned support at the 20-day SMA at 202.37.
GBP/JPY Price Forecast: Technical outlook
Despite this, the GBP/JPY seems poised to consolidate unless buyers clear the next key resistance at 204.24 October 27 swing high. An uptrend resumption above the latter and the next stop would be the year-to-date (YTD) high at 205.32.
For a bearish scenario, sellers need to push the cross below the 20-dat SMA to test 202.00. Subsequent support rests at the 50-day SMA at 201.27, and a clear break, puts 201.00 to the test ahead of challenging the November 7 daily low of 200.65.
Given the backdrop described and the bullish momentum depicted by the Relative Strength Index (RSI), further upside is seen, but it is crucial for buyers, to hold firm above 203.00.
GBP/JPY Price Chart – Daily
Pound Sterling Price This week
The table below shows the percentage change of British Pound (GBP) against listed major currencies this week. British Pound was the strongest against the Swiss Franc.
| USD | EUR | GBP | JPY | CAD | AUD | NZD | CHF | |
|---|---|---|---|---|---|---|---|---|
| USD | 0.05% | 0.04% | 0.02% | 0.04% | 0.04% | -0.01% | 0.06% | |
| EUR | -0.05% | -0.01% | -0.05% | -0.01% | -0.02% | -0.07% | 0.00% | |
| GBP | -0.04% | 0.01% | 0.00% | -0.01% | -0.01% | -0.05% | 0.01% | |
| JPY | -0.02% | 0.05% | 0.00% | 0.00% | -0.00% | -0.04% | 0.02% | |
| CAD | -0.04% | 0.01% | 0.00% | -0.00% | -0.01% | -0.03% | 0.02% | |
| AUD | -0.04% | 0.02% | 0.00% | 0.00% | 0.00% | -0.04% | 0.00% | |
| NZD | 0.00% | 0.07% | 0.05% | 0.04% | 0.03% | 0.04% | 0.06% | |
| CHF | -0.06% | -0.00% | -0.01% | -0.02% | -0.02% | -0.01% | -0.06% |
The heat map shows percentage changes of major currencies against each other. The base currency is picked from the left column, while the quote currency is picked from the top row. For example, if you pick the British Pound from the left column and move along the horizontal line to the US Dollar, the percentage change displayed in the box will represent GBP (base)/USD (quote).

FXStreet
100만 명이 넘는 사용자가 FXStreet를 통해 실시간 시장 데이터, 차트 도구, 전문가 인사이트, 포렉스 뉴스를 이용합니다. 포괄적인 경제 캘린더와 교육 웨비나는 트레이더가 정보를 유지하고 신중한 결정을 내리도록 돕습니다. FXStreet는 바르셀로나 본사와 전 세계 지역에 걸쳐 약 60명의 팀으로 구성되어 있습니다.
Read More


