
Trade The World
Mantle Price Forecast: MNT’s 20% surge reclaims key support as bulls eye $1
작성자 John Isige
게시일: 4 Aug 2025 | 수정일: 4 Aug 2025


POPULAR ARTICLES

Mantle (MNT) price posts one of the strongest intraday rebounds on Monday, backed by strong retail interest and risk-on sentiment in the broader cryptocurrency market.
- Mantle extends recovery, surging 20% on Monday, backed by bullish sentiment in the broader crypto market.
- Mantle reclaims support above 50-day, 100-day and 200-day moving averages as bulls tighten their grip.
- Multiple buy signals could emerge as RSI rises toward overbought territory.
Mantle (MNT) price posts one of the strongest intraday rebounds on Monday, backed by strong retail interest and risk-on sentiment in the broader cryptocurrency market. The bullish sentiment follows extremely oversold conditions last week, triggered by macroeconomic uncertainty and the impact of higher tariffs in the United States (US), which are expected to take effect later this week.
If MNT upholds the bullish outlook and settles above a higher support level in upcoming sessions, risk-on sentiment could accelerate the recovery toward the $1.00 key milestone.
Mantle rebounds as interest in the token rises
Mantle’s derivatives market has experienced a significant comeback over the last 24 hours as the Open Interest (OI) increases 69% to $36 million. Such a strong rebound suggests that traders are increasingly betting on MTN extending the gains.
A subsequent increase in the futures funding rate from negative territory to 0.0099% backs bullish sentiment.
According to CoinGlass data, no long position holder has been liquidated over the past 24 hours compared to approximately $199,000 worth of short position liquidations.
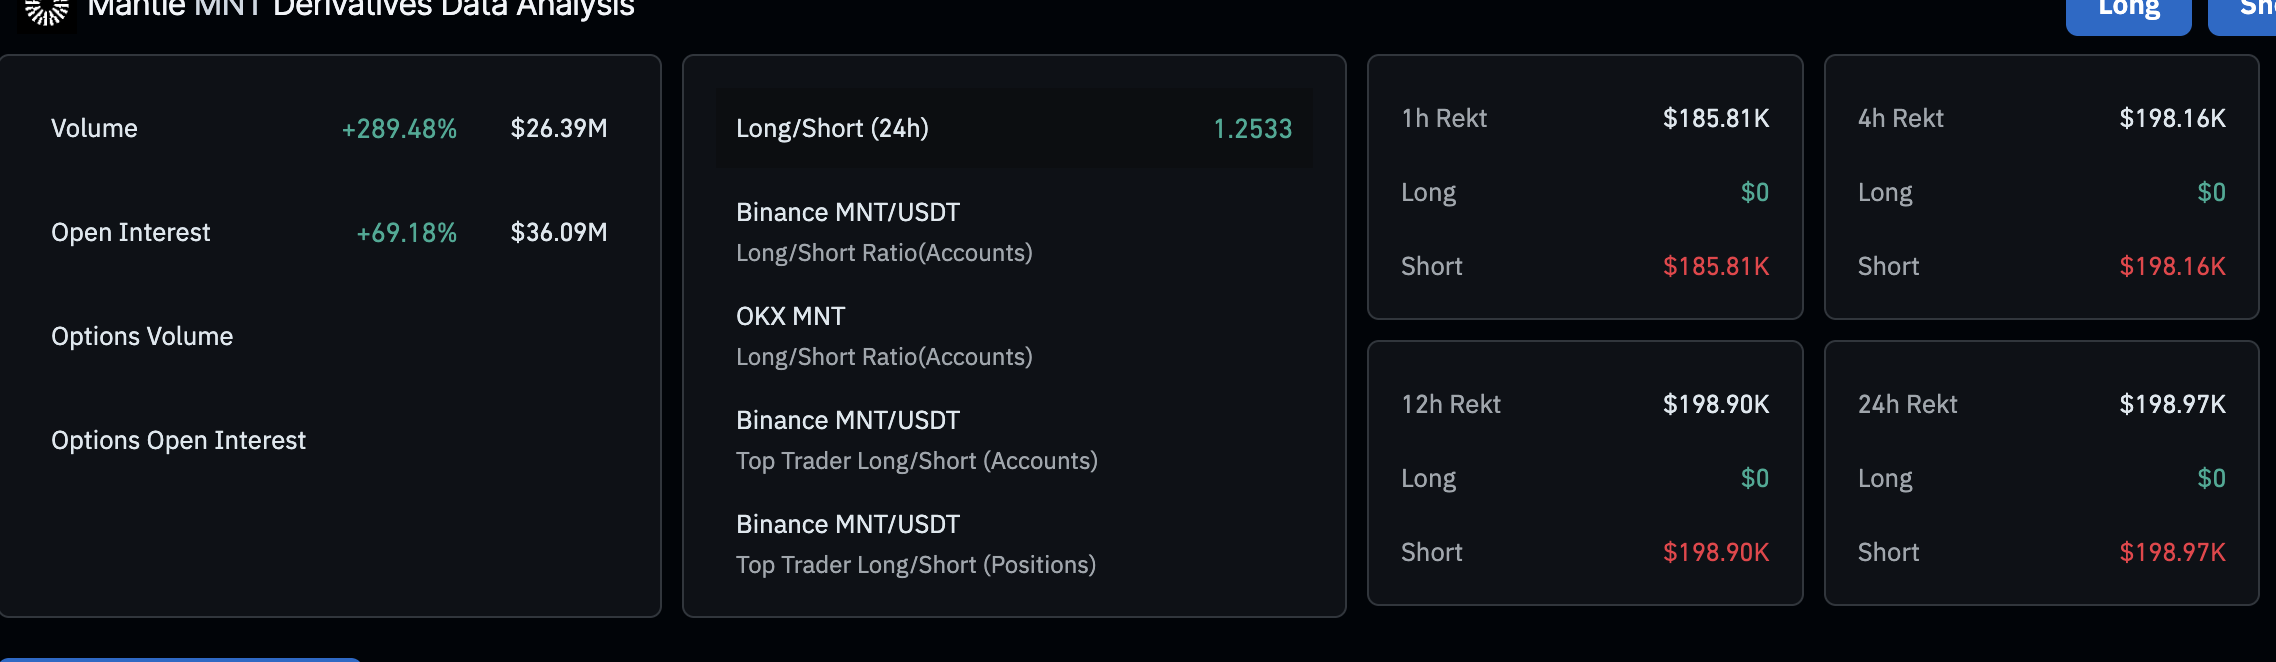
Mantle derivatives market data | Source: CoinGlass
Technical outlook: Mantle offers bullish signals
Mantle price remains bullish at the time of writing, exchanging hands at around $0.86. The token holds above key support levels, including a recently broken descending trendline, the 200-day Exponential Moving Average (EMA) at $0.75, and the confluence formed at $0.71 by the 50-day EMA and the 200-day EMA.
The Relative Strength Index (RSI), which has rebounded into bullish territory at 64, reinforces the strong bullish grip. If the RSI upholds the uptrend toward overbought territory, it would suggest a surge in buying pressure amid bullish sentiment.
Mantle’s bullish structure has the backing of the SuperTrend indicator, which triggered a buy signal on July 12 when the price flipped above the indicator, changing its color to green from red.
The SuperTrend is a trend-following indicator that incorporates the Average True Range (ATR) to gauge market volatility. It functions as dynamic support or resistance, which could explain Mantle’s bullish reaction following its emergence.
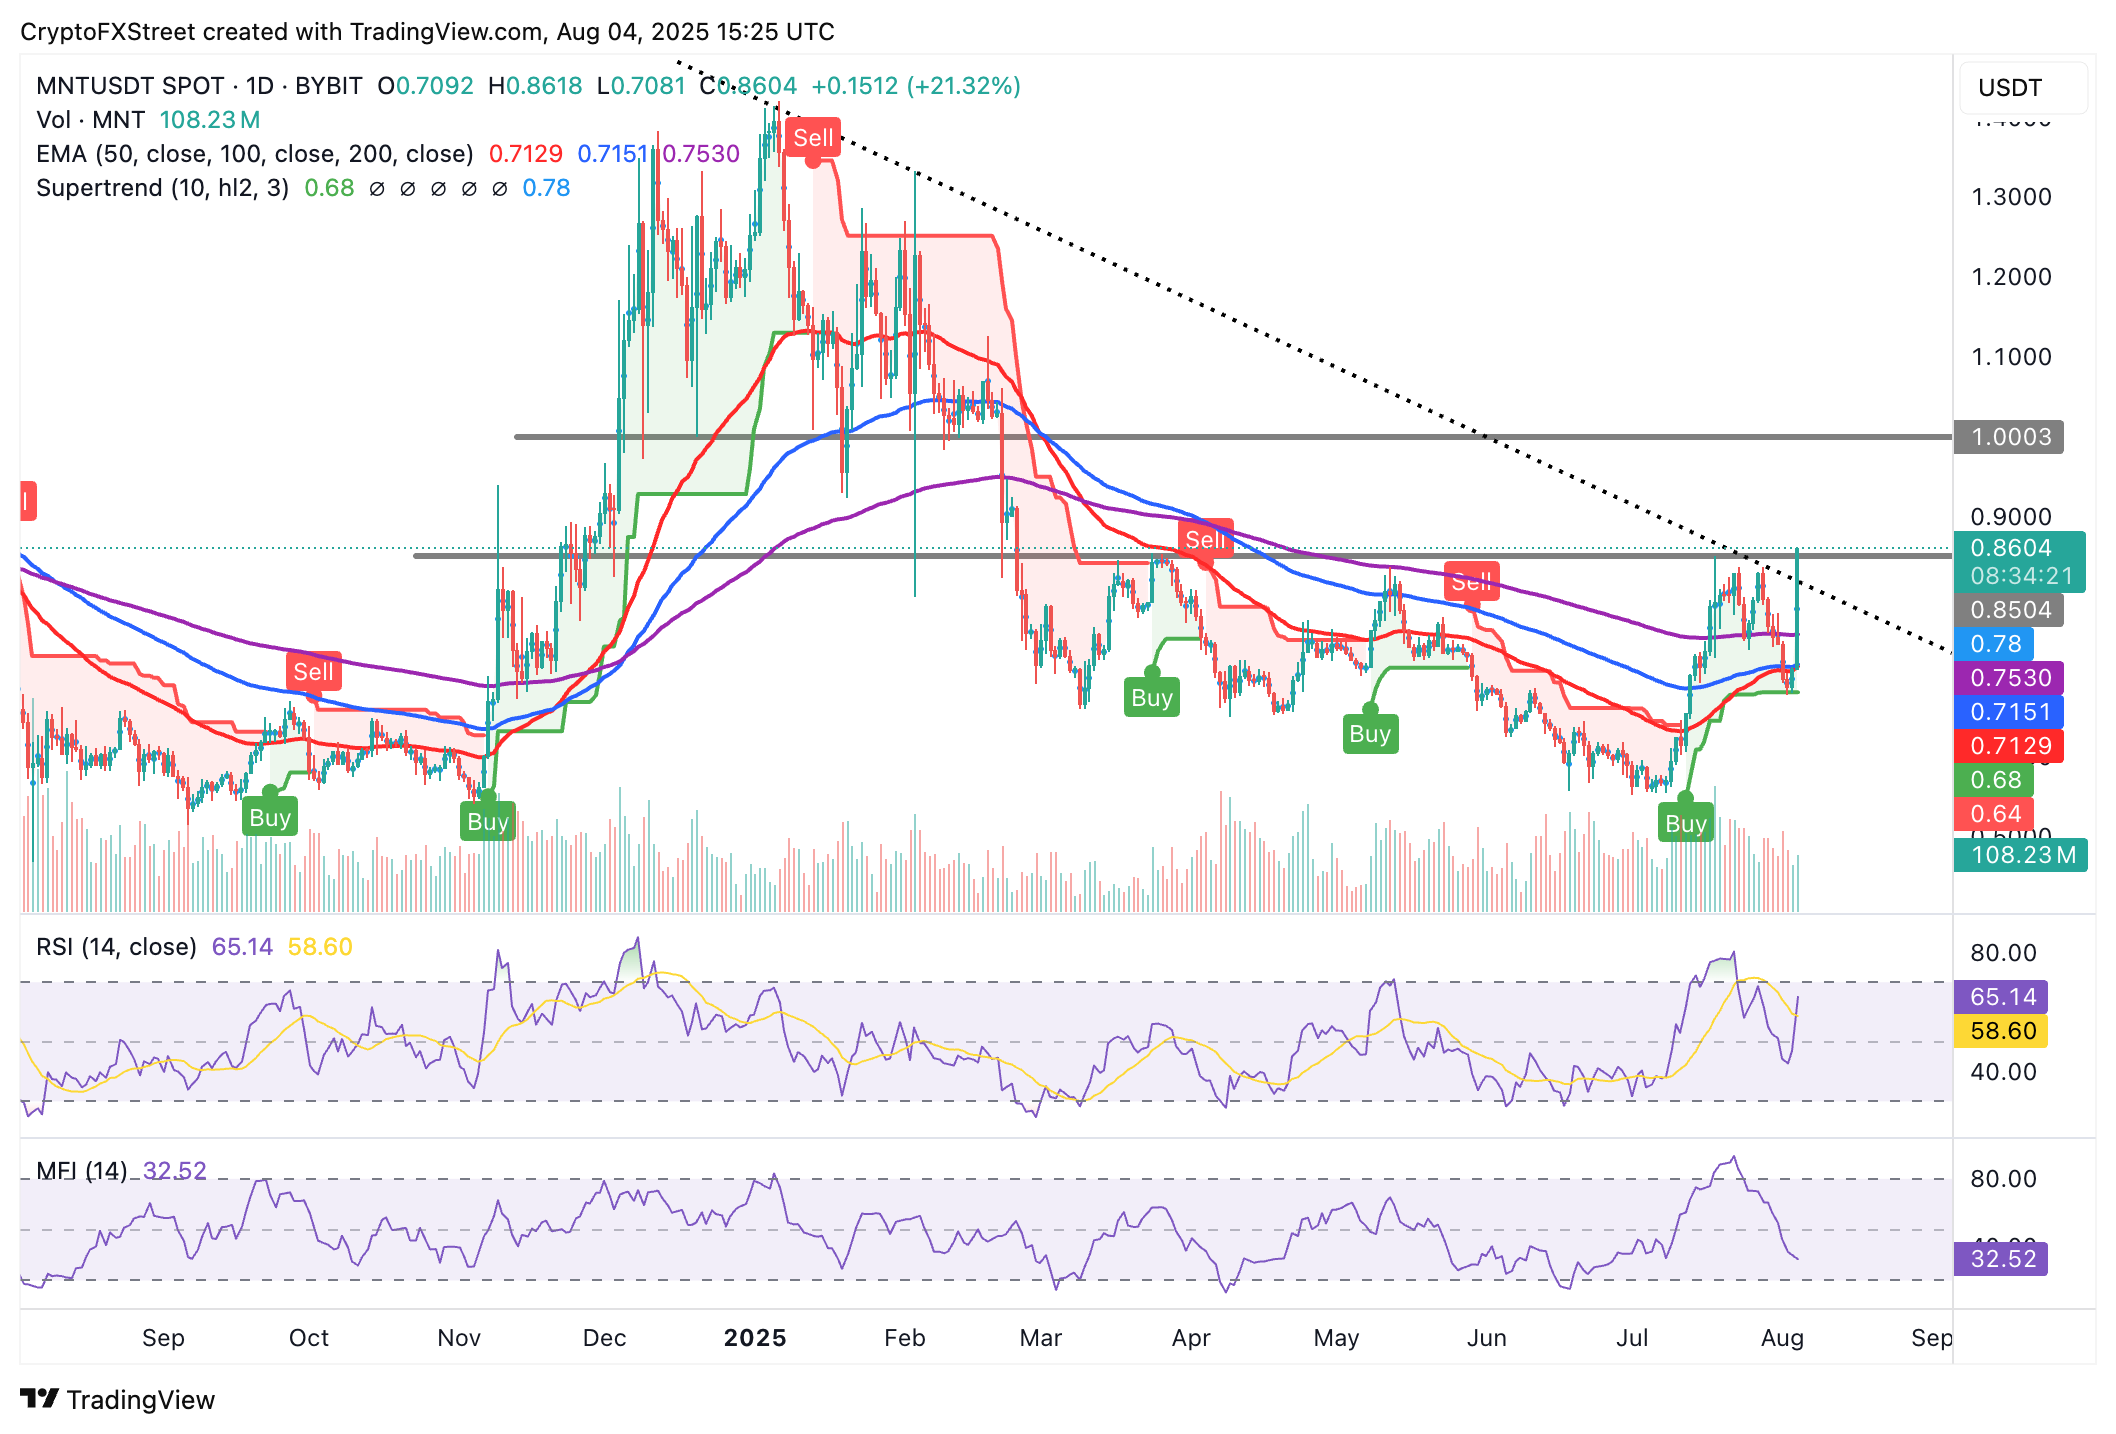
MNT/USDT daily chart
Still, traders should temper their bullish expectations considering the Money Flow Index (MFI) indicator’s significant downswing from overbought territory the previous month to near the oversold region as shown on the daily chart.
Key areas of interest to traders are the resistance at $0.85, which has been tested but not broken. If broken, Mantle could accelerate the rally toward the next target at $1.00. On the flip side, the 50-day, 100-day, and 200-day EMAs could serve as tentative support levels in case of a surge in profit-taking, or a change in market dynamics across the cryptocurrency market.
Open Interest, funding rate FAQs
Higher Open Interest is associated with higher liquidity and new capital inflow to the market. This is considered the equivalent of increase in efficiency and the ongoing trend continues. When Open Interest decreases, it is considered a sign of liquidation in the market, investors are leaving and the overall demand for an asset is on a decline, fueling a bearish sentiment among investors.
Funding fees bridge the difference between spot prices and prices of futures contracts of an asset by increasing liquidation risks faced by traders. A consistently high and positive funding rate implies there is a bullish sentiment among market participants and there is an expectation of a price hike. A consistently negative funding rate for an asset implies a bearish sentiment, indicating that traders expect the cryptocurrency’s price to fall and a bearish trend reversal is likely to occur.

FXStreet
100만 명이 넘는 사용자가 FXStreet를 통해 실시간 시장 데이터, 차트 도구, 전문가 인사이트, 포렉스 뉴스를 이용합니다. 포괄적인 경제 캘린더와 교육 웨비나는 트레이더가 정보를 유지하고 신중한 결정을 내리도록 돕습니다. FXStreet는 바르셀로나 본사와 전 세계 지역에 걸쳐 약 60명의 팀으로 구성되어 있습니다.
Read More


