
Meme coins Dogecoin, Shiba Inu, and Pepe extend losses amid bearish sentiment
작성자 Vishal Dixit
게시일: 2 Dec 2025 | 수정일: 2 Dec 2025


인기 기사
Meme coins, including Dogecoin (DOGE), Shiba Inu (SHIB), and Pepe (PEPE), are facing intense selling pressure as the broader cryptocurrency market sentiment shifts bearish.
- Dogecoin threatens a key support after five straight days of decline amid a sell signal from the MACD indicator.
- Shiba Inu extends its decline within a falling wedge pattern, with the technical outlook remaining bearish.
- Pepe advances downwards in a falling channel pattern as retail interest wanes.
Meme coins, including Dogecoin (DOGE), Shiba Inu (SHIB), and Pepe (PEPE), are facing intense selling pressure as the broader cryptocurrency market sentiment shifts bearish. Dogecoin, Shiba Inu, and Pepe log a bearish start to December, extending November’s correction, while the technical outlook warns of further decline.
Retail interest overlooks PEPE as DOGE and SHIB witness a surge
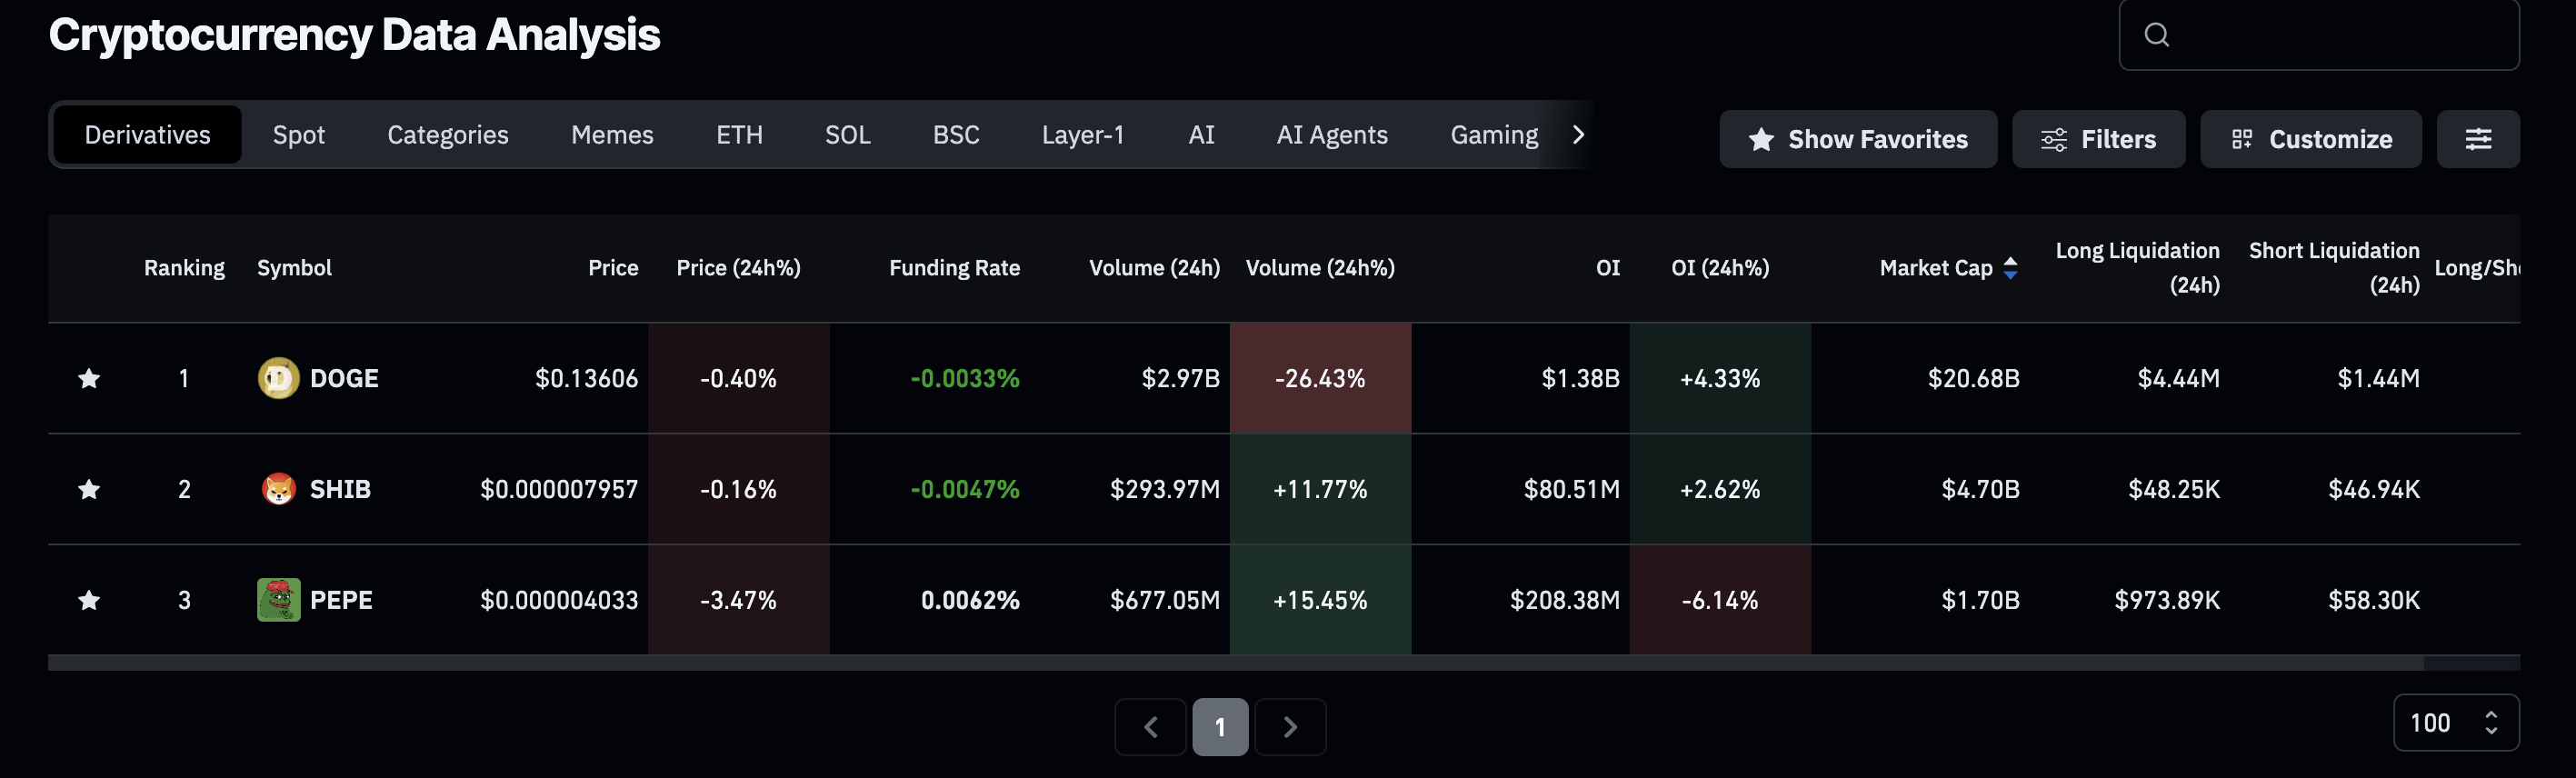
CoinGlass data shows increases of 4.33% and 2.62% in DOGE and SHIB futures Open Interest (OI) over the last 24 hours, reaching $1.38 billion and $80.51 million, respectively. This increase in capital at risk in DOGE and SHIB futures reflects investors' confidence in a bounce back.
However, the frog-themed meme coin lacks this investor's confidence, as PEPE futures OI is down 6.14% over the same period to $208.38 million. This reflects a lack of confidence in PEPE compared to its peers with larger market capitalizations.
Dogecoin under pressure risks further losses
Dogecoin is trading above $0.13000 by press time on Tuesday, holding steady after Monday's 7% drop, which marked the fifth consecutive bearish daily candle. If the meme coin slips below the April low at $0.12986, it could extend the decline to the October low of $0.09500.
Technically, Dogecoin remains under selling pressure, as the Relative Strength Index (RSI) at 32 on the daily chart nears the oversold zone. At the same time, the Moving Average Convergence Divergence (MACD) indicator reverts to its signal line, risking a potential bearish crossover.
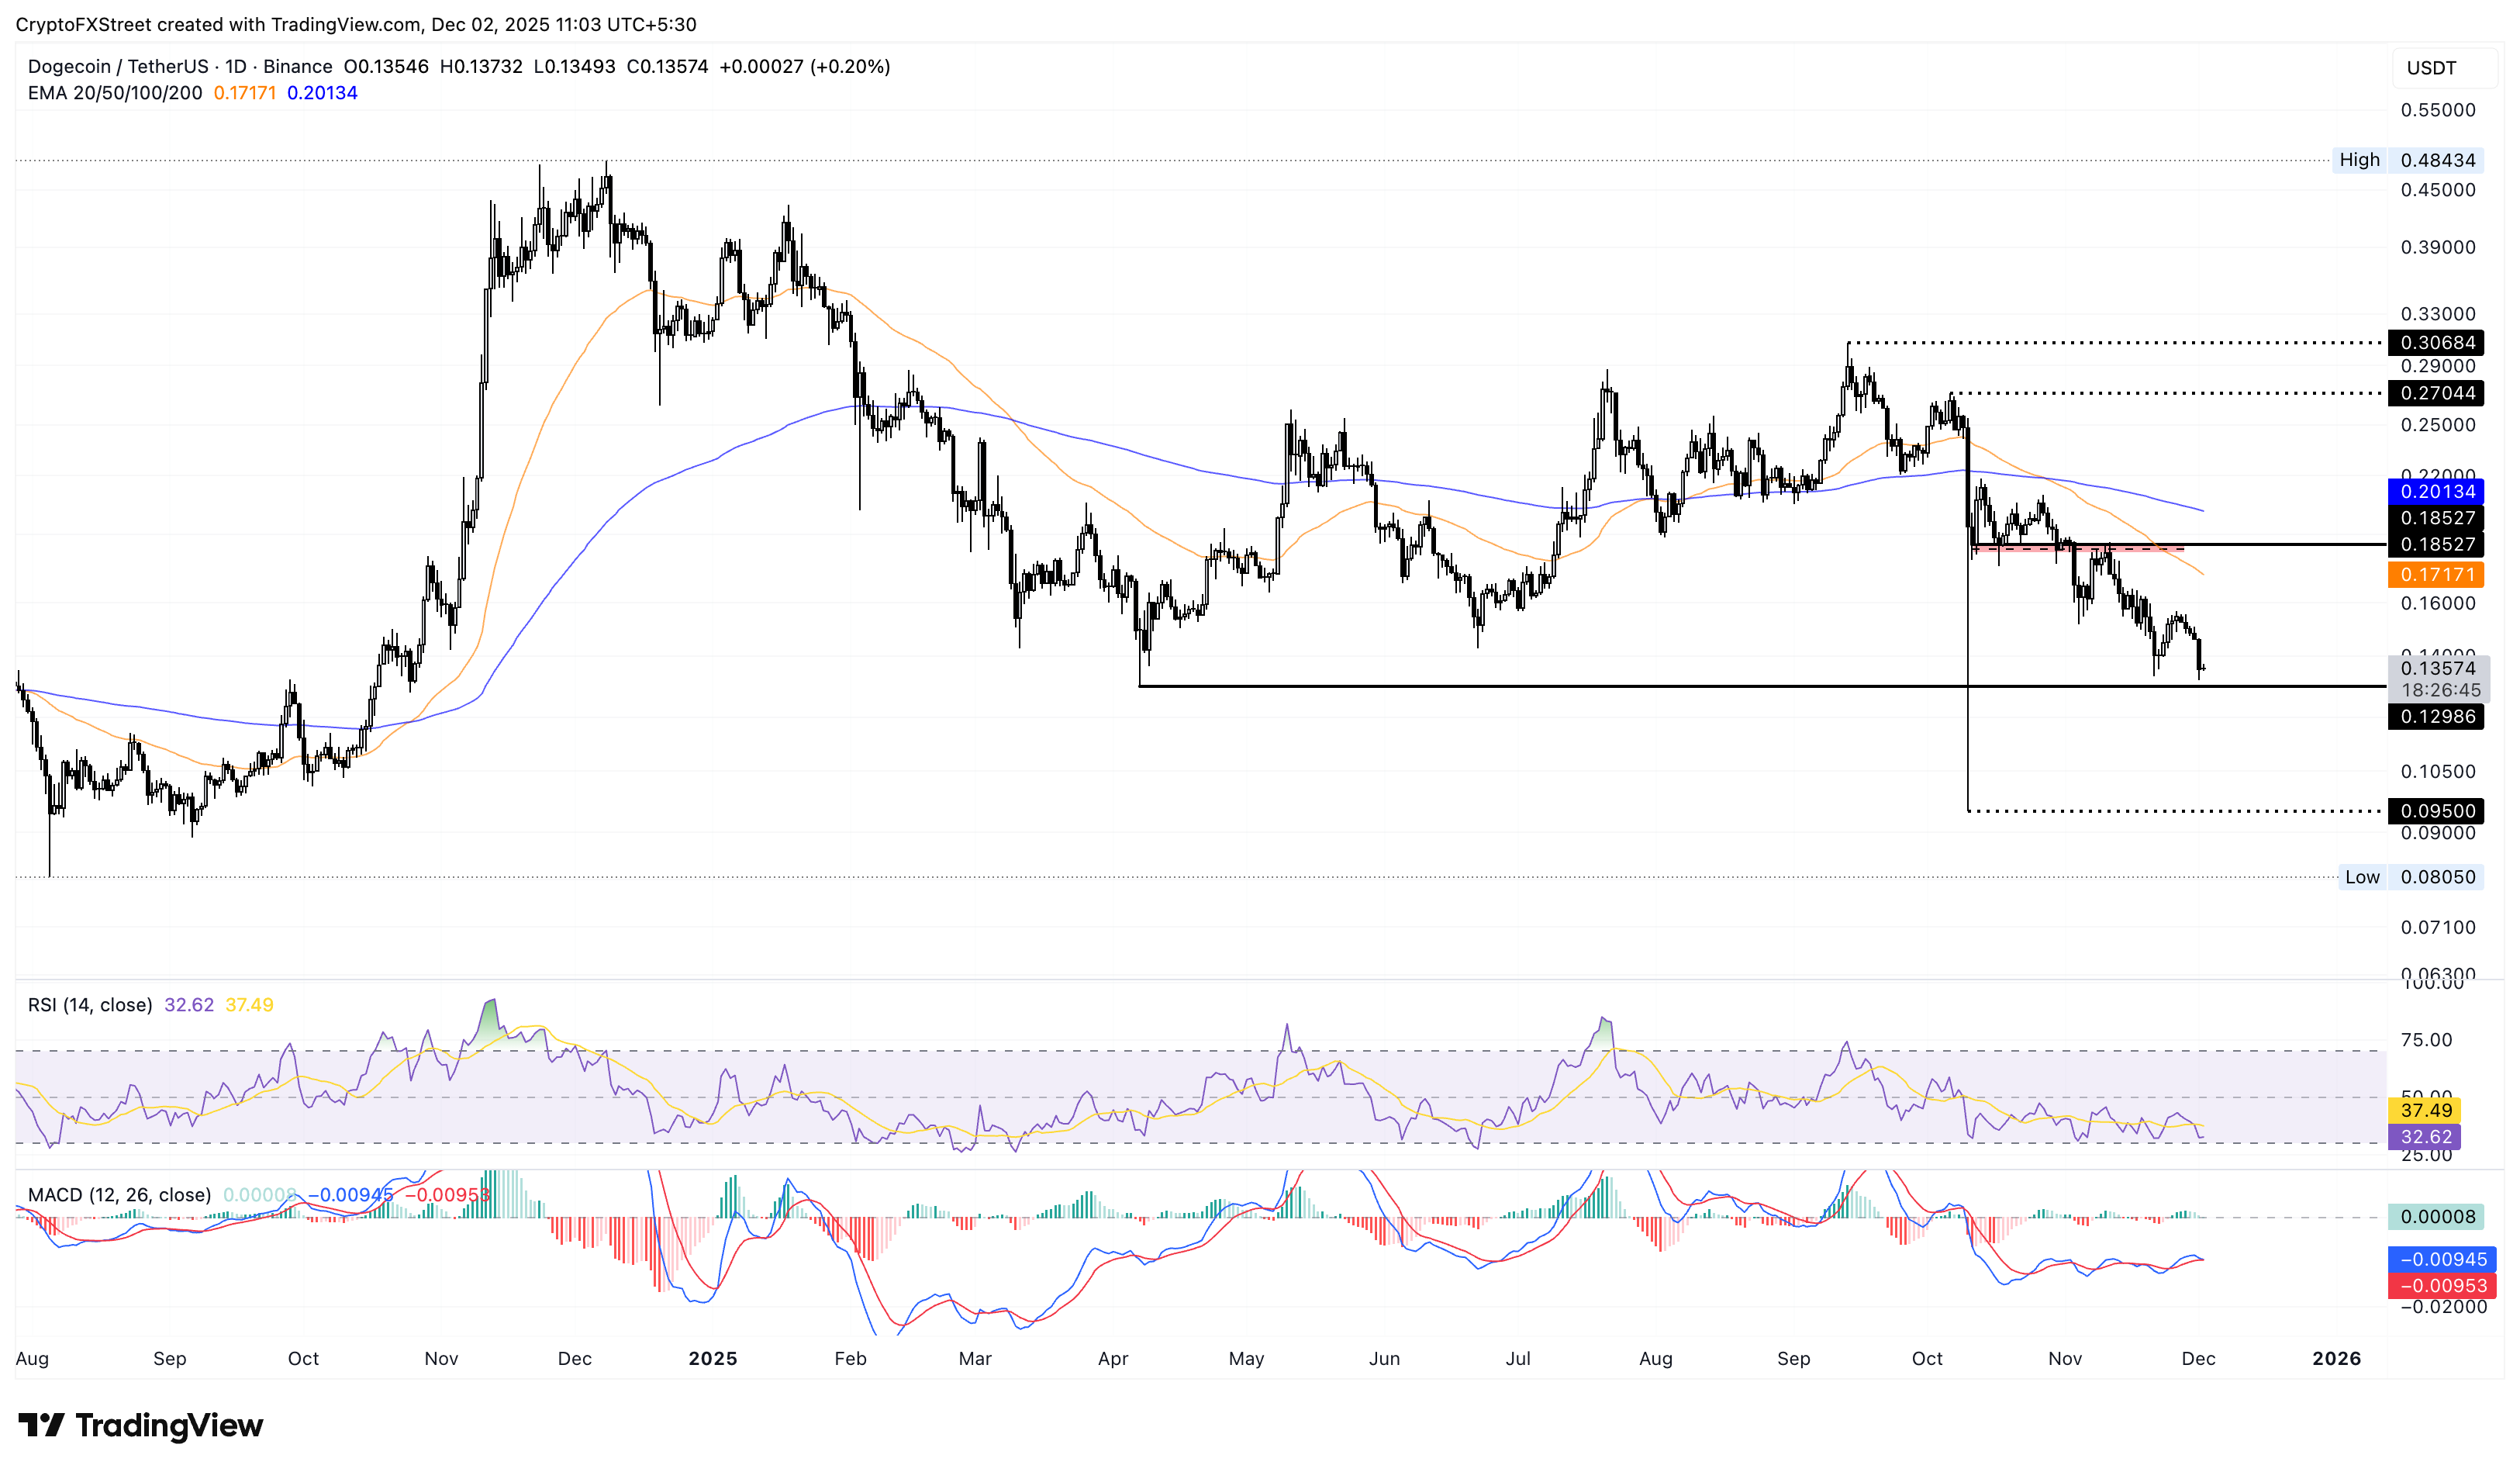
However, the DOGE price action may form a double bottom reversal from $0.12986, which could target the 50-day Exponential Moving Average (EMA) at $0.17171.
Shiba Inu reverts within a falling wedge pattern
Shiba Inu trades below $0.00000800 by press time on Tuesday after four previous days of losses. The ongoing decline is approaching the November 21 low at $0.00000755, which could extend the downward trend to the October 10 low at $0.00000678, if broken.
Similar to Dogecoin, the RSI hovers above the oversold zone while the MACD risks a bearish crossover with the signal line, indicating overhead pressure on SHIB.
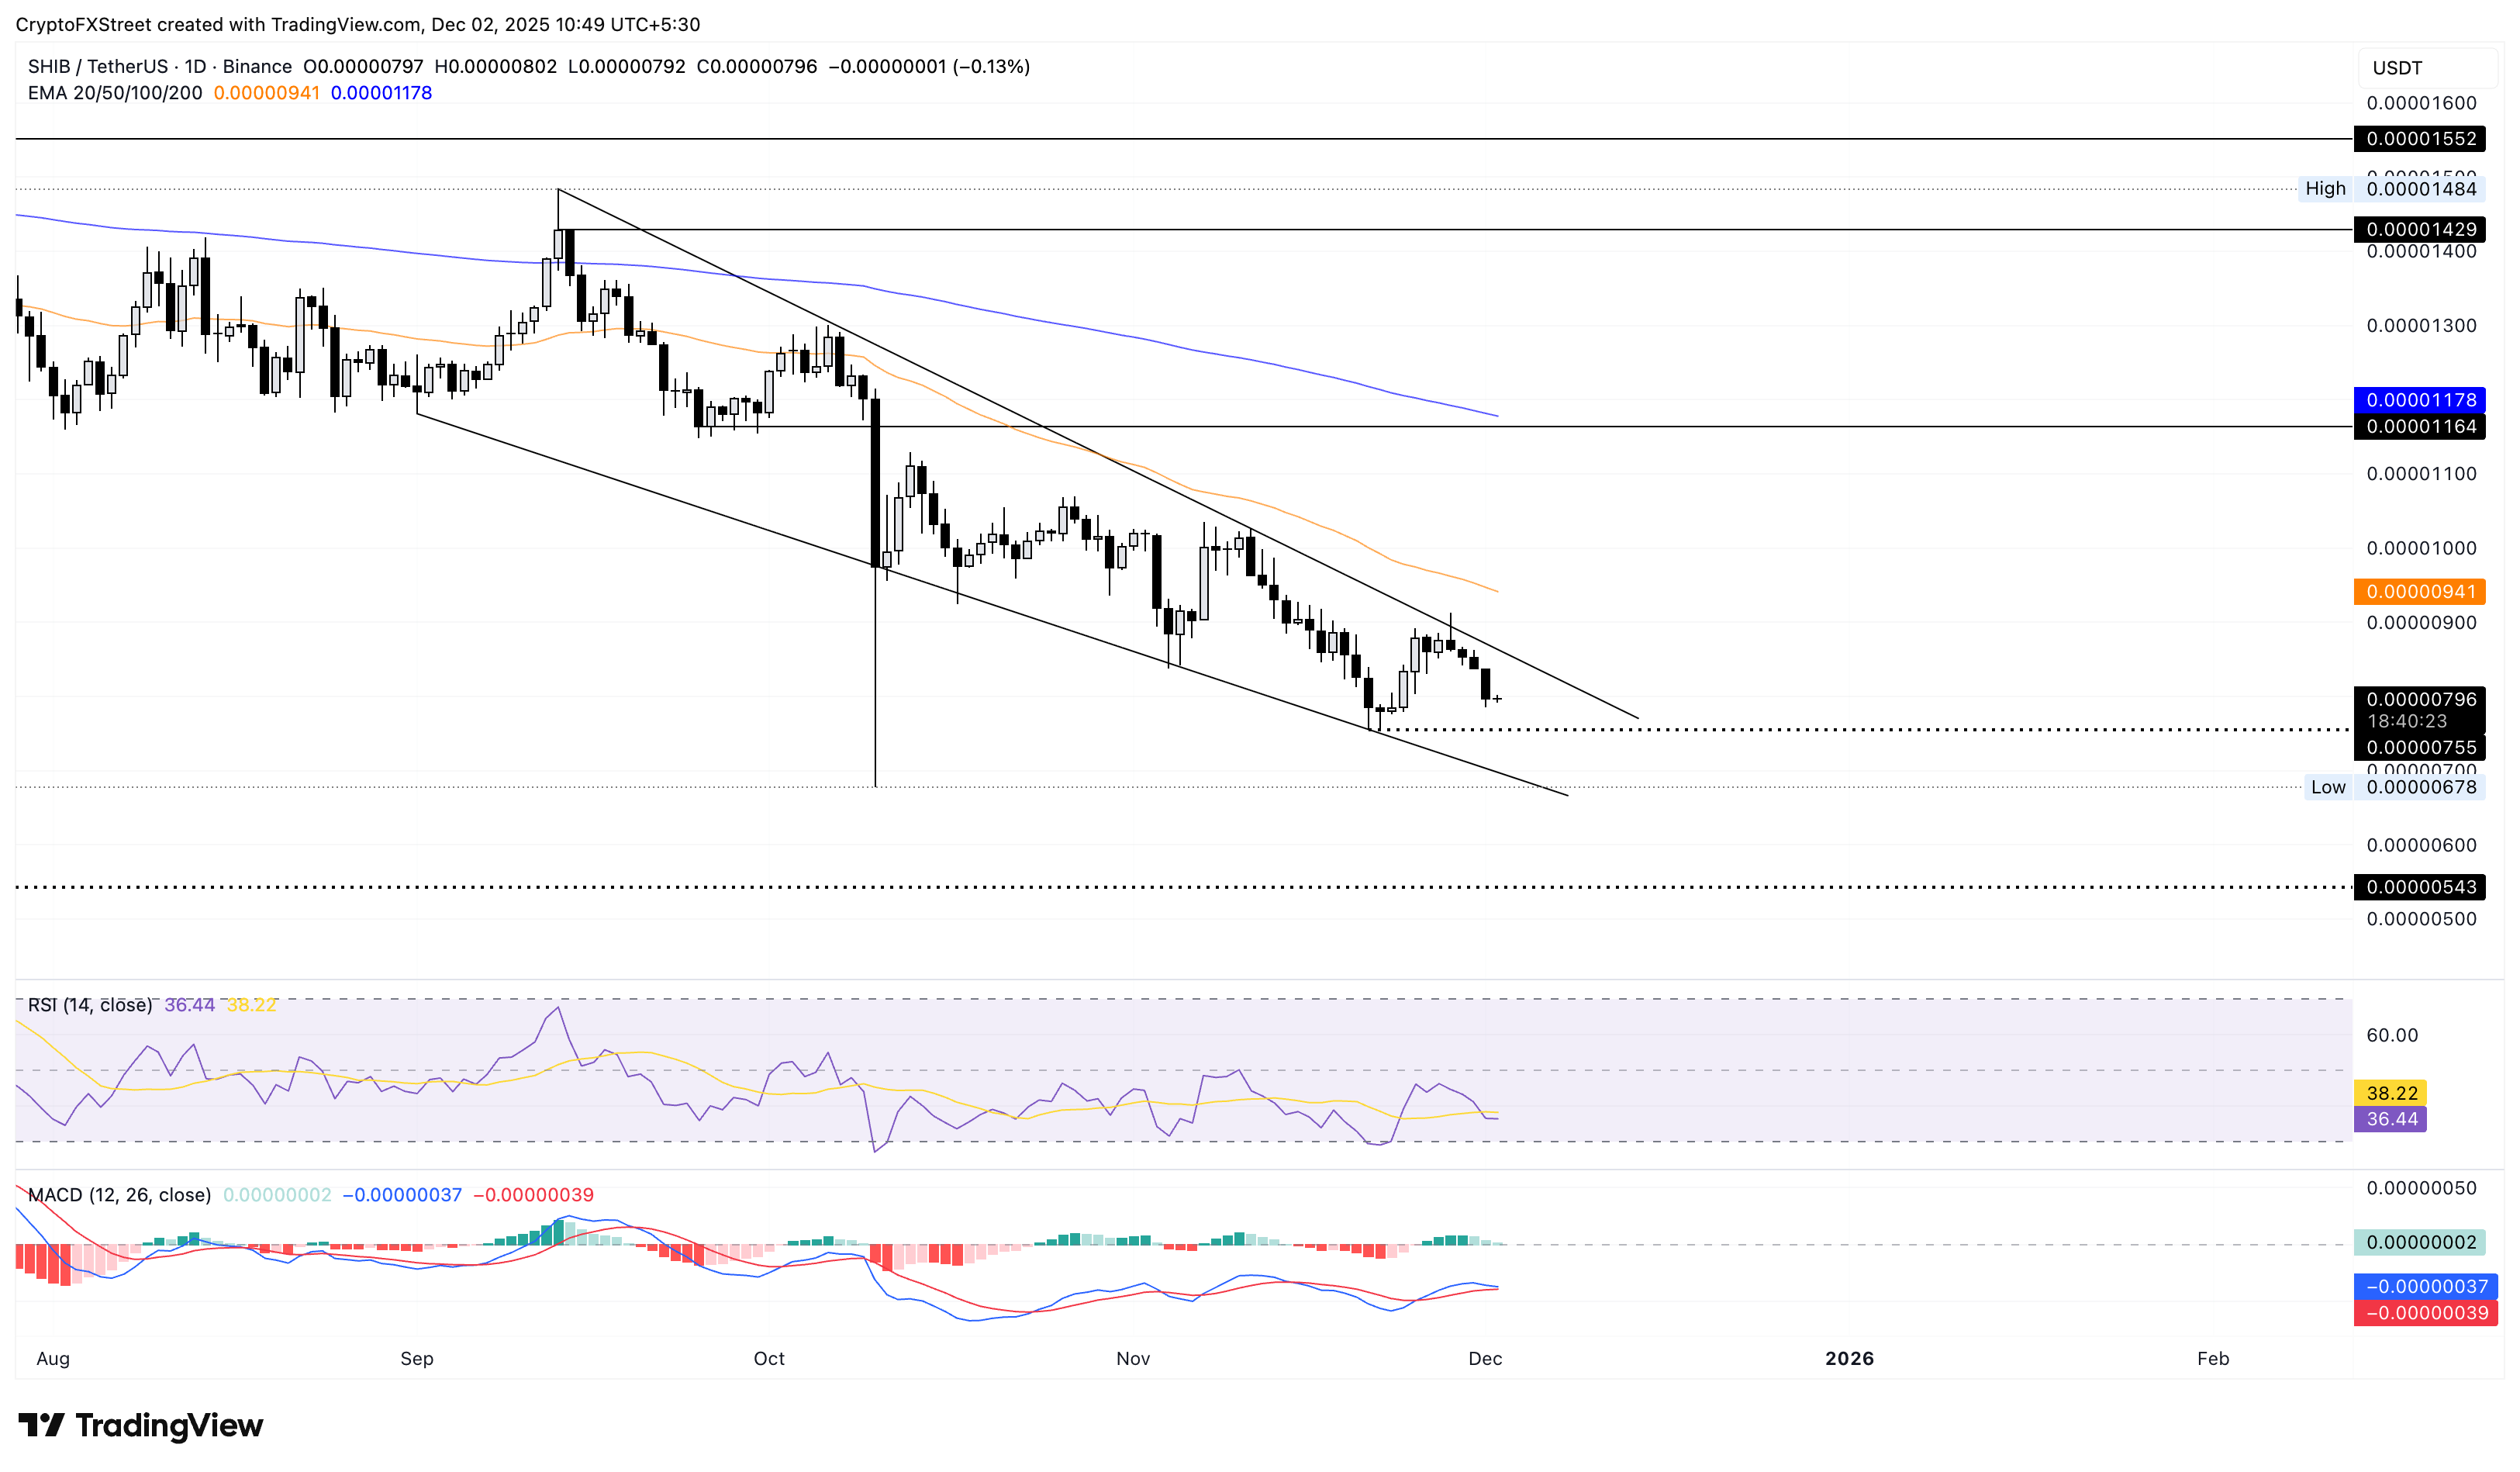
On the contrary, the declining trend in SHIB is approaching the apex of the falling wedge pattern on the daily chart. Typically, this pattern leads to a bullish conclusion with an upside breakout, which could target the 50-day EMA at $0.00000941.
Pepe could extend its decline in a descending channel pattern
Pepe is trading near the $0.00000400 mark at the time of writing on Tuesday, following a nearly 11% loss the previous day. The frog-themed meme coin displays a pullback within a larger falling channel pattern from its resistance trendline, aiming for the S1 Pivot Point at $0.00000341.
If PEPE slips below this level, it could experience further decline to the S2 Pivot Point at $0.00000227.
Due to similar overhead pressure, the momentum indicators flash identical signals: the RSI at 29 suggests oversold conditions, while the MACD shows a potential bearish crossover. If it occurs, it could confirm a renewed selling pressure.
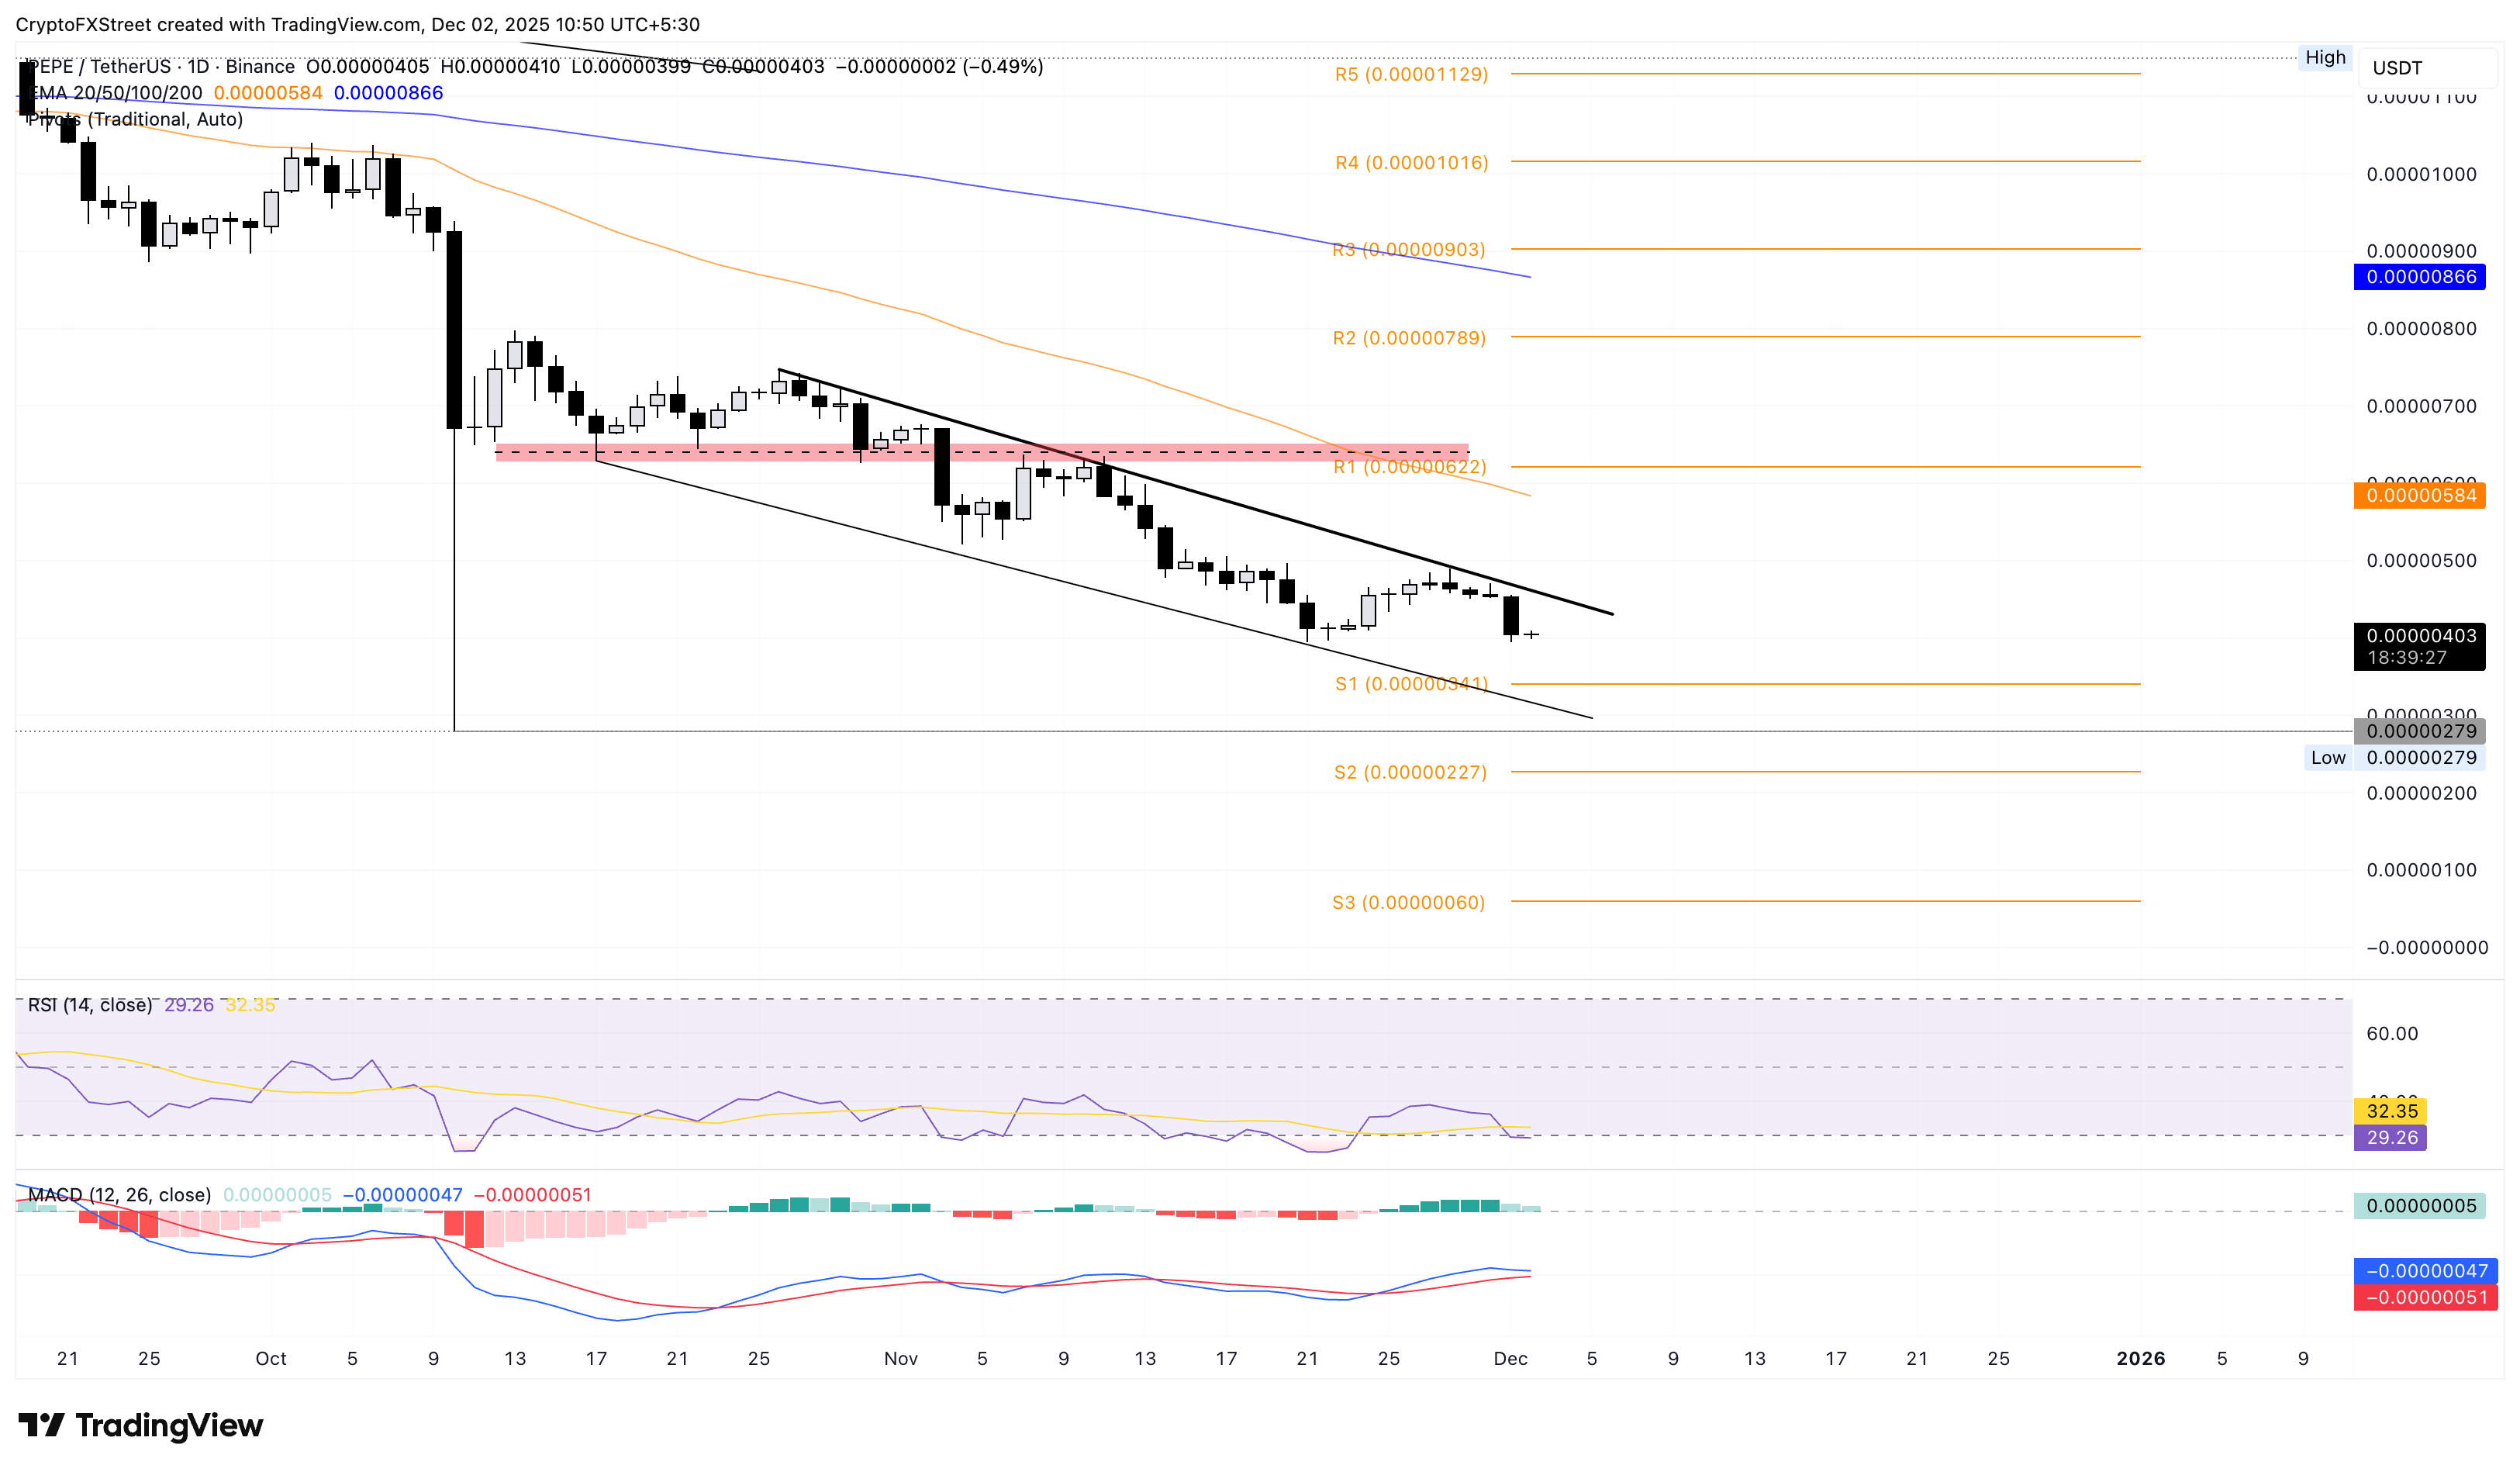
Looking up, if PEPE rebounds above Monday’s open at $0.00000454, nullifying the bearish Marubozu candle, it could confirm the channel breakout. If so, the meme coin could aim for the 50-day EMA at $0.00000584.

100만 명이 넘는 사용자가 FXStreet를 통해 실시간 시장 데이터, 차트 도구, 전문가 인사이트, 포렉스 뉴스를 이용합니다. 포괄적인 경제 캘린더와 교육 웨비나는 트레이더가 정보를 유지하고 신중한 결정을 내리도록 돕습니다. FXStreet는 바르셀로나 본사와 전 세계 지역에 걸쳐 약 60명의 팀으로 구성되어 있습니다.
더 읽기


