
Trade The World
NZD/USD Price Forecasts: Kiwi is testing support at the 0.5700 area
작성자 Guillermo Alcala
게시일: 21 Oct 2025 | 수정일: 21 Oct 2025


POPULAR ARTICLES

New Zealand Dollar’s rejection at the 0.5750-0.5760 resistance area on Monday has reactivated bearish pressure on the pair, pushing prices to the bottom of last week’s trading range, right above 0.5700, which is being tested at the moment.Positive comments from US President Trump, who showed hopes o
- The New Zealand Dollar dives against a stronger USD, approaching the 0.5700 area.
- Easing concerns about a US-China trade war are buoying the US Dollar across the board.
- NZD/USD: Further depreciation below 0.5700 would confirm a bearish flag formation.
New Zealand Dollar’s rejection at the 0.5750-0.5760 resistance area on Monday has reactivated bearish pressure on the pair, pushing prices to the bottom of last week’s trading range, right above 0.5700, which is being tested at the moment.
Positive comments from US President Trump, who showed hopes of signing a fair deal with his Chinese counterpart Xi Jinping next week, are underpinning the US Dollar’s recovery on Tuesday. In New Zealand, on the other hand, the reaction to the
Stronger-than-expected CPI figures have been muted, as growing inflation coupled with slow growth poses a serious challenge for the RBNZ.
Technical Analysis: A break of 0.5700 would confirm a Bearish Flag
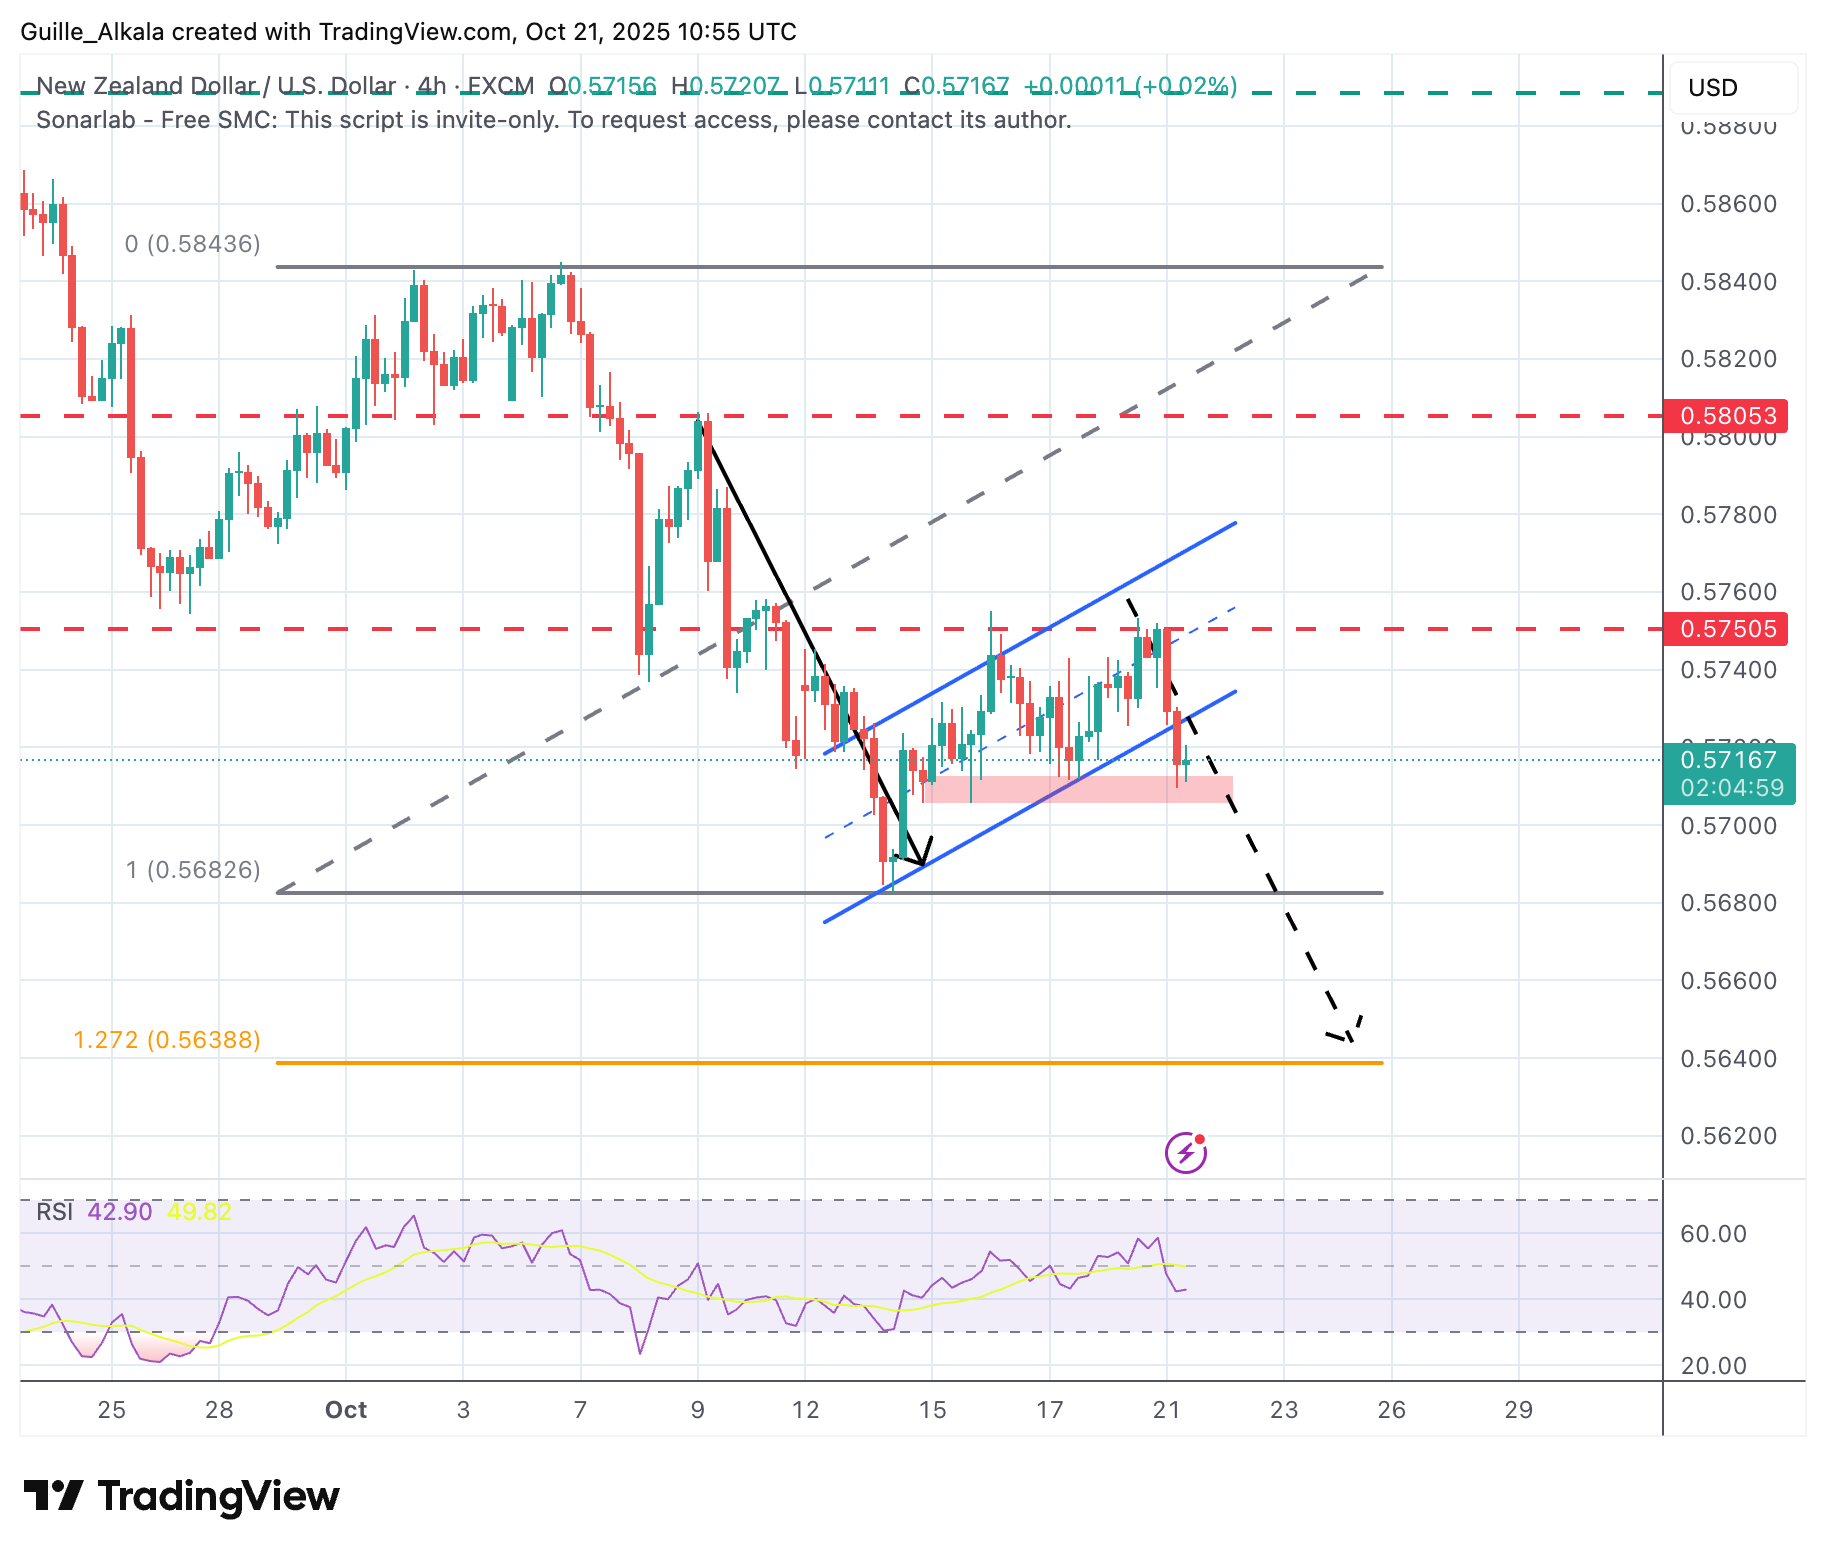
The double top at the 0.5750 area – on October 16 and 20 – highlights a strong resistance area, and the sharp reversal from those levels suggests that bears are taking control, aiming to push price action below the 0.5705–0.5710 area.
A bearish move below the mentioned 0.5700 would confirm a Bearish Flag formation, and increase pressure towards the October 14 low in the area of 0.5680. The flag formation’s measured target is the 127.2% Fibonacci extension of the early October sell-off, at 0.5640.
Upside attempts are likely to face resistance at the mentioned 0.5750-0.5760 area, ahead of trendline resistance, now at 0.5750, and the October 8 high, at 0.5805.
US Dollar Price Today
The table below shows the percentage change of US Dollar (USD) against listed major currencies today. US Dollar was the strongest against the Japanese Yen.
| USD | EUR | GBP | JPY | CAD | AUD | NZD | CHF | |
|---|---|---|---|---|---|---|---|---|
| USD | 0.22% | 0.18% | 0.81% | 0.10% | 0.38% | 0.48% | 0.25% | |
| EUR | -0.22% | -0.04% | 0.56% | -0.13% | 0.17% | 0.25% | 0.02% | |
| GBP | -0.18% | 0.04% | 0.59% | -0.09% | 0.21% | 0.26% | 0.06% | |
| JPY | -0.81% | -0.56% | -0.59% | -0.68% | -0.40% | -0.31% | -0.52% | |
| CAD | -0.10% | 0.13% | 0.09% | 0.68% | 0.28% | 0.38% | 0.15% | |
| AUD | -0.38% | -0.17% | -0.21% | 0.40% | -0.28% | 0.08% | -0.17% | |
| NZD | -0.48% | -0.25% | -0.26% | 0.31% | -0.38% | -0.08% | -0.23% | |
| CHF | -0.25% | -0.02% | -0.06% | 0.52% | -0.15% | 0.17% | 0.23% |
The heat map shows percentage changes of major currencies against each other. The base currency is picked from the left column, while the quote currency is picked from the top row. For example, if you pick the US Dollar from the left column and move along the horizontal line to the Japanese Yen, the percentage change displayed in the box will represent USD (base)/JPY (quote).

FXStreet
100만 명이 넘는 사용자가 FXStreet를 통해 실시간 시장 데이터, 차트 도구, 전문가 인사이트, 포렉스 뉴스를 이용합니다. 포괄적인 경제 캘린더와 교육 웨비나는 트레이더가 정보를 유지하고 신중한 결정을 내리도록 돕습니다. FXStreet는 바르셀로나 본사와 전 세계 지역에 걸쳐 약 60명의 팀으로 구성되어 있습니다.
Read More


