
Trade The World
Pi Network Price Forecast: Strategic 500M PI transfer sparks concerns
작성자 Vishal Dixit
게시일: 25 Aug 2025 | 수정일: 25 Aug 2025


POPULAR ARTICLES
Pi Network (PI) edges lower by over 1% at press time on Monday, marking a bearish start to the week. The mobile mining cryptocurrency is eyeing a record low as selling pressure grows alongside social chatter.
- Pi Network’s token edges lower on Monday, risking a crucial support level breakdown.
- The social dominance score hits its 30-day moving average.
- Pi Foundation wallet made a strategic transfer of 500 million PI tokens on Friday.
Pi Network (PI) edges lower by over 1% at press time on Monday, marking a bearish start to the week. The mobile mining cryptocurrency is eyeing a record low as selling pressure grows alongside social chatter.
Furthermore, the Pi Foundation made a strategic transfer of 500 million tokens on Friday to a new wallet, coinciding with the start of the ongoing correction.
Large transfer from Pi Foundation creates buzz
PiScan data shows the Pi Foundation #14 wallet made five consecutive transactions of 100 million PI tokens to different wallets. The move comes as a strategic transfer with no official announcement, days after the hints of a second migration phase from a PI moderator.
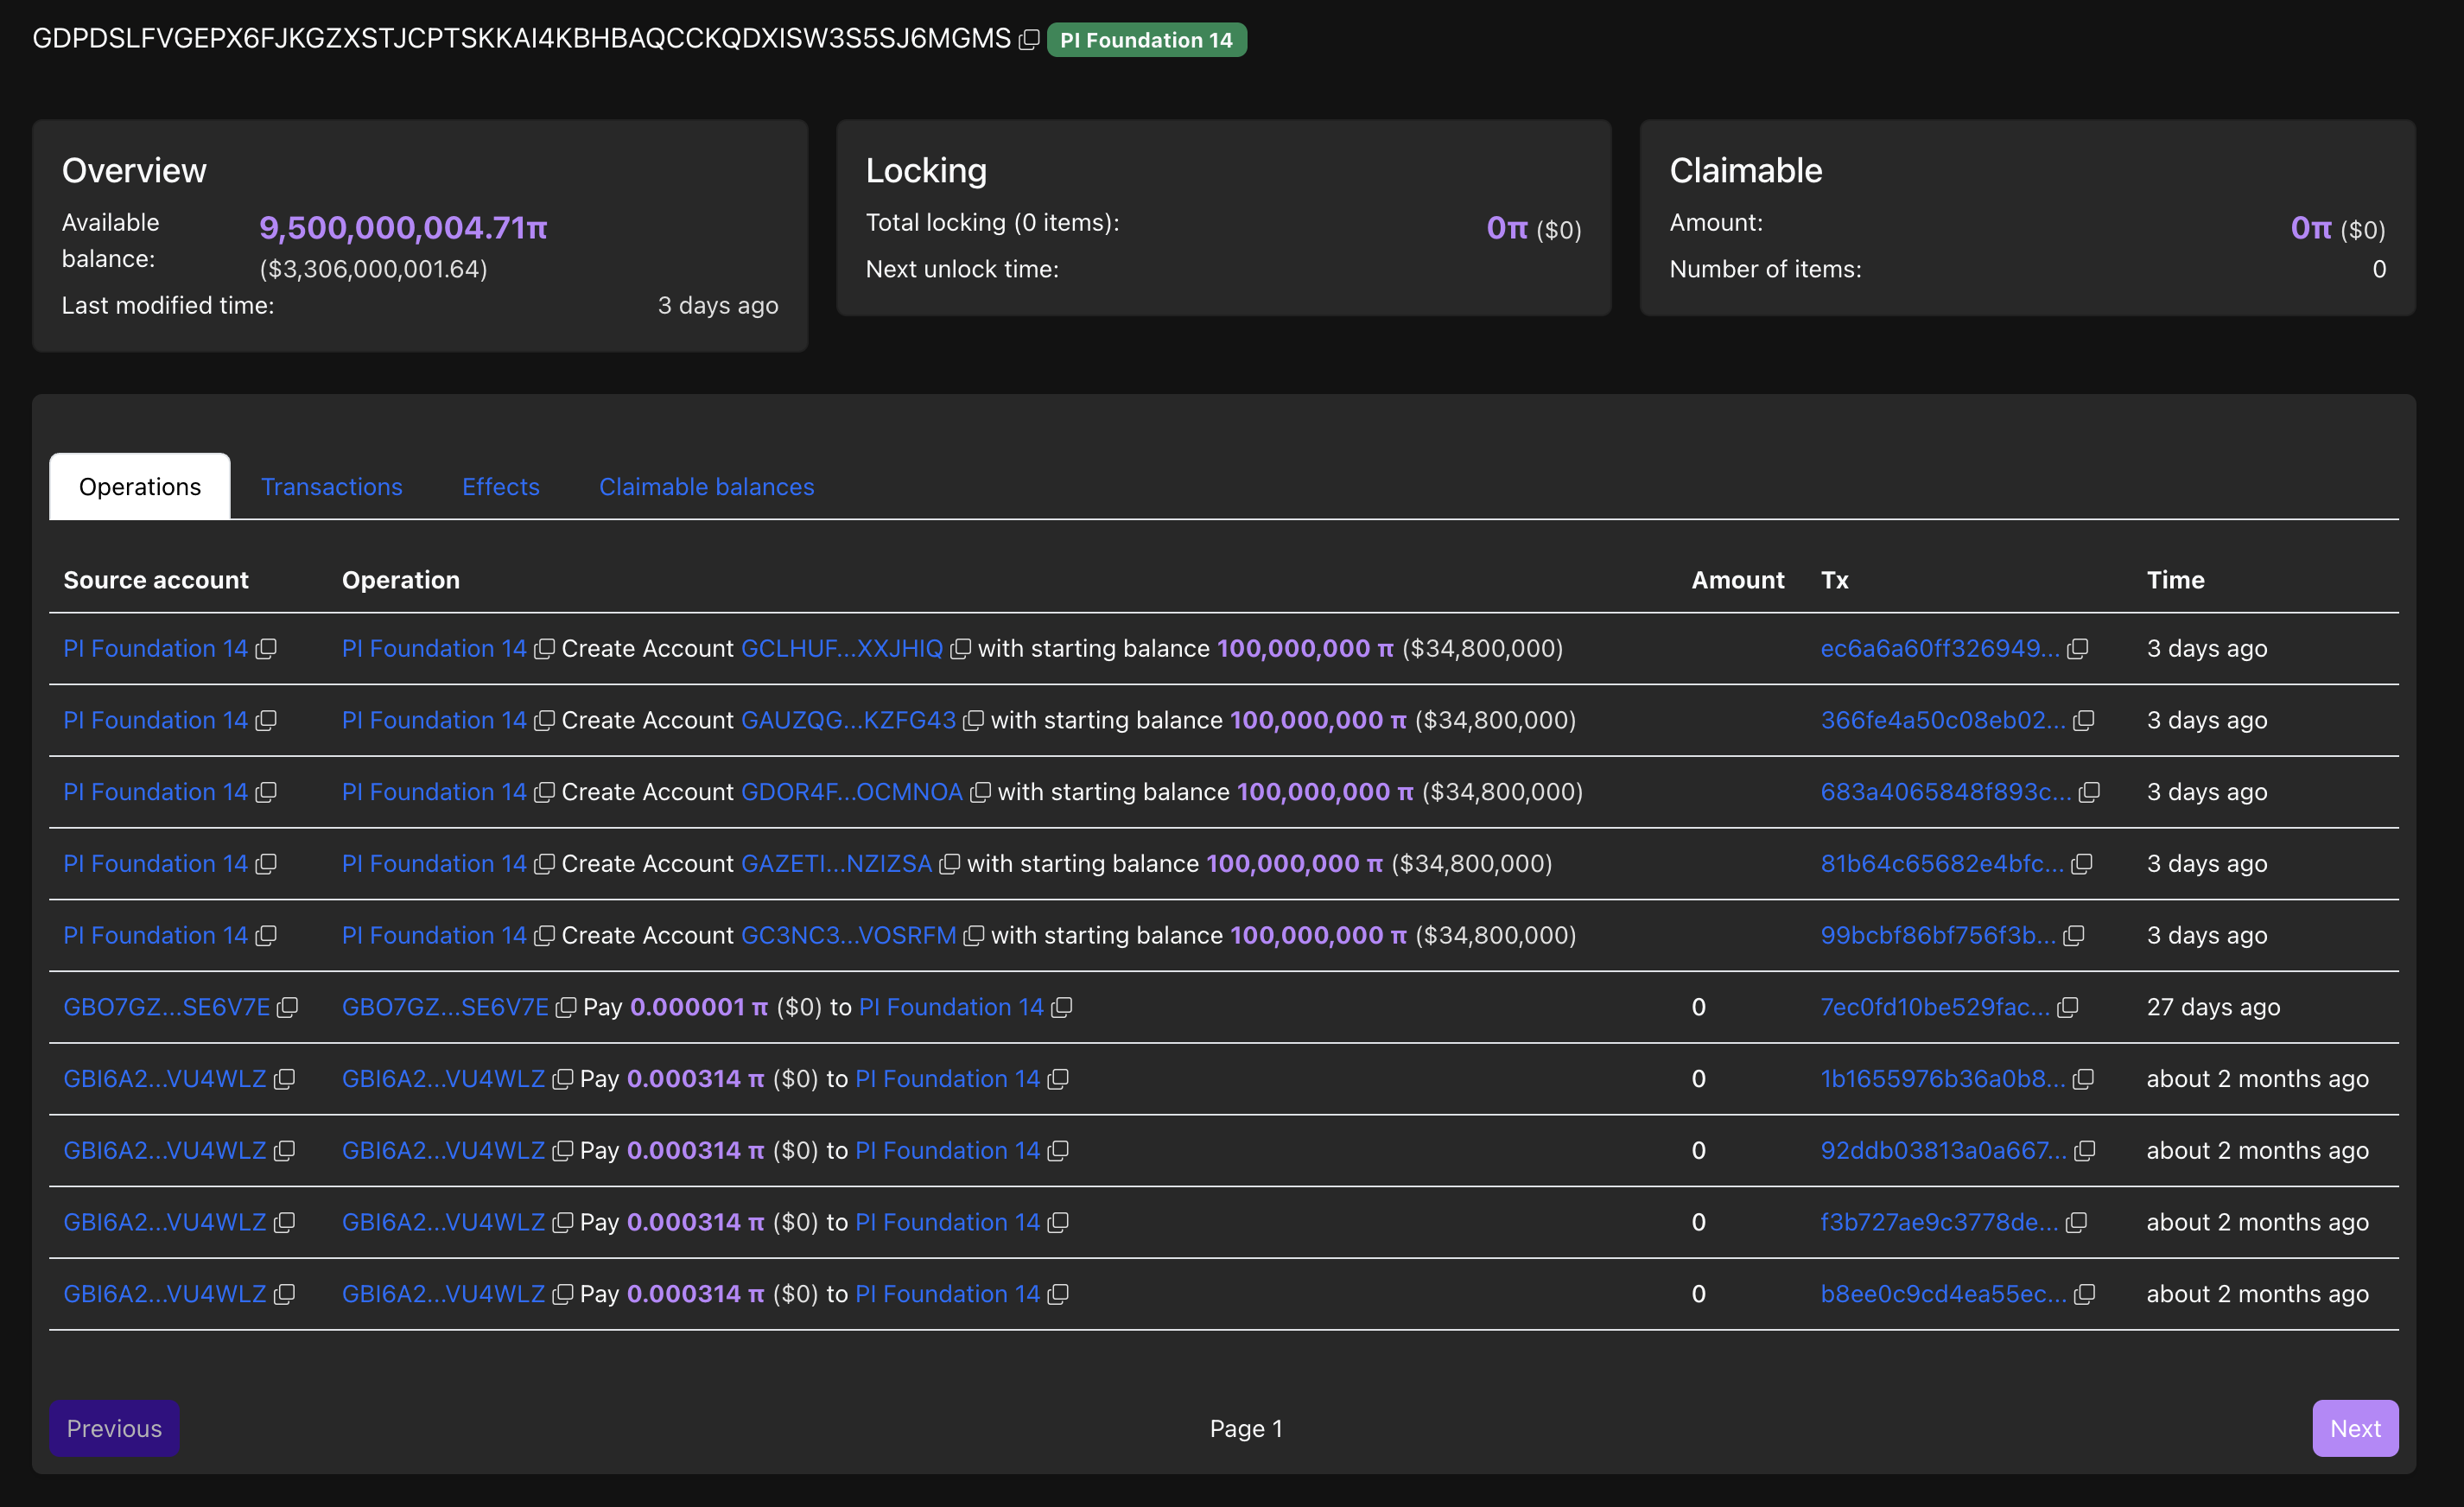
Pi Foundation wallet transactions. Source: PiScan
Still, the sudden shift marks the first-ever withdrawal from the Pi Foundation #14 wallet, following an initial starting balance of 10 billion PI tokens.
Furthermore, the social chatter surrounding the large transactions has increased the social dominance score of Pi Network to 0.202% among all crypto-related social media posts, crossing the 30-day average of 0.195%.
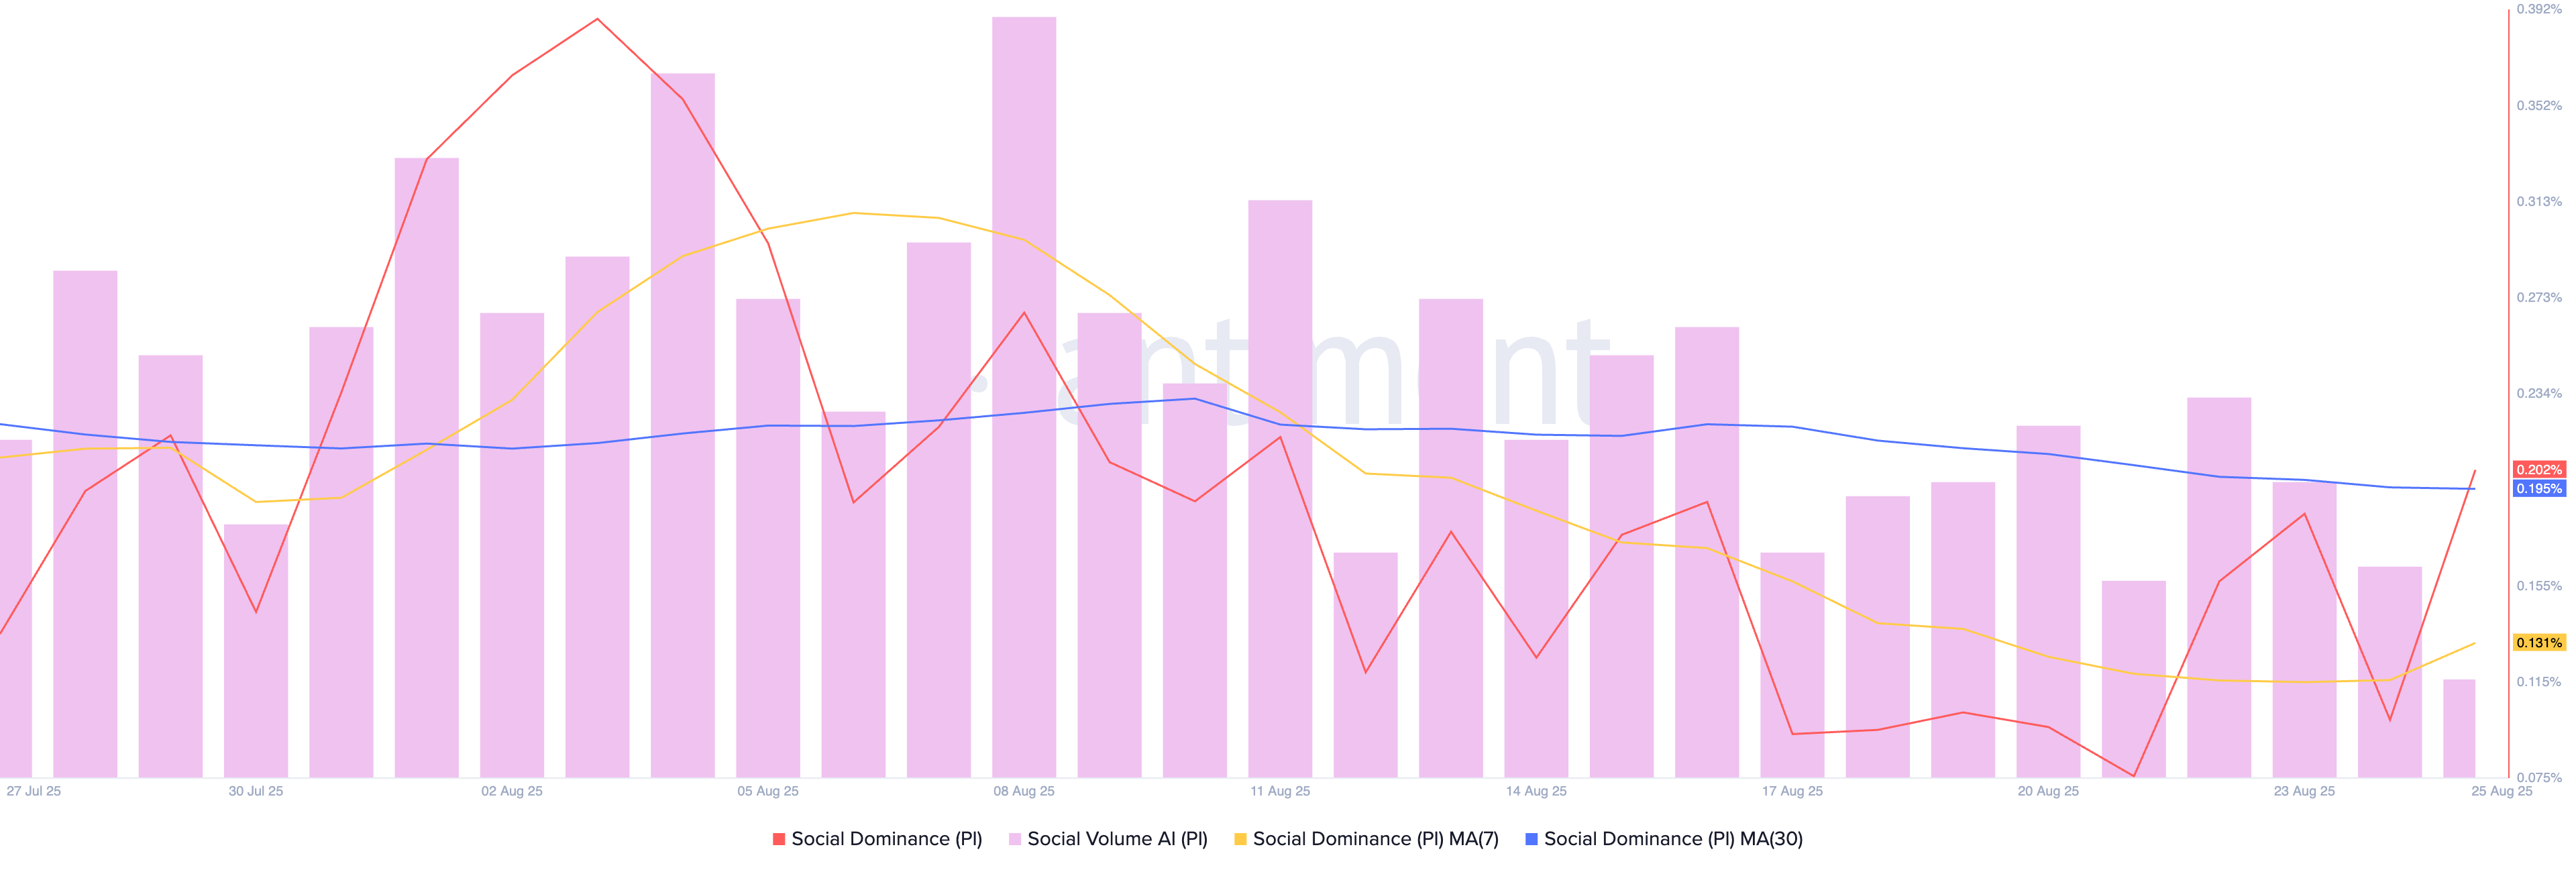
Pi Network social score. Source: Santiment
Pi Network at a crucial crossroads
The declining Pi Network’s PI token puts pressure on the $0.3442 support level marked by the August 5 close. A bearish close to the day below this support level would extend the downcycle within the larger falling channel pattern, marked on the daily chart (shared below).
Pi Network’s downtrend could find support at its record low of $0.3220 from August 1, before reaching the channel’s lower boundary line near the $0.2567 level.
The momentum indicators are on the verge of flashing a sell signal on the daily chart as the declining trend gains traction. The Moving Average Convergence Divergence (MACD) indicates a potential crossover below its signal line, which would signal a bearish shift in trend momentum and trigger a sell signal.
Furthermore, the downward-sloping Relative Strength Index (RSI) reads 38 as selling pressure increases. The indicator also signals extended room for correction before reaching oversold levels.
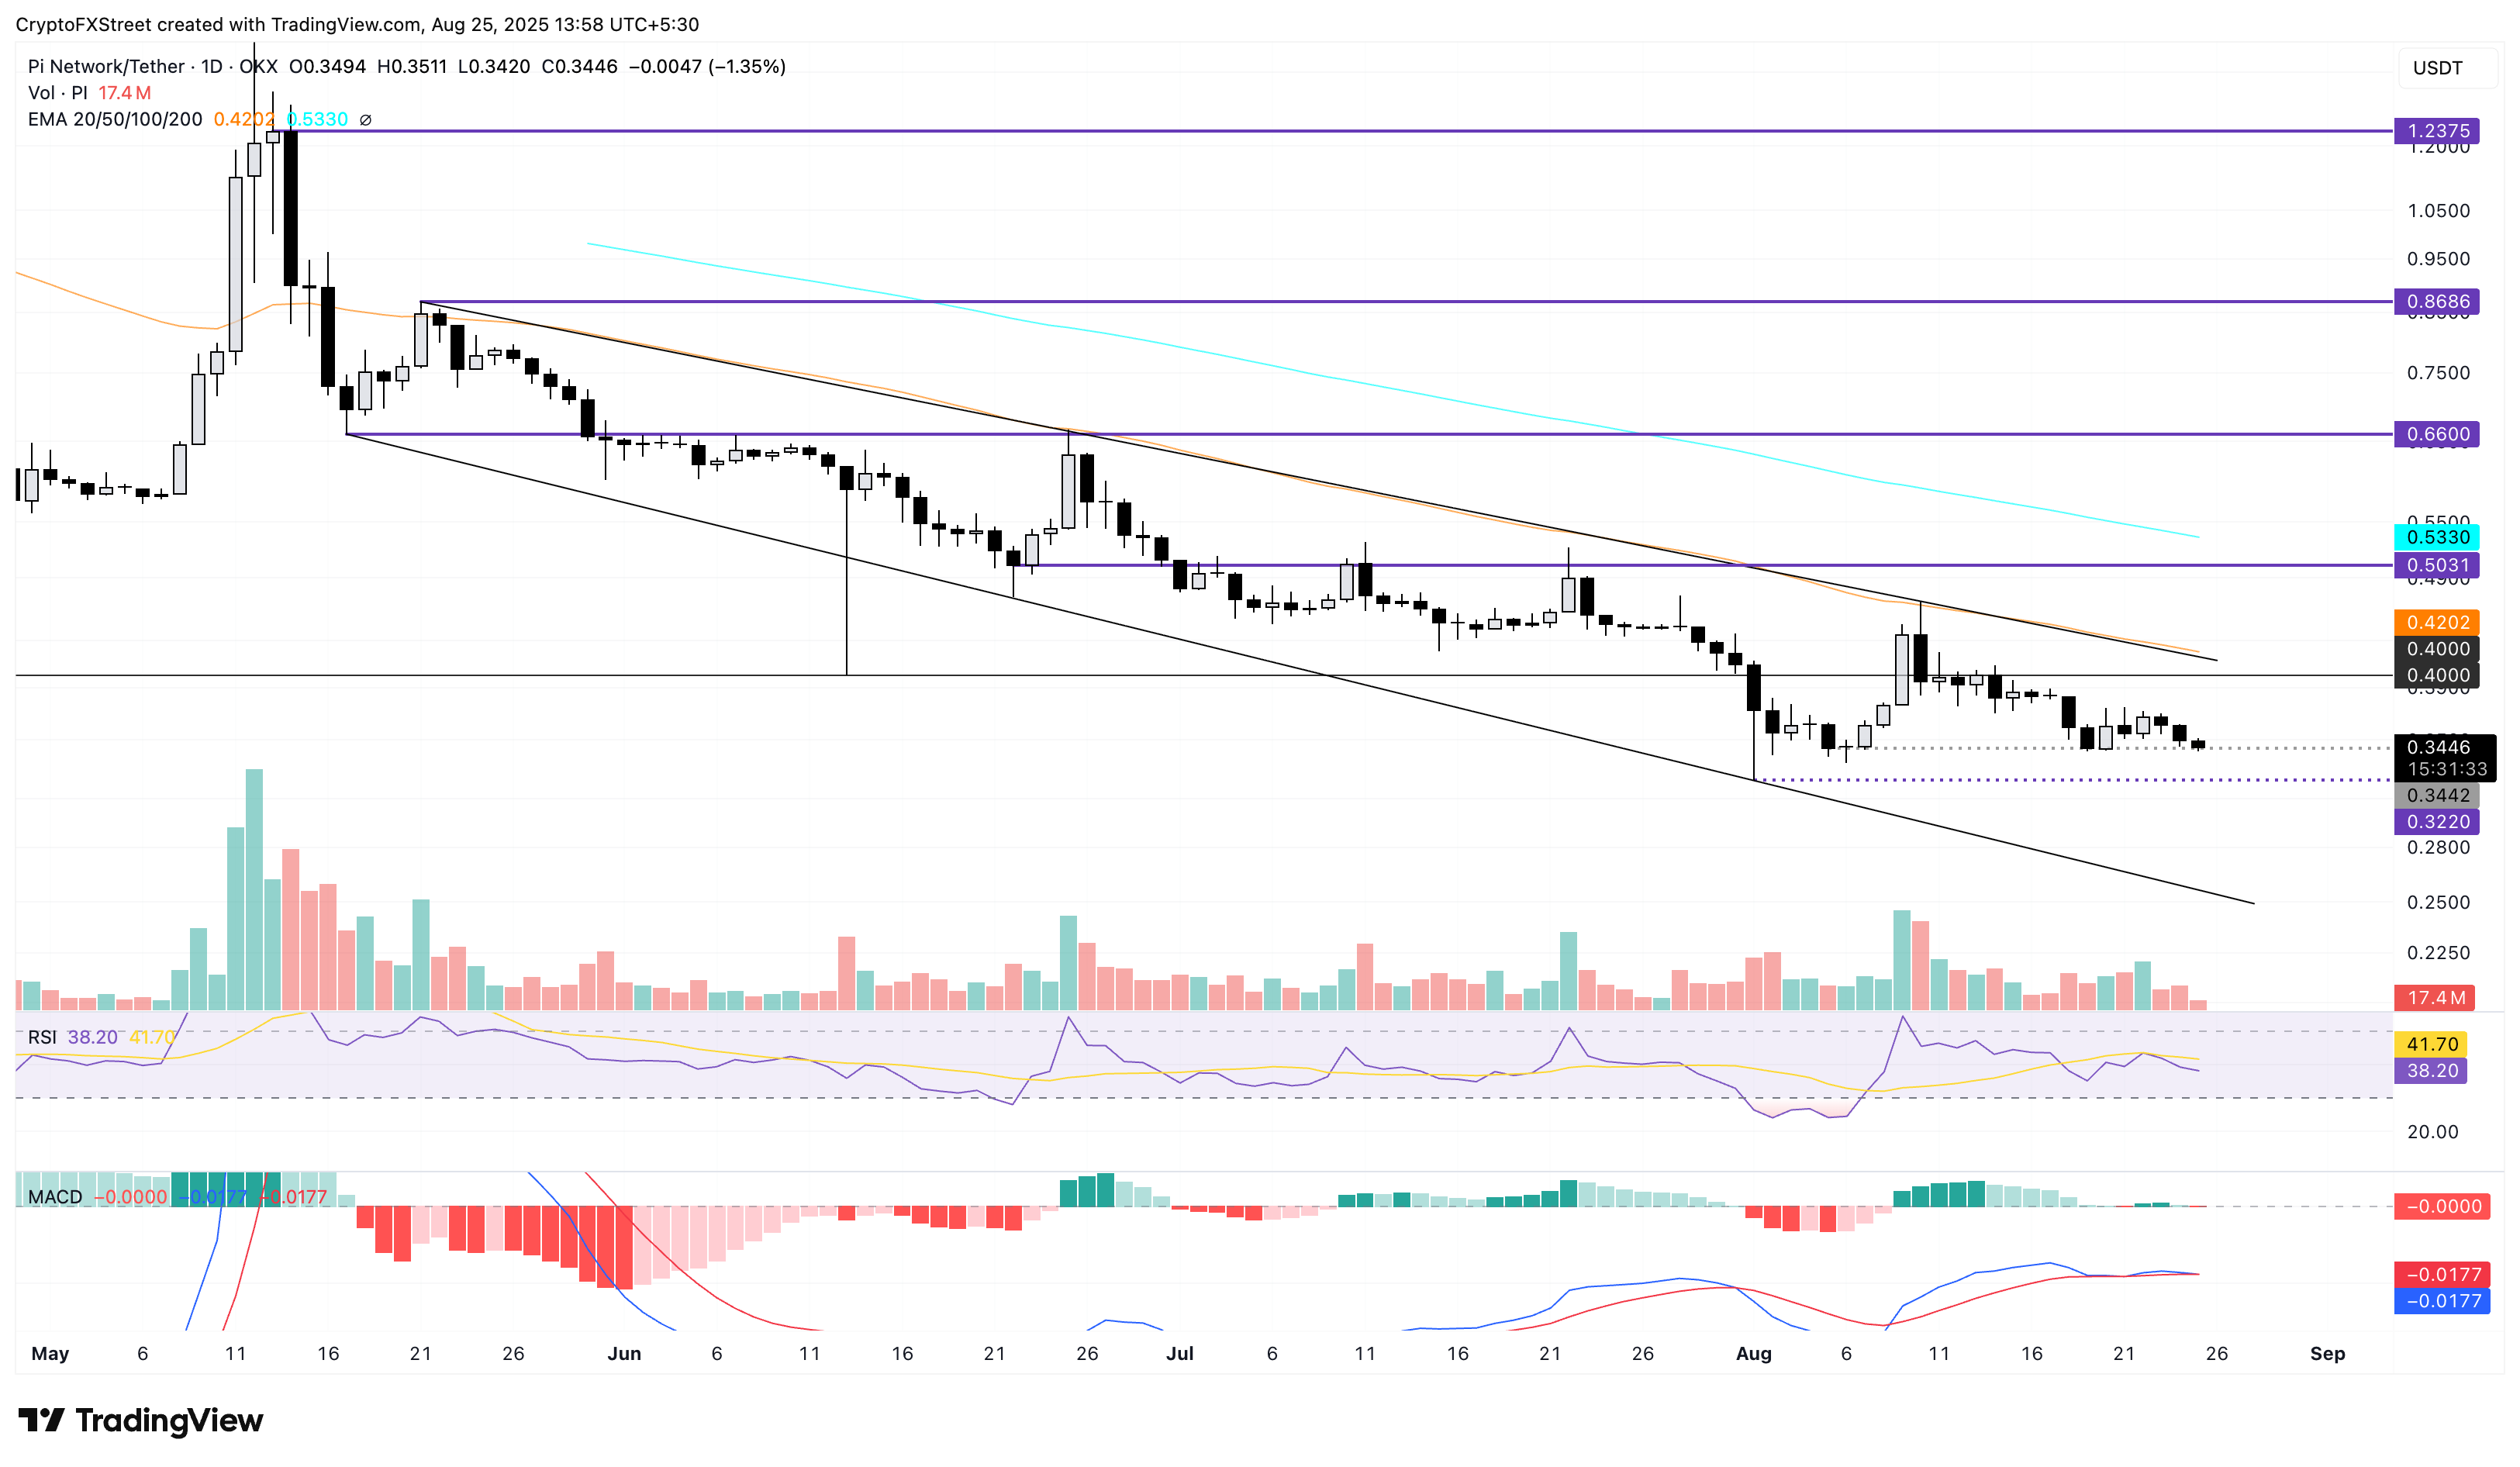
PI/USDT daily price chart.
Looking up, a potential rebound from the $0.3442 support level could retest the 50-day Exponential Moving Average (EMA), which roughly coincides with the downtrend resistance of the falling channel pattern, at $0.4202.
Open Interest, funding rate FAQs
Higher Open Interest is associated with higher liquidity and new capital inflow to the market. This is considered the equivalent of increase in efficiency and the ongoing trend continues. When Open Interest decreases, it is considered a sign of liquidation in the market, investors are leaving and the overall demand for an asset is on a decline, fueling a bearish sentiment among investors.
Funding fees bridge the difference between spot prices and prices of futures contracts of an asset by increasing liquidation risks faced by traders. A consistently high and positive funding rate implies there is a bullish sentiment among market participants and there is an expectation of a price hike. A consistently negative funding rate for an asset implies a bearish sentiment, indicating that traders expect the cryptocurrency’s price to fall and a bearish trend reversal is likely to occur.

FXStreet
100만 명이 넘는 사용자가 FXStreet를 통해 실시간 시장 데이터, 차트 도구, 전문가 인사이트, 포렉스 뉴스를 이용합니다. 포괄적인 경제 캘린더와 교육 웨비나는 트레이더가 정보를 유지하고 신중한 결정을 내리도록 돕습니다. FXStreet는 바르셀로나 본사와 전 세계 지역에 걸쳐 약 60명의 팀으로 구성되어 있습니다.
Read More


