
Trade The World
Pi Network Price Forecast: Recovery at risk as core team wallets shift 100 million PI tokens
작성자 Vishal Dixit
게시일: 13 Oct 2025 | 수정일: 13 Oct 2025


POPULAR ARTICLES

Pi Network (PI) edges higher by 4% at press time on Monday, extending its recovery for the third consecutive day after bouncing off the $0.2000 psychological level.
- Pi Network bounces off a psychological level for its third consecutive day of recovery.
- Outflows from the Pi Network Foundation wallet and Liquidity reserve risk additional supply pressure.
- Technical outlook flashes downside risk as bearish momentum persists.
Pi Network (PI) edges higher by 4% at press time on Monday, extending its recovery for the third consecutive day after bouncing off the $0.2000 psychological level. Despite the short-term recovery, PI remains at risk of extended correction as outflows from the Pi Network Foundation wallet and liquidity reserve threaten further supply pressure.
Pi Network’s supply problem
Out of Pi Network’s 8.27 million circulating supply, the majority is off exchanges, according to PiScan data, which shows the total reserve of Centralized Exchanges (CEXs) at 417.20 million PI. This suggests that the majority of the selling pressure comes from off-exchange transactions.
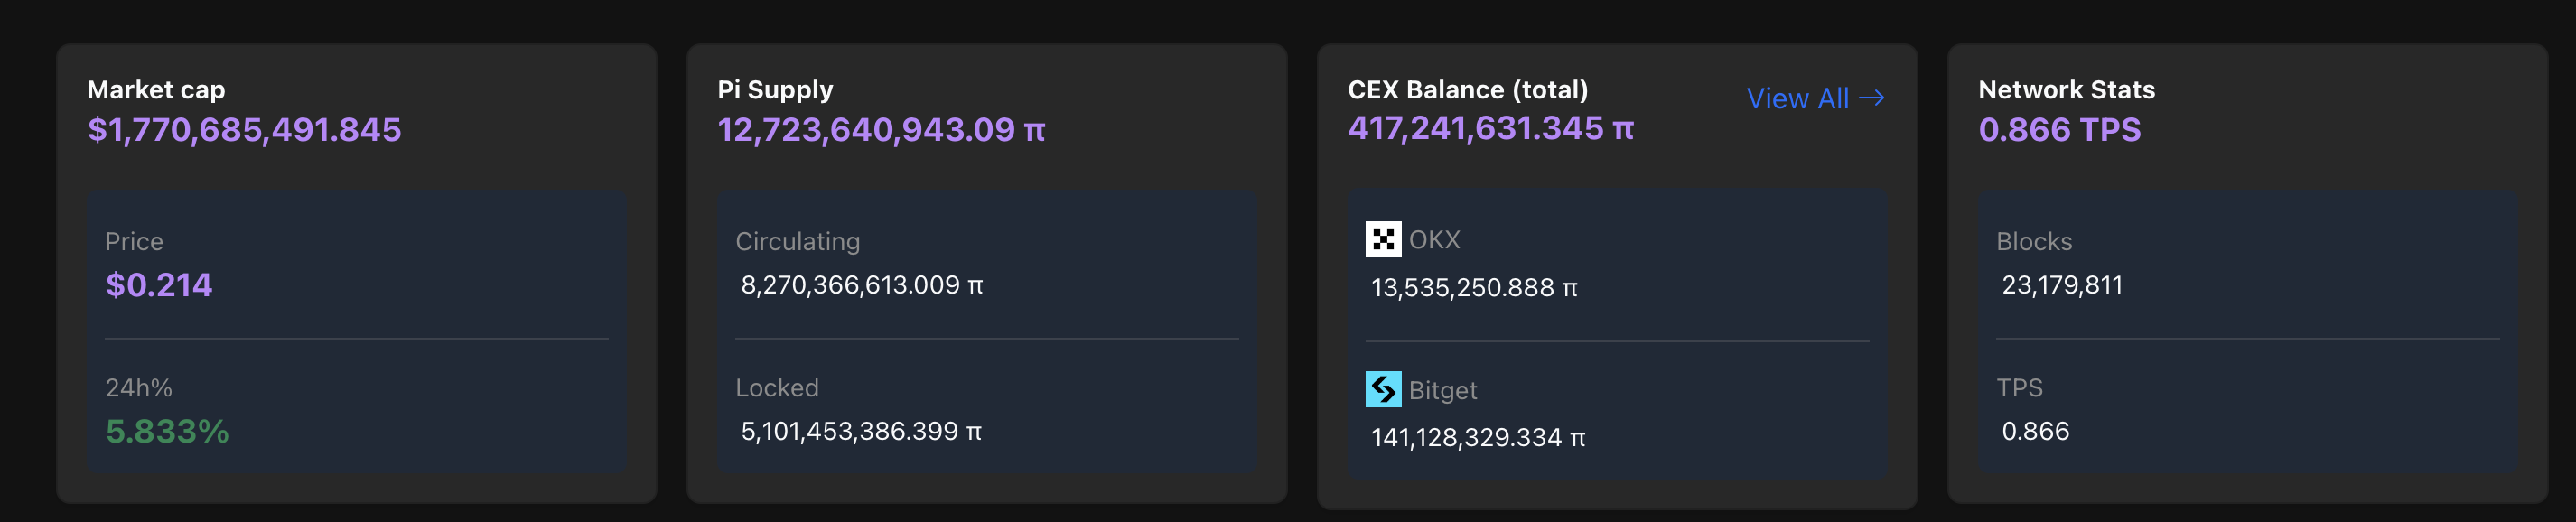
Pi Network metrics. Source: PiScan
The outflow of 50 million PI tokens from Pi Network Foundation wallet #11 on Sunday resulted in strategic distribution within the community via Foundation Wallet #2. At the same time, the 50 million PI outflow from the liquidity reserve remains stagnant in a different wallet at press time. This increased outflow activity from Pi core team wallets risks adding to the available supply.
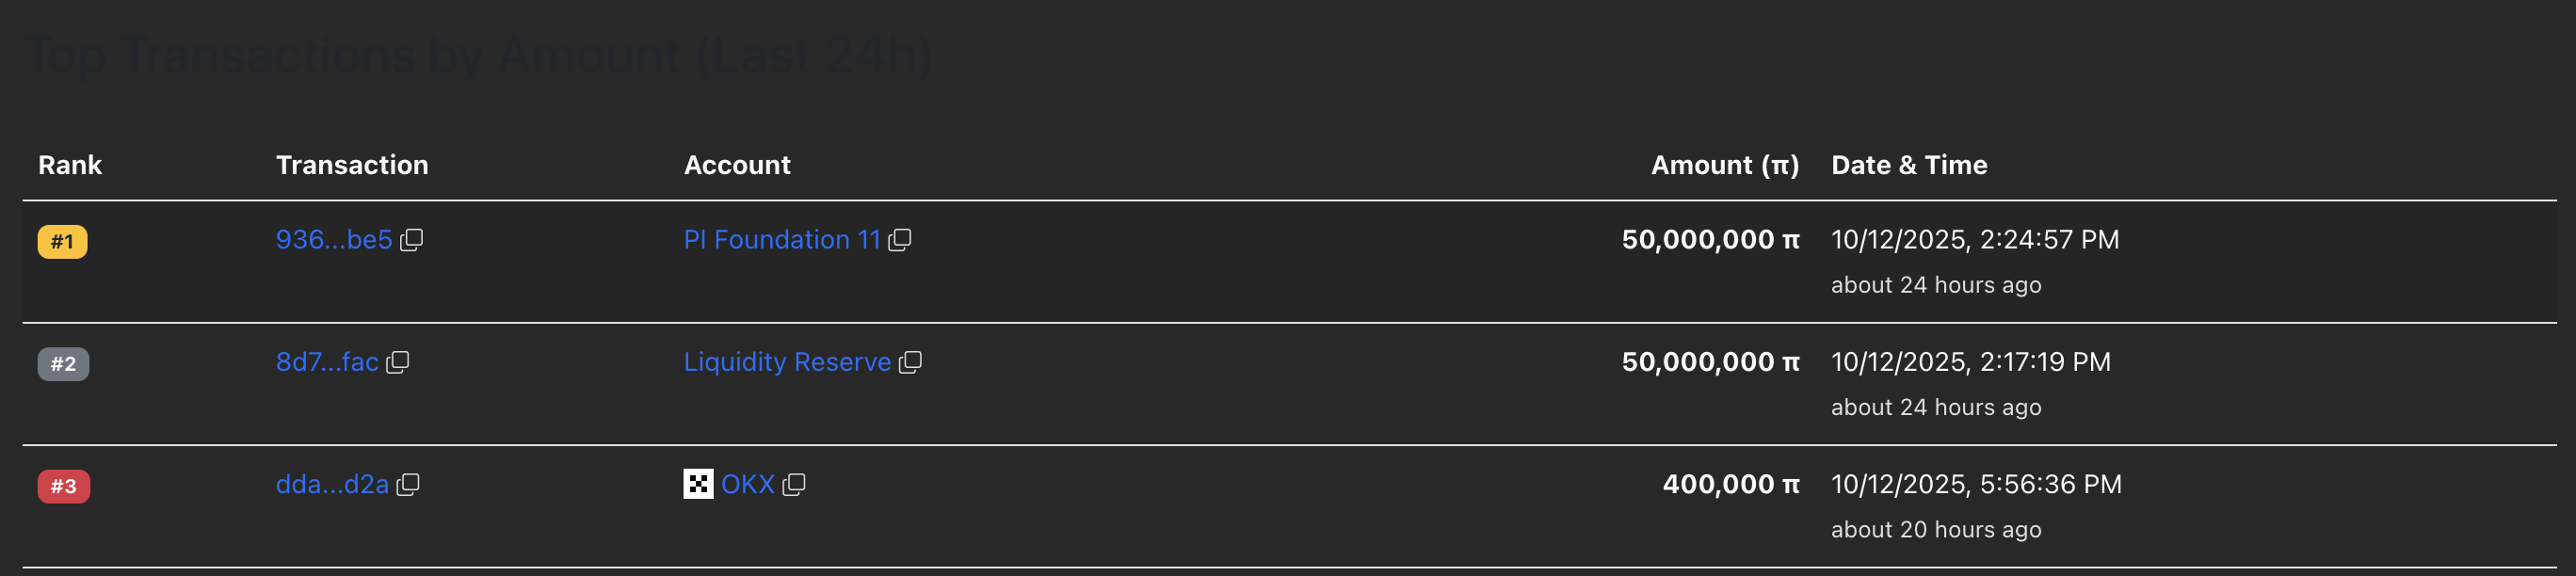
Pi Network transactions data. Source: PiScan
Technical Outlook: Will Pi Network extend the recovery?
Pi Network price dropped 13% on Friday, resulting in a fresh low of $0.1533 before retracing higher to close at $0.1996 on the day. At the time of writing, PI trades above $0.2150, hinting at a potential V-shaped reversal.
If the bounce back from the $0.2000 psychological level extends, PI could face a hurdle at $0.2755, marked by the centre Pivot Point level.
The Relative Strength Index (RSI) reads 28 on the daily chart, reversing within the oversold zone while the selling pressure remains heightened. The Moving Average Convergence Divergence (MACD) on the same chart inches closer to its signal line while maintaining a declining trend, hinting at a potential crossover. If MACD crosses above the signal line, it would flash a positive shift in trend momentum that could signal extended recovery.
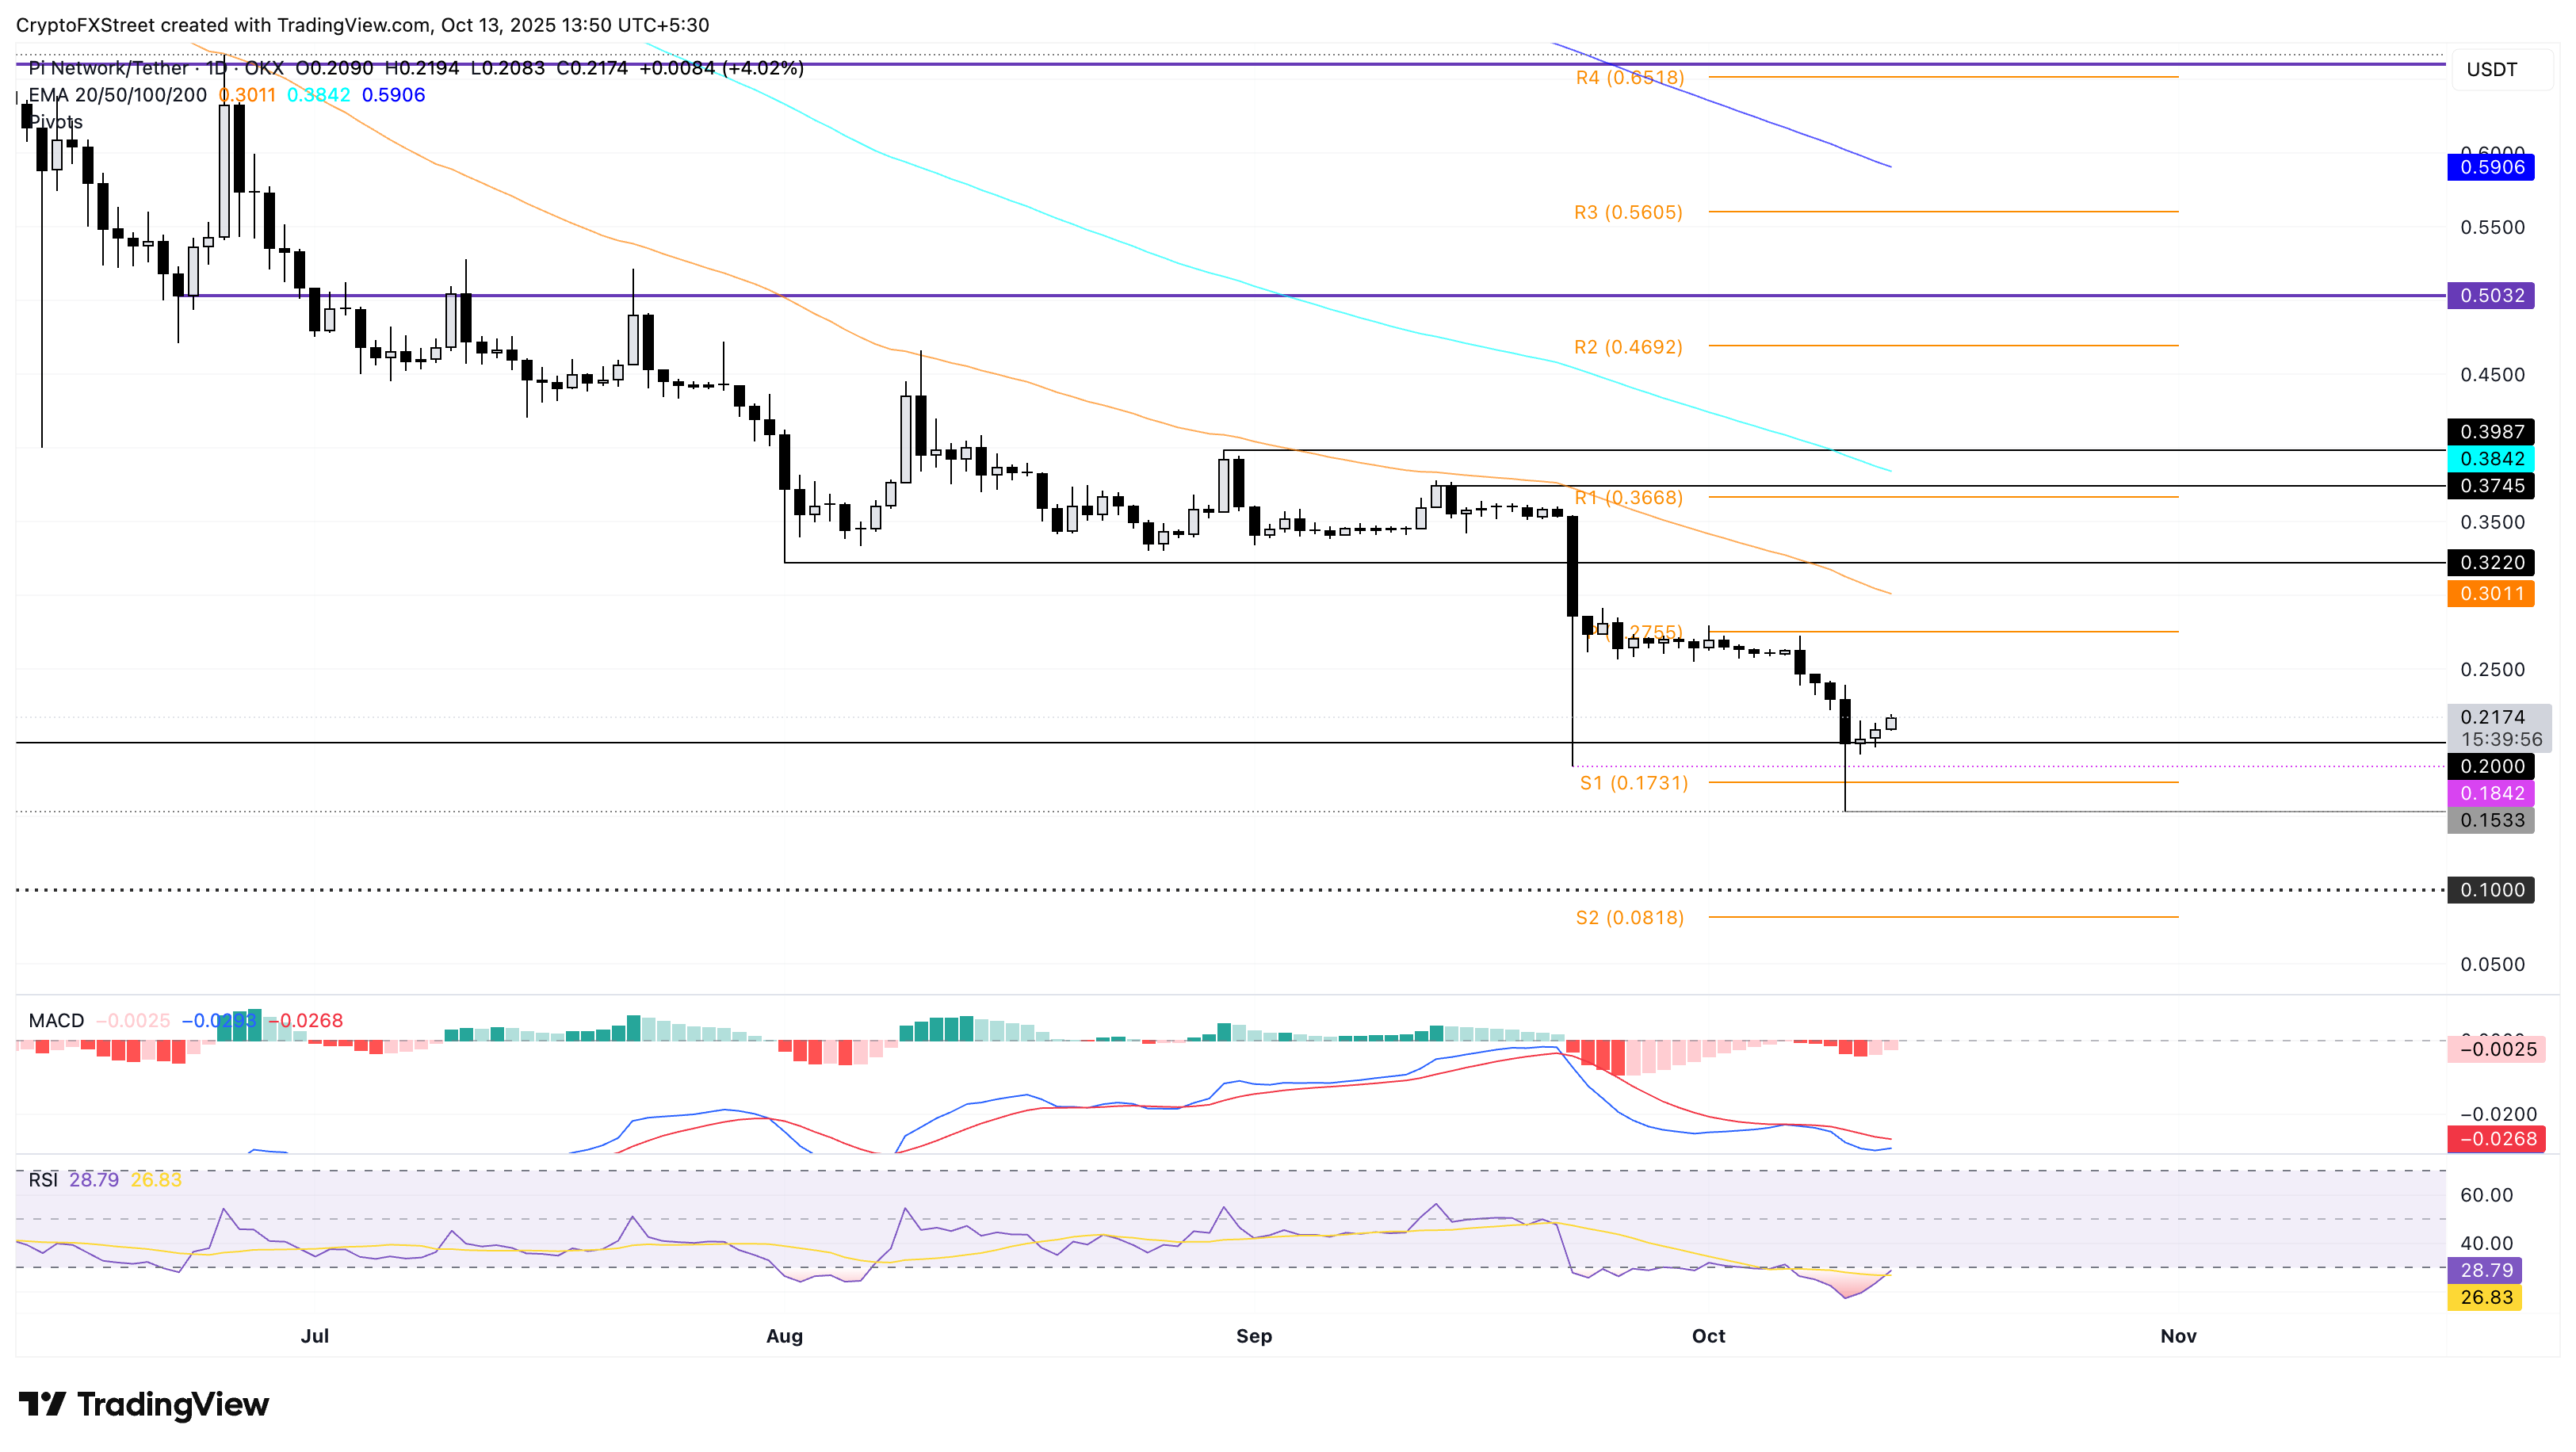
PI/USDT daily price chart.
Looking down, crucial support levels for Pi Network remain at the $0.2000 psychological level and the S1 Pivot Point level at $0.1731.
Cryptocurrency prices FAQs
Token launches influence demand and adoption among market participants. Listings on crypto exchanges deepen the liquidity for an asset and add new participants to an asset’s network. This is typically bullish for a digital asset.
A hack is an event in which an attacker captures a large volume of the asset from a DeFi bridge or hot wallet of an exchange or any other crypto platform via exploits, bugs or other methods. The exploiter then transfers these tokens out of the exchange platforms to ultimately sell or swap the assets for other cryptocurrencies or stablecoins. Such events often involve an en masse panic triggering a sell-off in the affected assets.
Macroeconomic events like the US Federal Reserve’s decision on interest rates influence crypto assets mainly through the direct impact they have on the US Dollar. An increase in interest rate typically negatively influences Bitcoin and altcoin prices, and vice versa. If the US Dollar index declines, risk assets and associated leverage for trading gets cheaper, in turn driving crypto prices higher.
Halvings are typically considered bullish events as they slash the block reward in half for miners, constricting the supply of the asset. At consistent demand if the supply reduces, the asset’s price climbs.

FXStreet
100만 명이 넘는 사용자가 FXStreet를 통해 실시간 시장 데이터, 차트 도구, 전문가 인사이트, 포렉스 뉴스를 이용합니다. 포괄적인 경제 캘린더와 교육 웨비나는 트레이더가 정보를 유지하고 신중한 결정을 내리도록 돕습니다. FXStreet는 바르셀로나 본사와 전 세계 지역에 걸쳐 약 60명의 팀으로 구성되어 있습니다.
Read More


