
Trade The World
Pi Network Price Forecast: On-exchange outflows suggest demand surge
작성자 Vishal Dixit
게시일: 17 Oct 2025 | 수정일: 17 Oct 2025


POPULAR ARTICLES

Pi Network (PI) trades above $0.20 at press time on Friday, with a largely muted price movement in comparison to the broader market volatility.
- Pi Network holds at $0.20 level, making muted moves amid the broader market pullback.
- The technical indicators suggest a decline in selling pressure.
- Pi Network’s CEXs' reserves recorded a net outflow of 2.58 million PI in the last 24 hours.
Pi Network (PI) trades above $0.20 at press time on Friday, with a largely muted price movement in comparison to the broader market volatility. Amid the struggles to hold the gains made on the previous weekend, net outflows from the Pi Network’s Centralized Exchanges (CEXs) reserves signal buying dominance, signaling supply pressure coming from off-exchange transactions.
On-exchange demand sustains as external pressure offloads supply
The small list of CEXs listing Pi Network’s PI token witnesses a rise in demand, while the selling pressure persists. PiScan data shows a net outflow of 2.58 million PI tokens from CEXs' wallet balances in the last 24 hours. Typically, an outflow in exchange reserves signals a reduction in selling pressure.
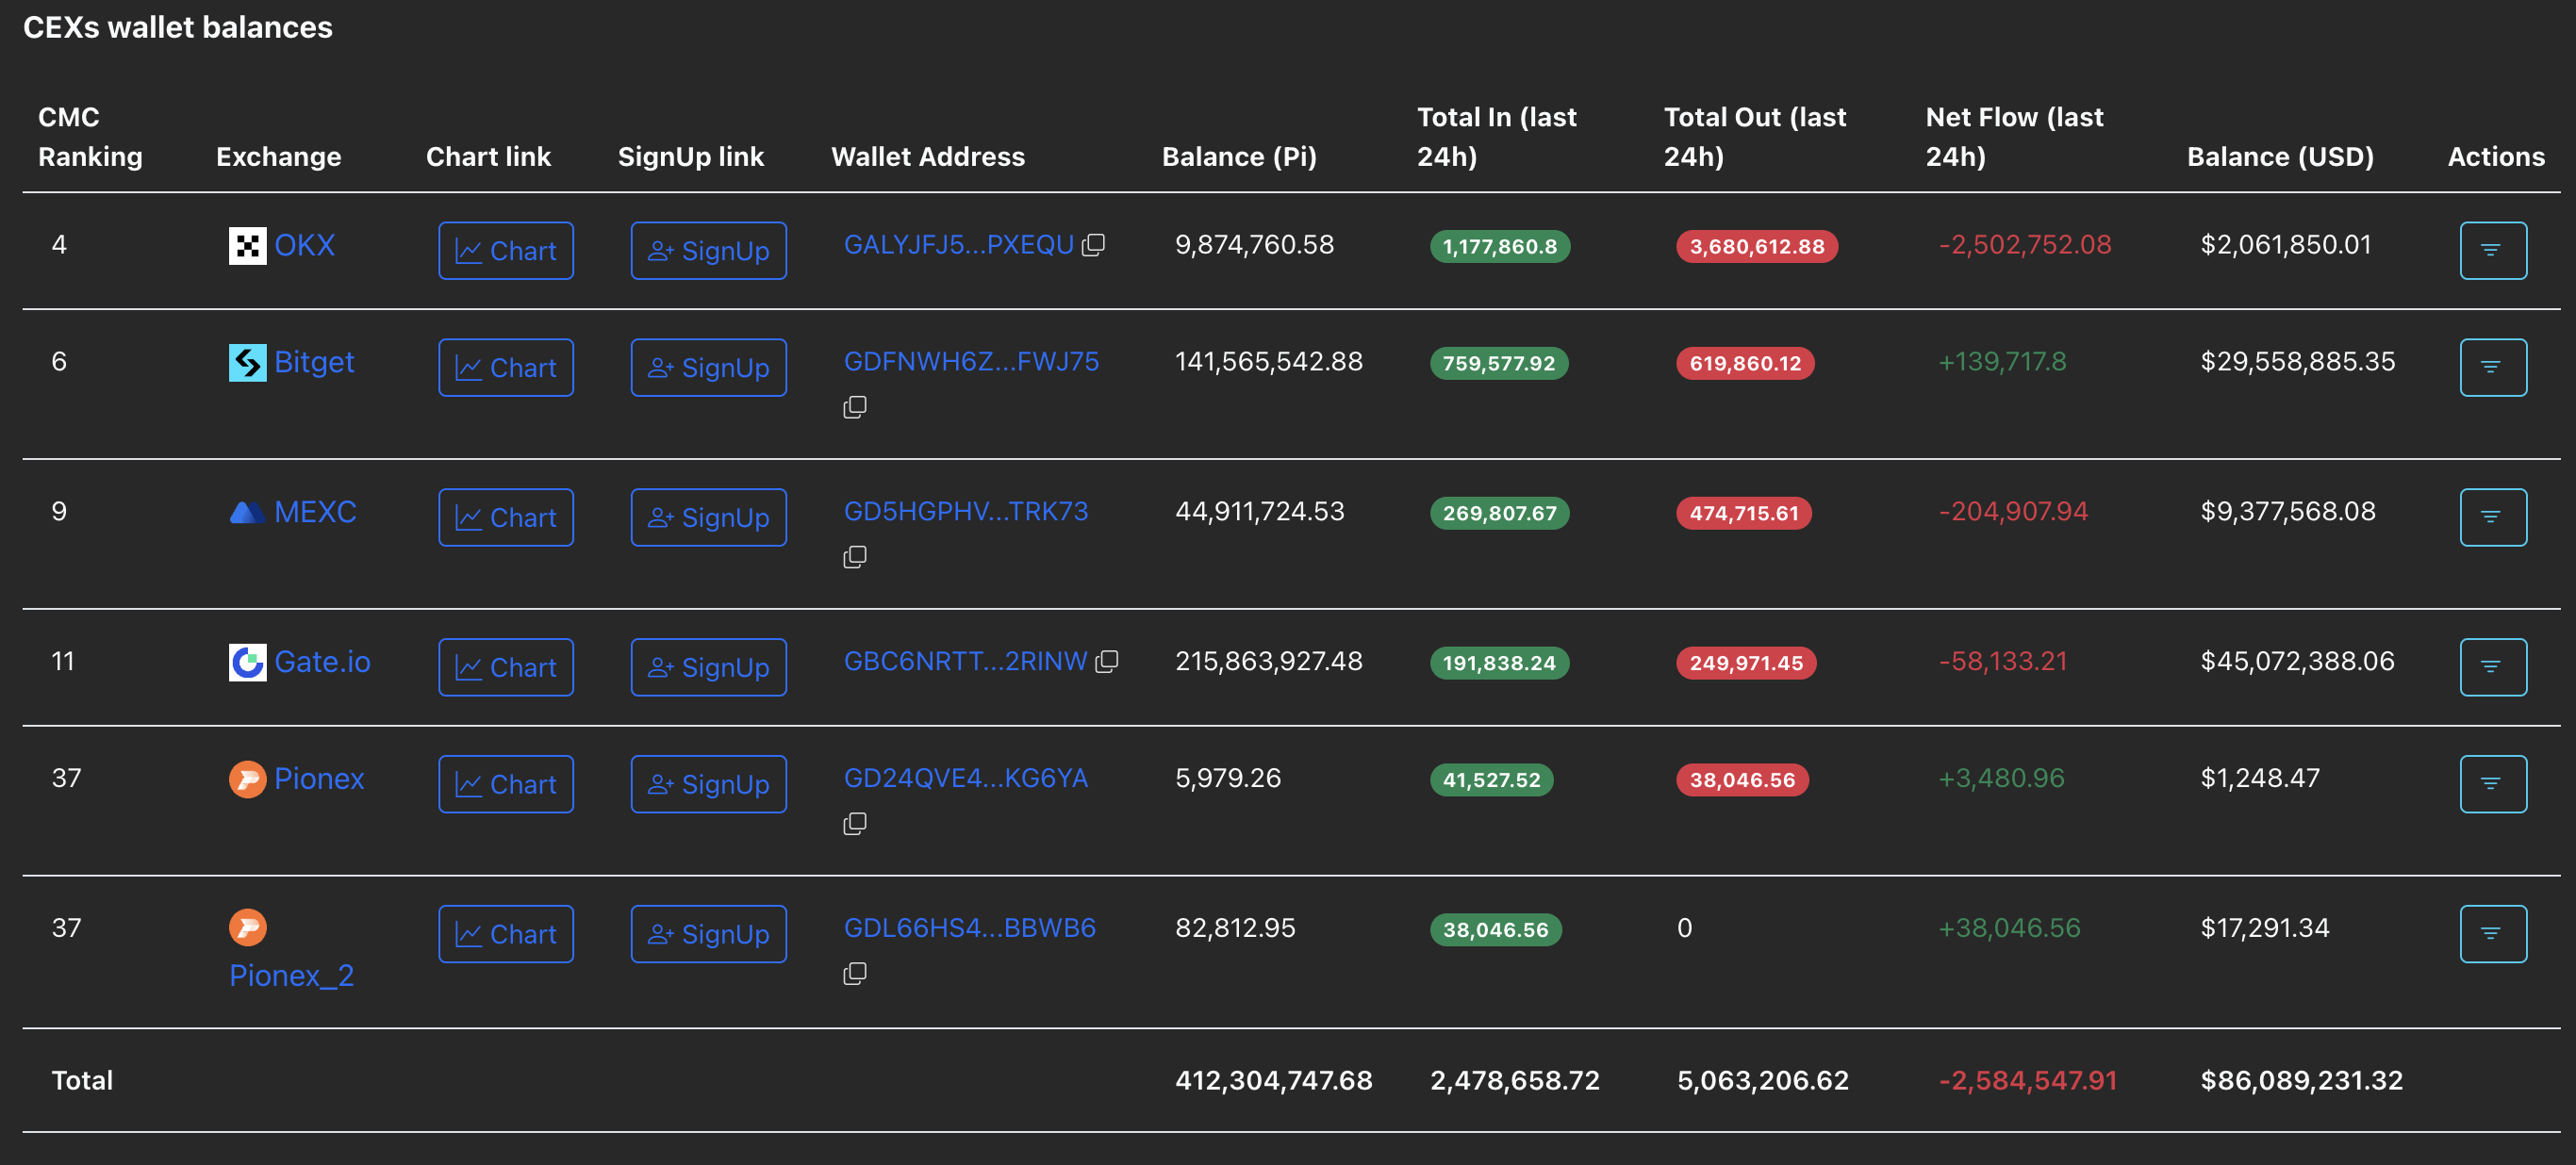
CEXs wallet balances. Source: PiScan
However, as mentioned previously by FXStreet, the majority of PI tokens remain off exchange, which makes it difficult to track the supply flow. Still, the ongoing correction spree is largely driven by off-exchange sell-offs, as CEXs' wallet balances rarely record inflows.
Technical outlook: Will Pi Network rebound as selling pressure wanes?
Pi Network edges higher by 1% at press time on Friday, after three consecutive days of losses. The PI token holding above the $0.20 psychological support level provides a buffer phase amid the risk of a steeper correction.
The mobile mining cryptocurrency maintains a rather sideways trend within the October 10 candle, ranging from $0.2295 to $0.1996. A decisive close below the $0.1996 could test the S1 Pivot Point level at $0.1731.
The Moving Average Convergence Divergence (MACD) converges with its signal line, indicating a decline in selling pressure. A potential crossover above its signal line would flash a rise in bullish momentum.
The Relative Strength Index (RSI) reads 29, recovering within the oversold zone, indicating a potential reversal as overhead pressure nears saturation.
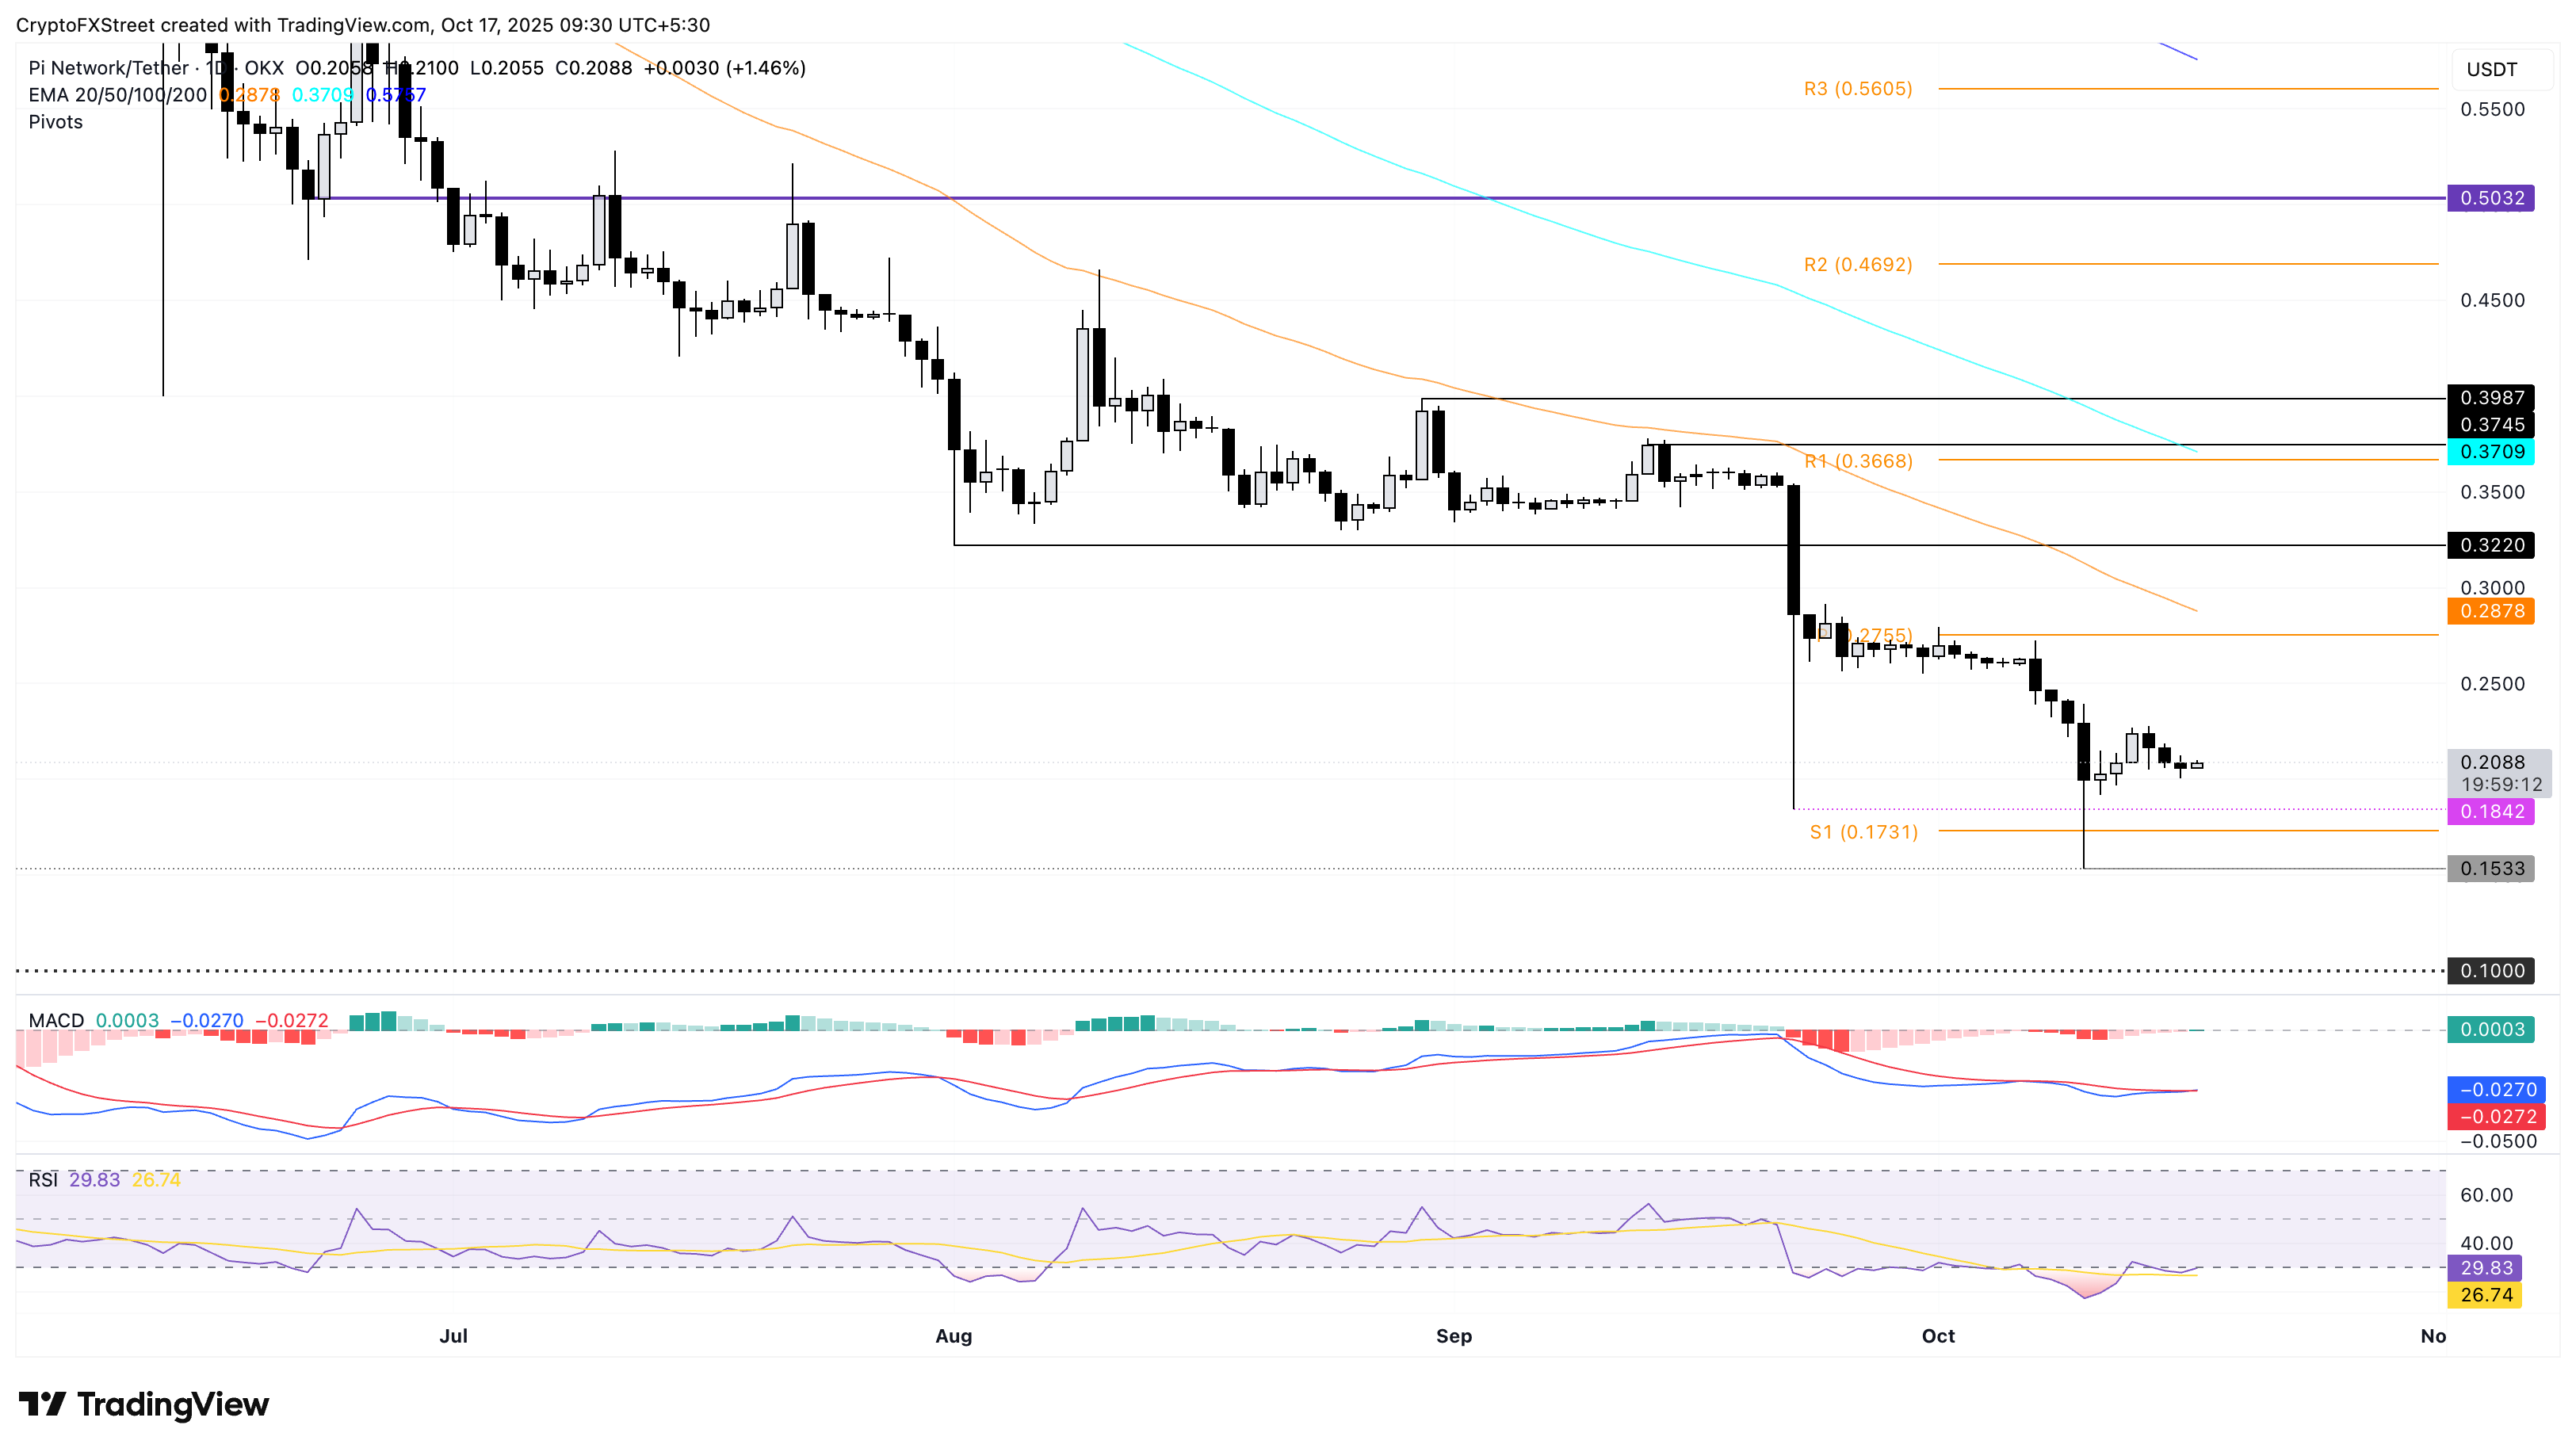
PI/USDT daily price chart.
Looking up, PI should exceed the $0.2295 level to reinforce a recovery to the centre Pivot Point level at $0.2755.
Cryptocurrency prices FAQs
Token launches influence demand and adoption among market participants. Listings on crypto exchanges deepen the liquidity for an asset and add new participants to an asset’s network. This is typically bullish for a digital asset.
A hack is an event in which an attacker captures a large volume of the asset from a DeFi bridge or hot wallet of an exchange or any other crypto platform via exploits, bugs or other methods. The exploiter then transfers these tokens out of the exchange platforms to ultimately sell or swap the assets for other cryptocurrencies or stablecoins. Such events often involve an en masse panic triggering a sell-off in the affected assets.
Macroeconomic events like the US Federal Reserve’s decision on interest rates influence crypto assets mainly through the direct impact they have on the US Dollar. An increase in interest rate typically negatively influences Bitcoin and altcoin prices, and vice versa. If the US Dollar index declines, risk assets and associated leverage for trading gets cheaper, in turn driving crypto prices higher.
Halvings are typically considered bullish events as they slash the block reward in half for miners, constricting the supply of the asset. At consistent demand if the supply reduces, the asset’s price climbs.

FXStreet
100만 명이 넘는 사용자가 FXStreet를 통해 실시간 시장 데이터, 차트 도구, 전문가 인사이트, 포렉스 뉴스를 이용합니다. 포괄적인 경제 캘린더와 교육 웨비나는 트레이더가 정보를 유지하고 신중한 결정을 내리도록 돕습니다. FXStreet는 바르셀로나 본사와 전 세계 지역에 걸쳐 약 60명의 팀으로 구성되어 있습니다.
Read More


