
Trade The World
Pi Network Price Forecast: Volume surges amid muted retail interest
작성자 Vishal Dixit
게시일: 5 Jan 2026 | 수정일: 5 Jan 2026


POPULAR ARTICLES

Pi Network (PI) holds steady above $0.2100 at press time on Monday, after a six-day recovery run amid broader crypto market gains driven by US-Venezuela tensions. Data shows limited social interest in PI despite rising trading volume.
- Pi Network approaches the 50-day EMA after six days of steady recovery, with bulls aiming for a breakout.
- Data shows muted social interest amid rising volume, a typical entry point of smart investors.
- The technical outlook for PI remains mixed, as the 50-day EMA continues to act as overhead resistance.
Pi Network (PI) holds steady above $0.2100 at press time on Monday, after a six-day recovery run amid broader crypto market gains driven by US-Venezuela tensions. Data shows limited social interest in PI despite rising trading volume. The technical outlook for PI remains mixed, as the 50-day Exponential Moving Average (EMA) serves as a key level of resistance.
Is smart money flowing toward Pi Network?
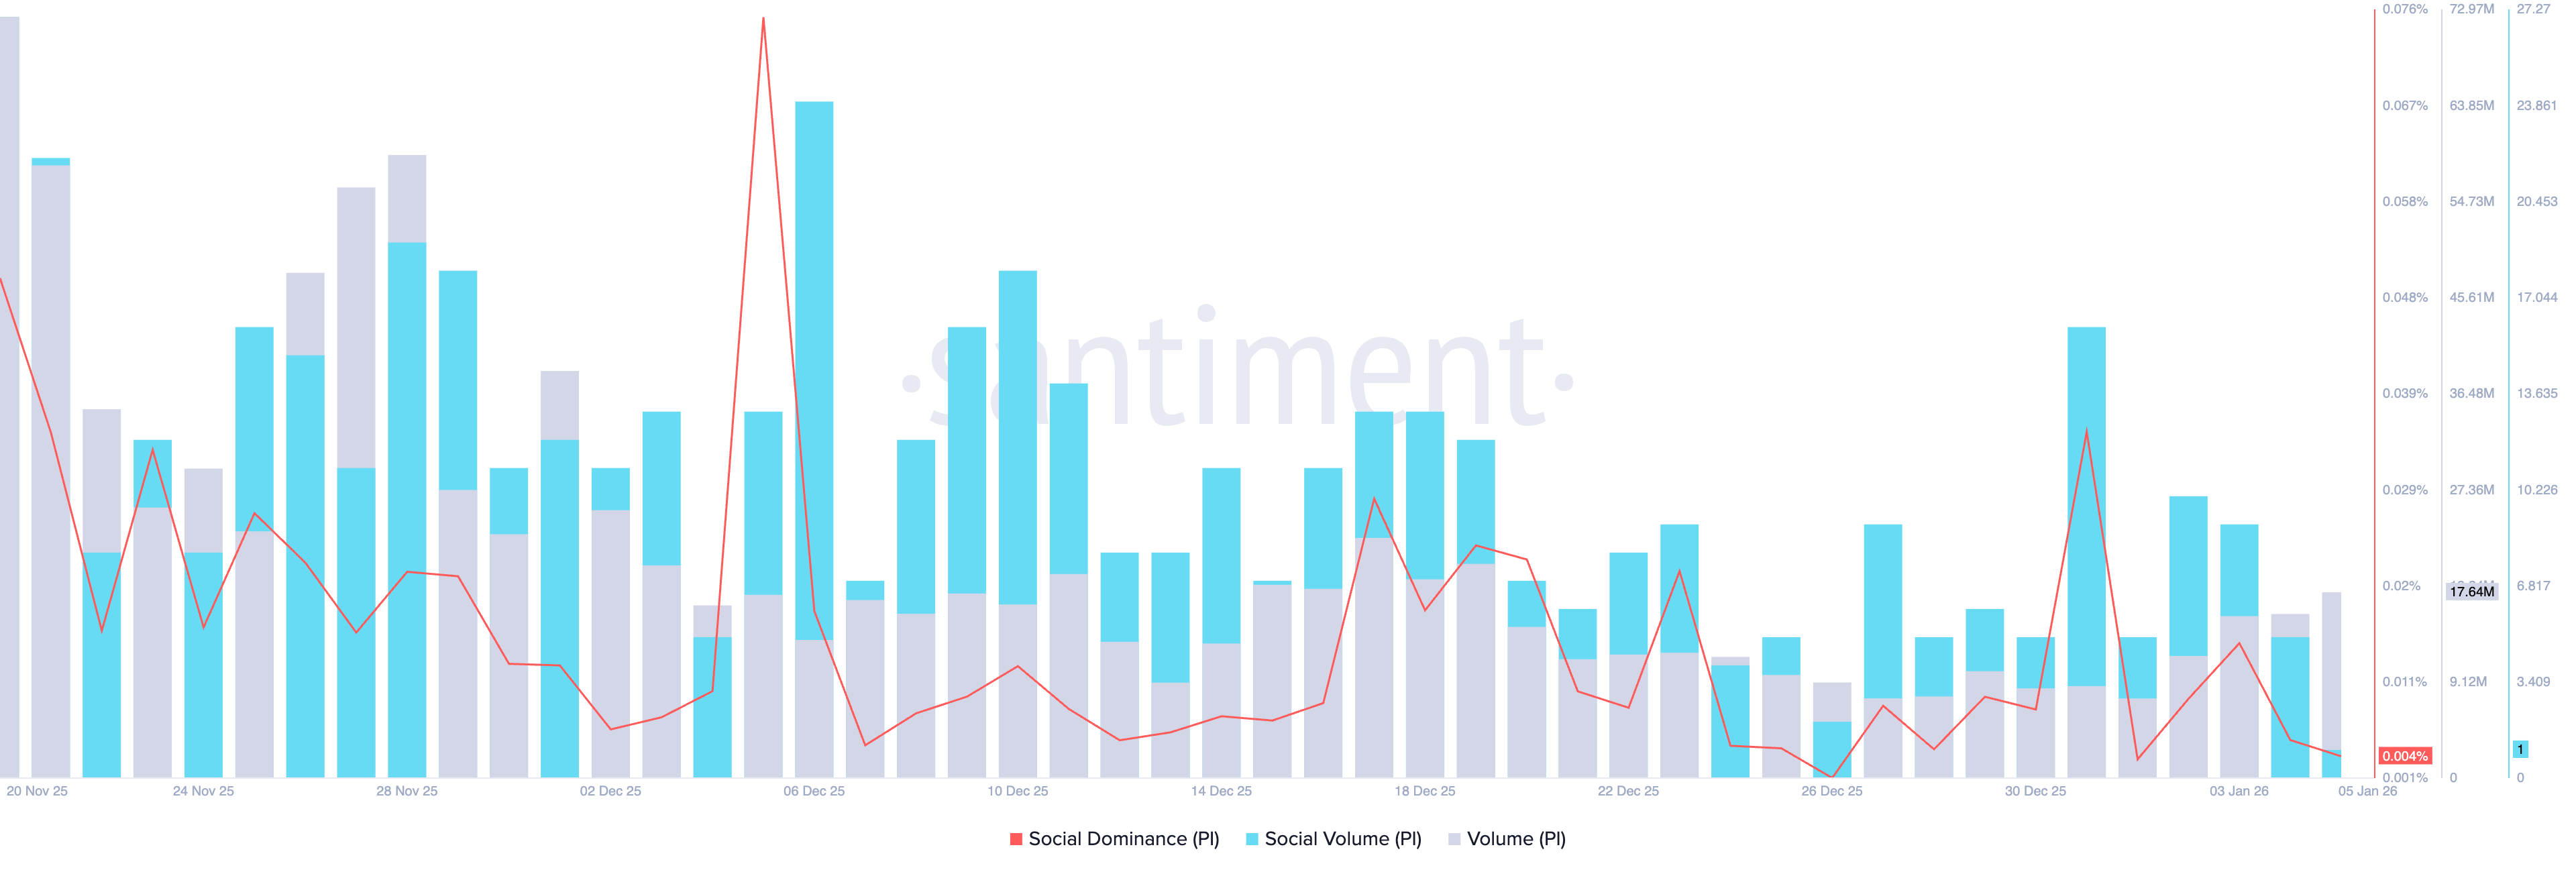
Santiment data shows that social dominance, which tracks the share of Pi Network in crypto media, falls to 0.004% on Monday, as social volume continues its declining trend. Despite limited retail interest, Pi Network's trading volume reached almost 18 million PI on Monday, the highest since December 18.
Typically, a surge in volume during price recovery reflects net buying, and a lack of retail demand points to a potential move by sophisticated investors anticipating a rebound.
Technical outlook: Will Pi Network surpass the 50-day EMA?
Pi Network struggles to extend toward the 50-day EMA at $0.2174, which roughly coincides with the December 19 high at $0.2177, as indicated by long wick candles over the weekend. Still, the recent recovery over the last week signals renewed buying pressure in the New Year.
If PI marks a decisive close above $0.2174, it could target the September 23 low at $0.2613, which served as a key support and resistance in October.
The momentum indicators on the daily chart corroborate the rise in bullish powers. The Relative Strength Index (RSI) is at 53, hovering above the halfway line, indicating a bullish tilt as selling pressure wanes. At the same time, the Moving Average Convergence Divergence (MACD) indicator steadies toward the zero line, accompanied by successively rising green histogram bars, suggesting a rise in bullish momentum.
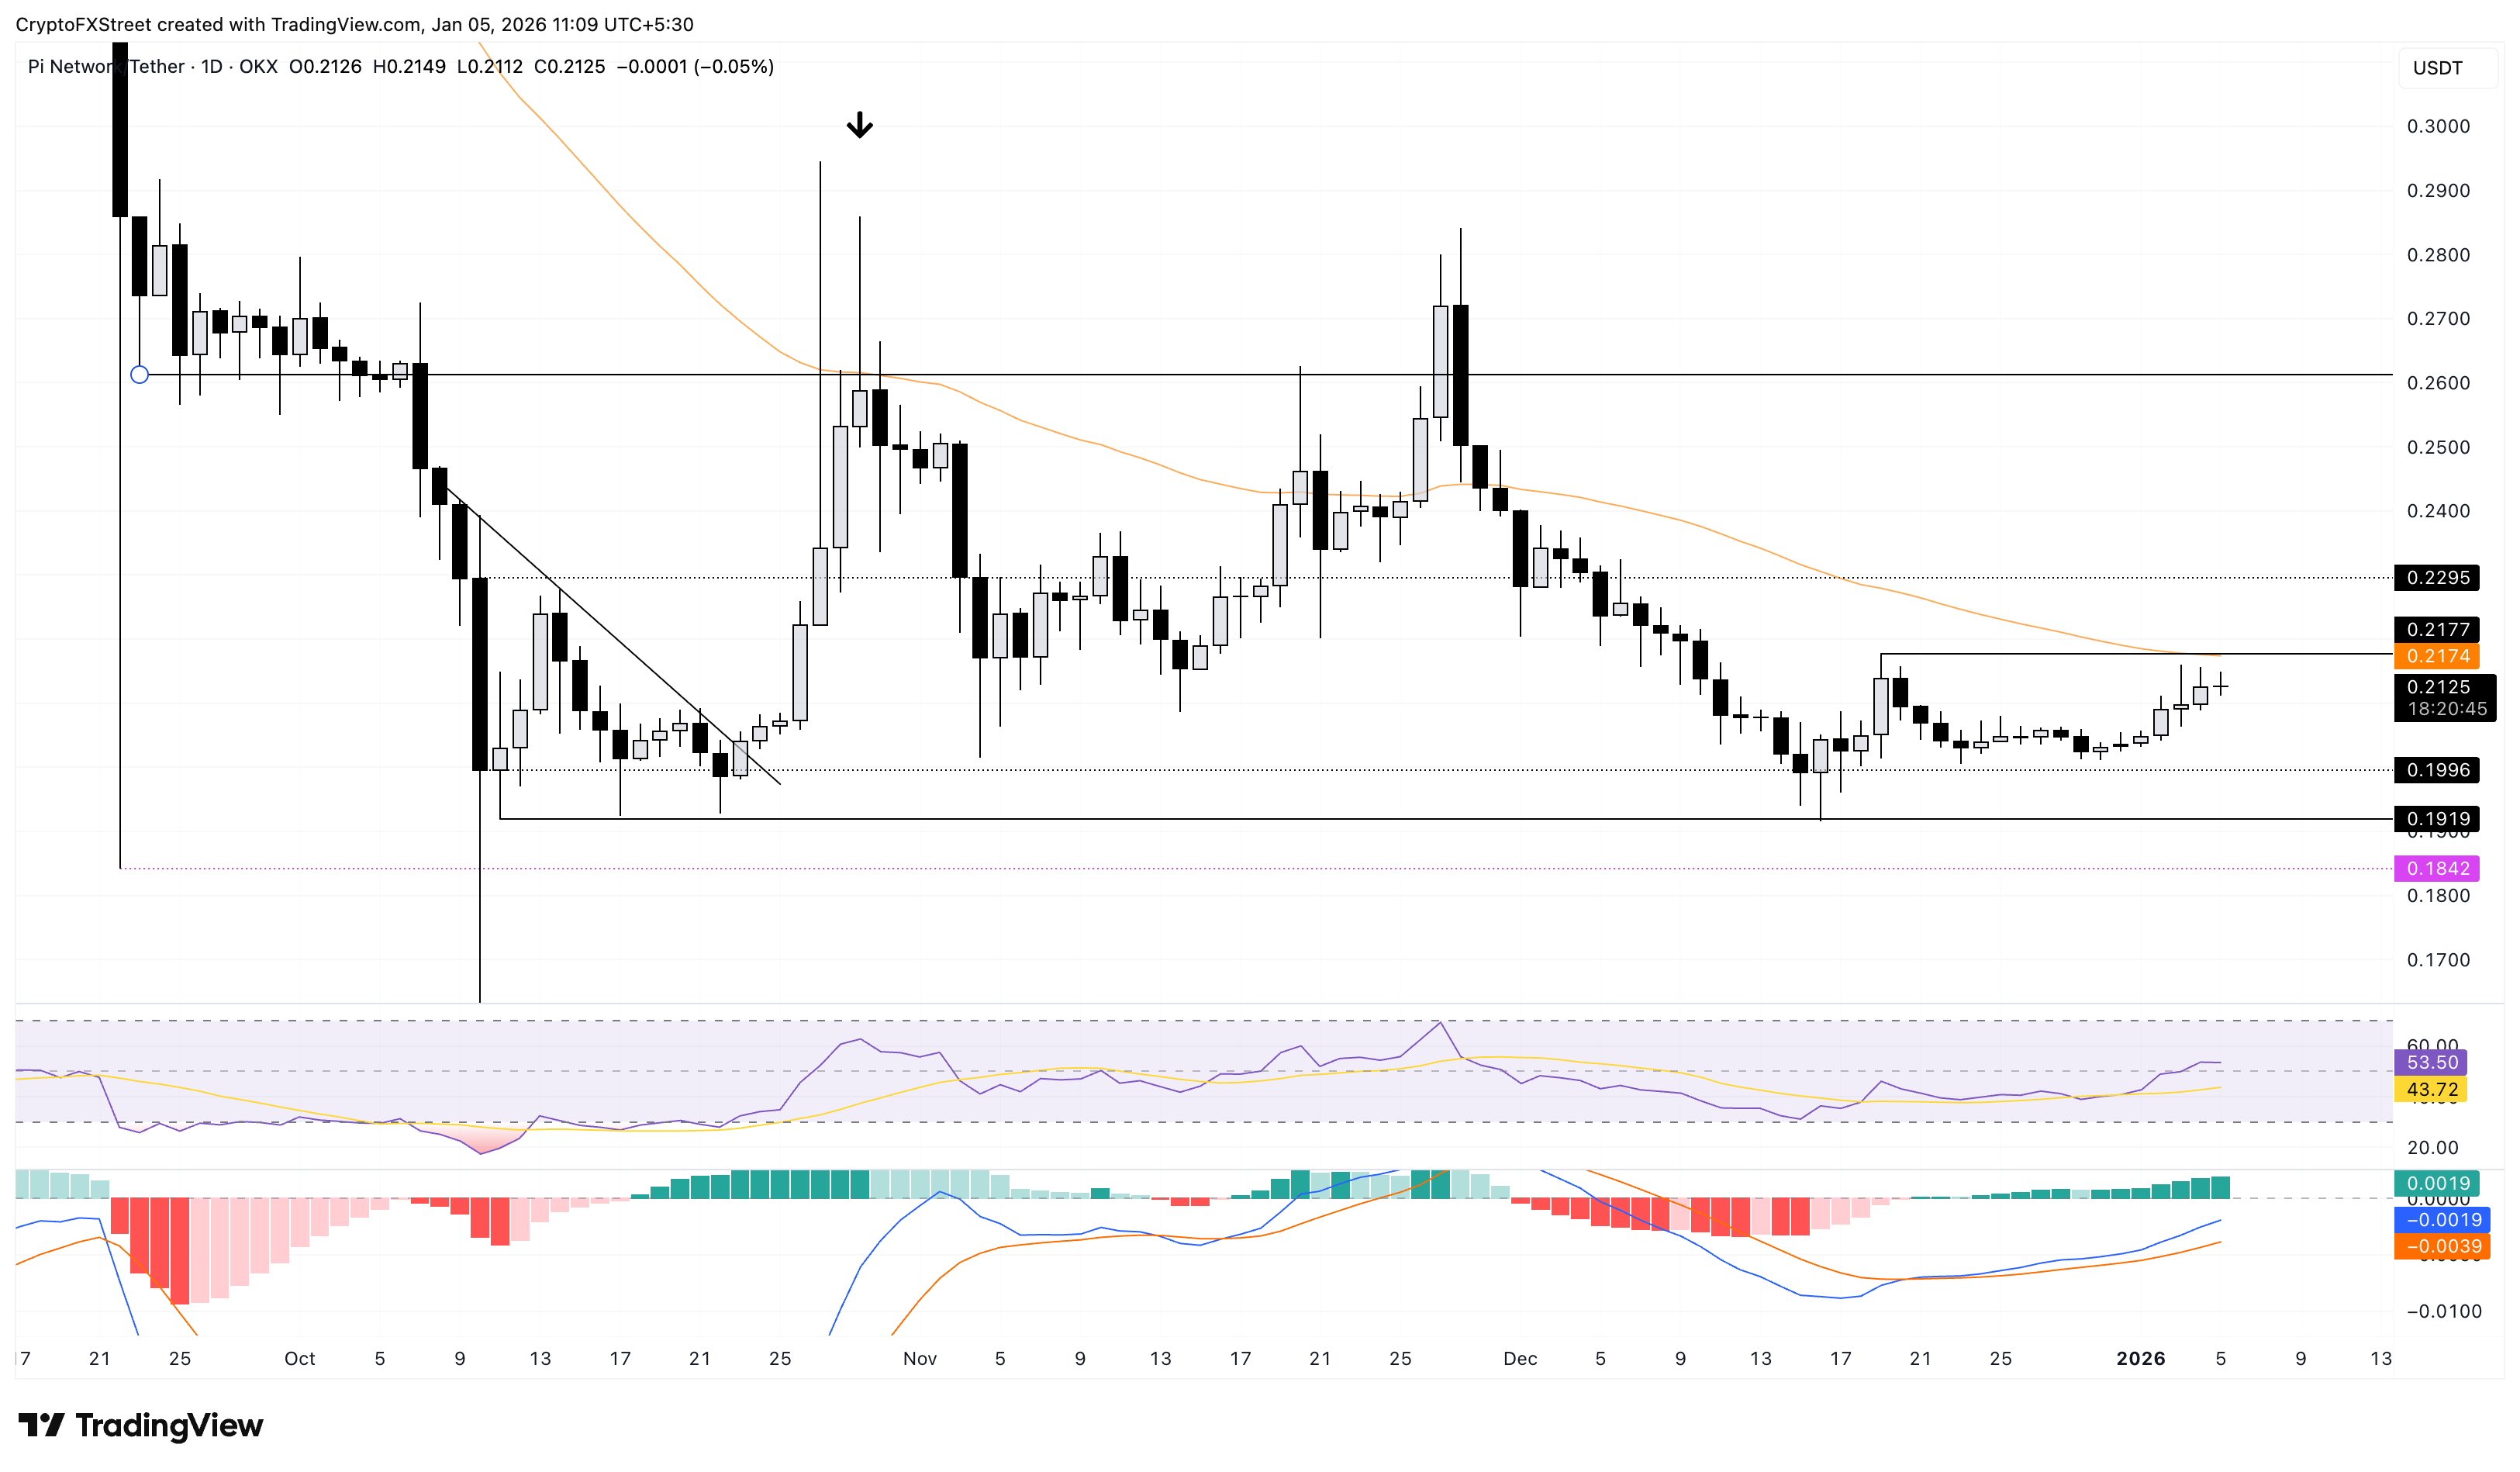
On the downside, a potential reversal in PI from $0.2174 could retest the $0.2000 psychological support.

FXStreet
100만 명이 넘는 사용자가 FXStreet를 통해 실시간 시장 데이터, 차트 도구, 전문가 인사이트, 포렉스 뉴스를 이용합니다. 포괄적인 경제 캘린더와 교육 웨비나는 트레이더가 정보를 유지하고 신중한 결정을 내리도록 돕습니다. FXStreet는 바르셀로나 본사와 전 세계 지역에 걸쳐 약 60명의 팀으로 구성되어 있습니다.
Read More


