
Trade The World
Pi Network Price Forecast: PI flashes bullish potential as breakout rally gains traction
작성자 Vishal Dixit
게시일: 11 Aug 2025 | 수정일: 11 Aug 2025


POPULAR ARTICLES
Pi Network (PI) edges higher by 3% at press time on Monday, holding above the $0.4000 level price broke from a bullish pattern breakout on Friday. Betting heavily on a bullish recovery, large wallet investors — popularly known as whales — buy in large quantities.
- Pi Network’s PI token breaks out of a repeating Adam and Eve pattern, hinting at a trend reversal.
- A large wallet investor that holds more PI than any individual exchange adds over 984,000 tokens.
- The technical outlook remains mixed as the spark of bullish momentum wanes.
Pi Network (PI) edges higher by 3% at press time on Monday, holding above the $0.4000 level price broke from a bullish pattern breakout on Friday. Betting heavily on a bullish recovery, large wallet investors — popularly known as whales — buy in large quantities.
Still, the technical outlook remains mixed as bullish momentum appears to be cooling down.
Whales buy the retest dip in Pi token
PiScan data shows that, out of the five largest transactions on Pi Network over the last 24 hours, four transactions include a whale acquiring PI tokens from the OKX exchange. In total, the whale buying spree grabbed over 2.25 million PI tokens worth approximately $901,500.
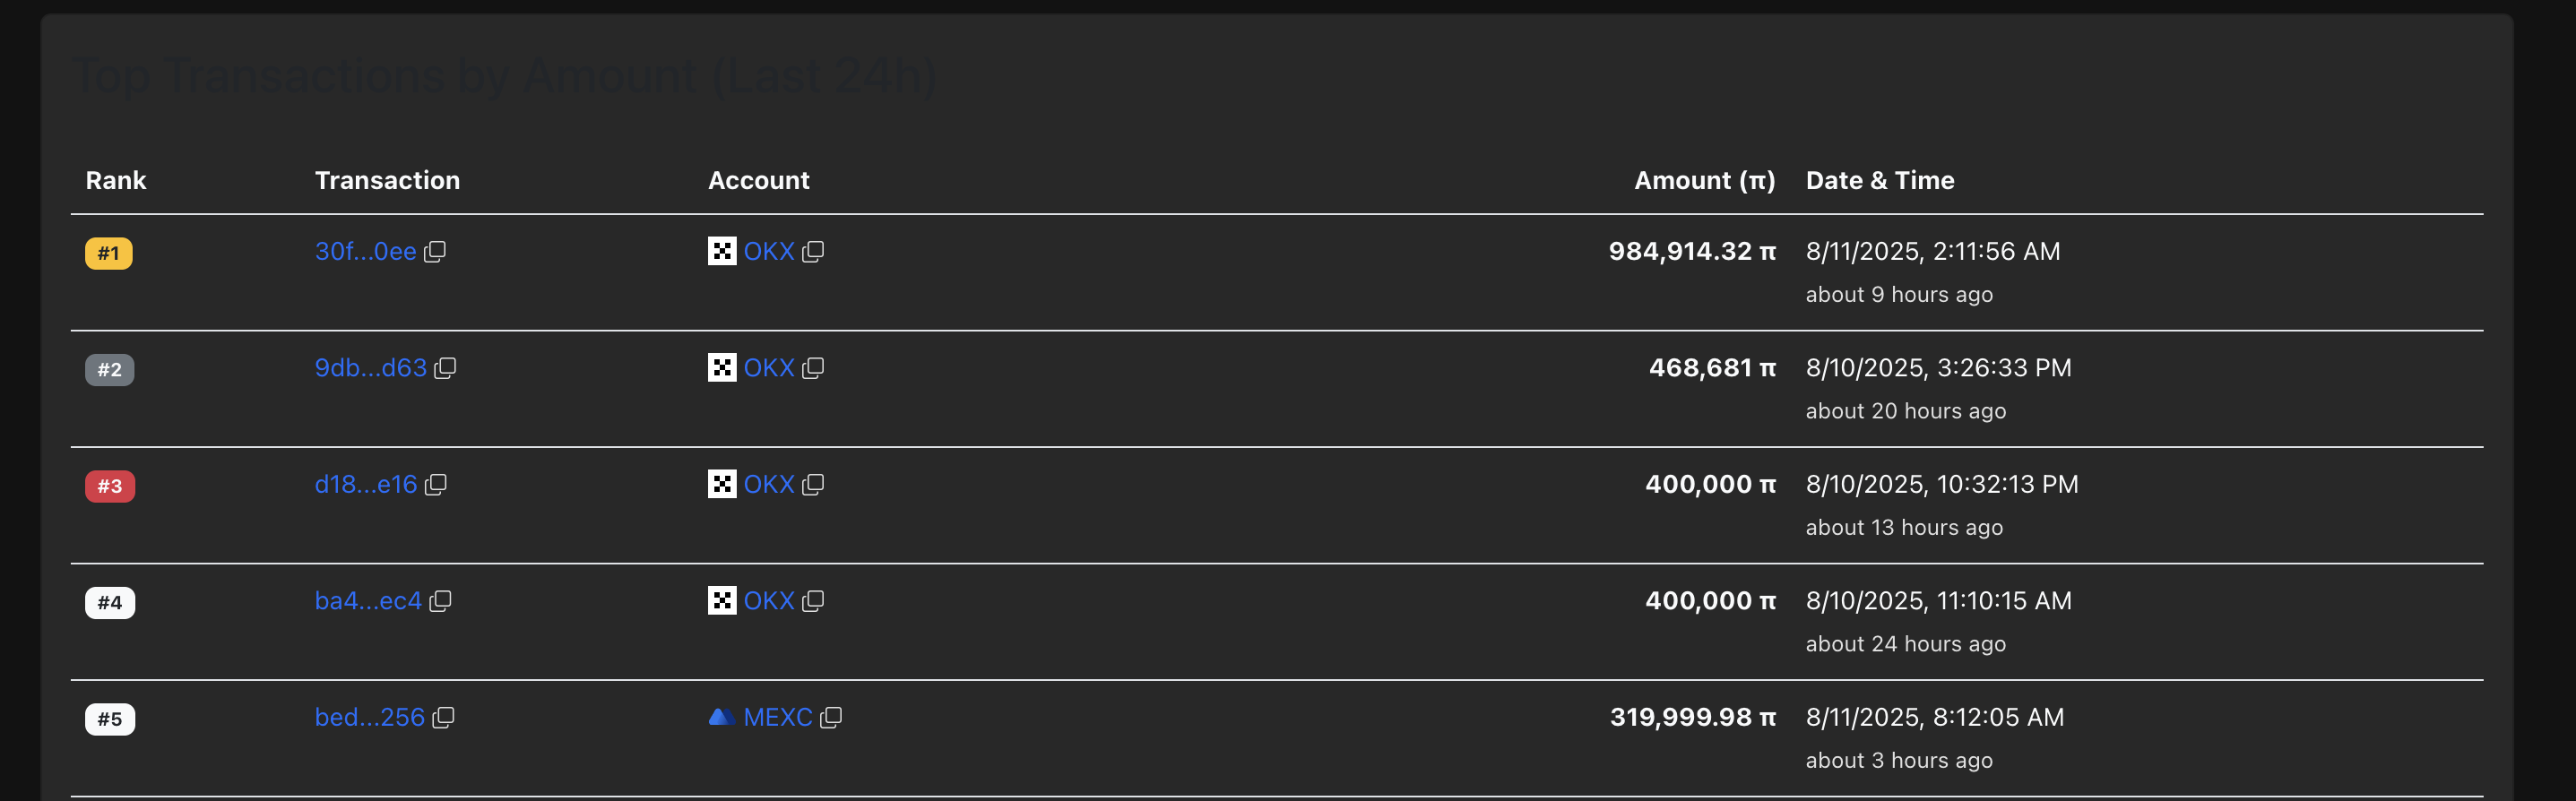
Large transaction data. Source: PiScan
Notably, a large-wallet investor made a purchase of 984,914 Pi tokens over the last 24 hours, increasing its holdings to 351.74 million tokens. As of Monday, PiScan data indicate that the investor’s PI token holding exceeds that of any individual centralized exchange (CEX).
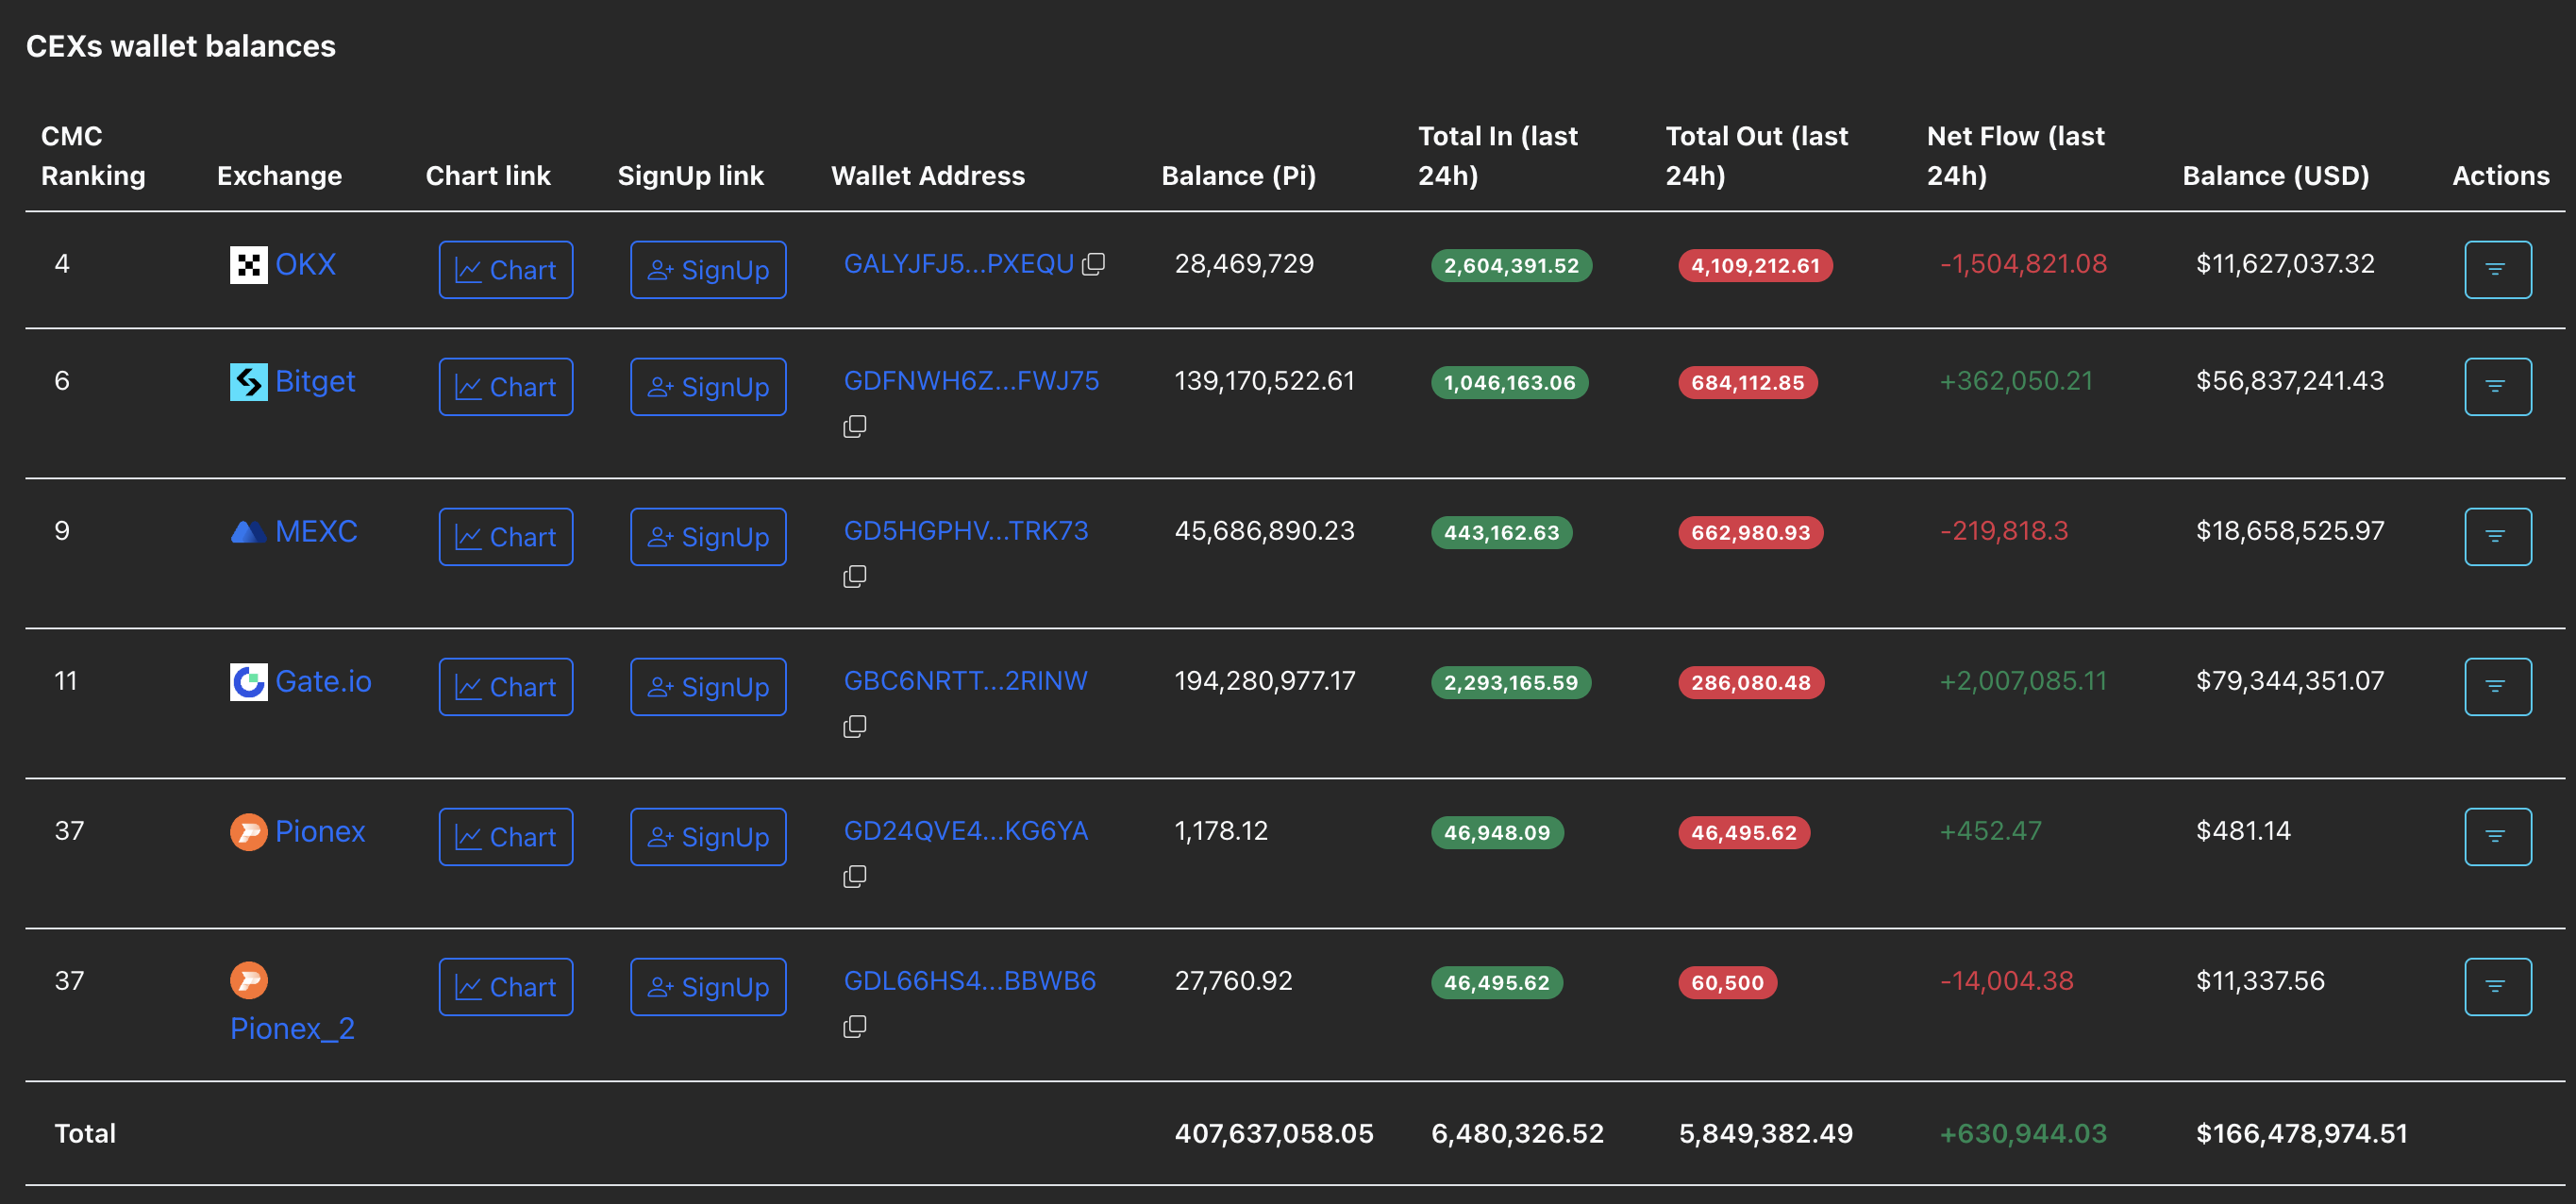
CEXs wallet balances. Source: PiScan
Pi Network breakout rally retests $0.40
The PI token rebounded with the repeating Adam and Eve pattern breakout on Friday, peaking at $0.4661 on Sunday before closing the day in the red at $0.3950. The PI token finds support on the 50-period Exponential Moving Average (EMA) at $0.3863 on the 4-hour chart, bouncing off over 3% so far on Monday and reclaiming its hold over $0.4000.
The Relative Strength Index (RSI) at 58 holds a sideways trend above the halfway line after slipping lower from the overbought zone on the same time frame. This suggests a cool-off in buying pressure, creating room for growth.
Similarly, the Moving Average Convergence Divergence (MACD) line moves flat after flashing a sell signal as it crossed below its signal line on Sunday.
If the PI token reclaims the 200-period EMA at $0.4271, it could extend the rally to the $0.4734 level, last tested on July 23.
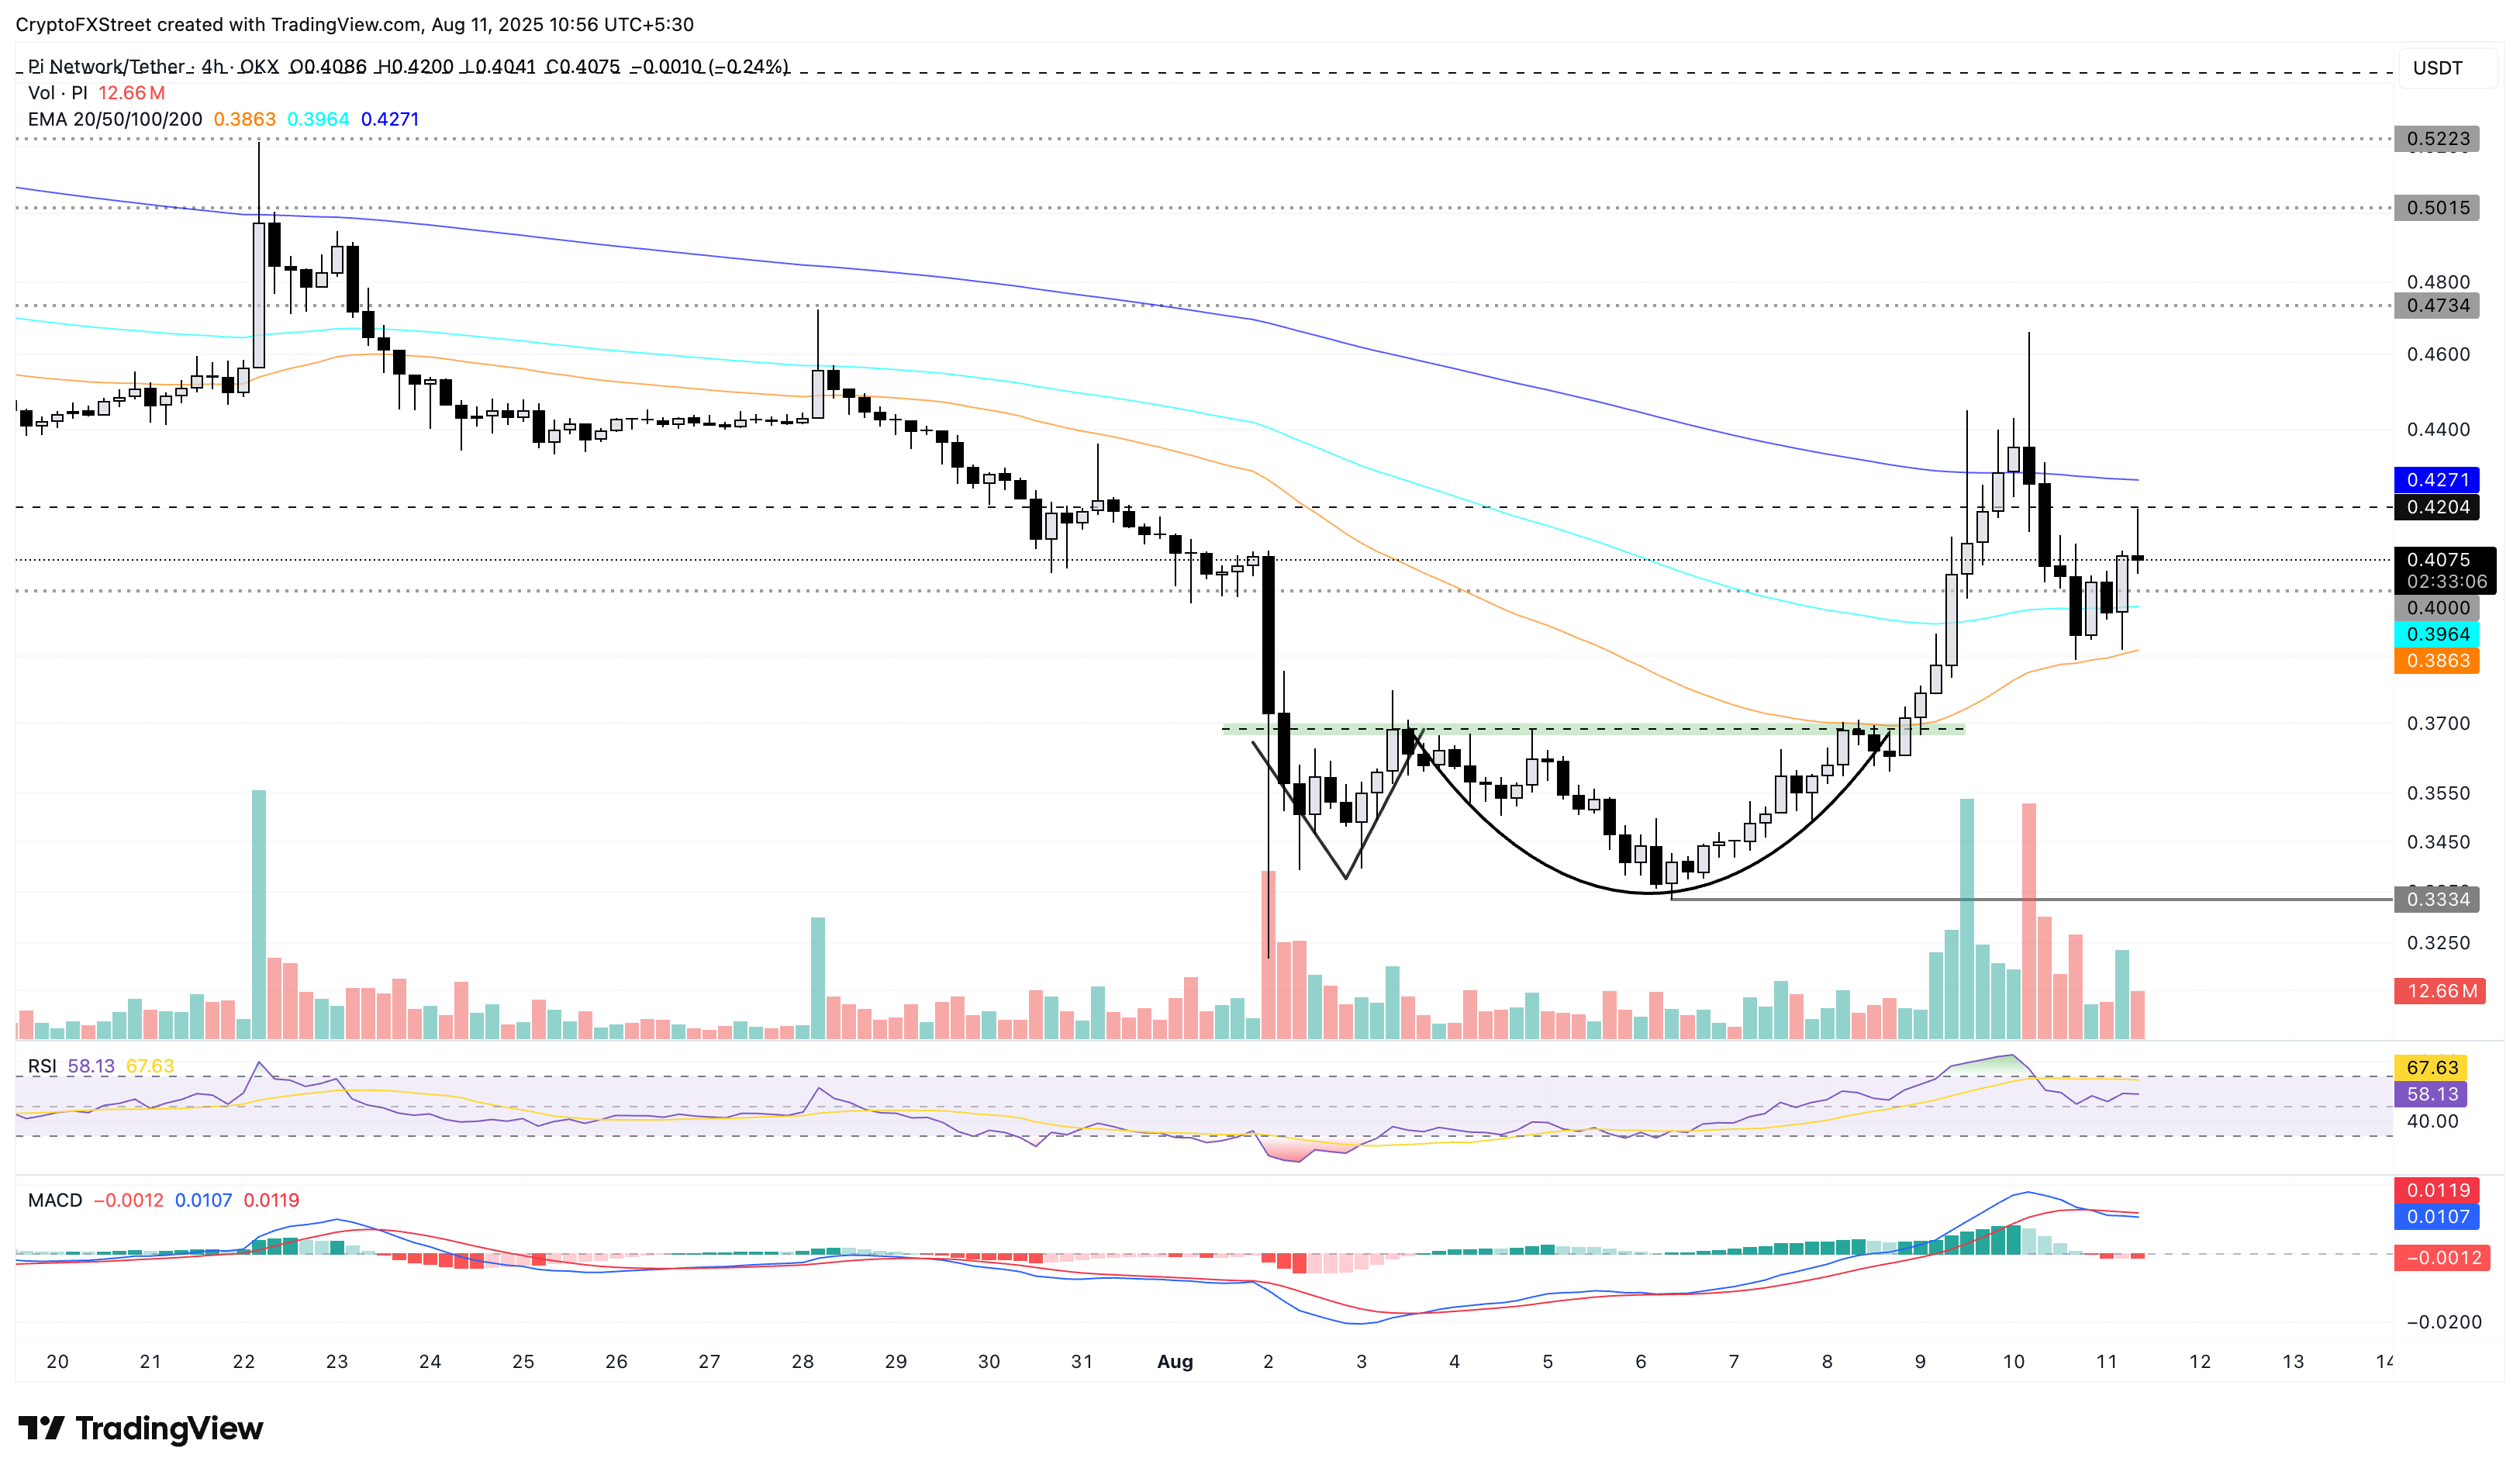
PI/USDT daily price chart.
On the contrary, if the 100-period EMA near the $0.4000 level fails to uphold bullish support, the PI token could retest the 50-period EMA at $0.3864.
Cryptocurrency prices FAQs
Token launches influence demand and adoption among market participants. Listings on crypto exchanges deepen the liquidity for an asset and add new participants to an asset’s network. This is typically bullish for a digital asset.
A hack is an event in which an attacker captures a large volume of the asset from a DeFi bridge or hot wallet of an exchange or any other crypto platform via exploits, bugs or other methods. The exploiter then transfers these tokens out of the exchange platforms to ultimately sell or swap the assets for other cryptocurrencies or stablecoins. Such events often involve an en masse panic triggering a sell-off in the affected assets.
Macroeconomic events like the US Federal Reserve’s decision on interest rates influence crypto assets mainly through the direct impact they have on the US Dollar. An increase in interest rate typically negatively influences Bitcoin and altcoin prices, and vice versa. If the US Dollar index declines, risk assets and associated leverage for trading gets cheaper, in turn driving crypto prices higher.
Halvings are typically considered bullish events as they slash the block reward in half for miners, constricting the supply of the asset. At consistent demand if the supply reduces, the asset’s price climbs.

FXStreet
100만 명이 넘는 사용자가 FXStreet를 통해 실시간 시장 데이터, 차트 도구, 전문가 인사이트, 포렉스 뉴스를 이용합니다. 포괄적인 경제 캘린더와 교육 웨비나는 트레이더가 정보를 유지하고 신중한 결정을 내리도록 돕습니다. FXStreet는 바르셀로나 본사와 전 세계 지역에 걸쳐 약 60명의 팀으로 구성되어 있습니다.
Read More


