
Trade The World
Pi Network Price Forecast: Rising momentum and strong whale demand put PI on breakout watch
작성자 Manish Chhetri
게시일: 24 Nov 2025 | 수정일: 24 Nov 2025


POPULAR ARTICLES

Pi Network (PI) begins the week on a positive note, extending its weekend gains and approaching a key technical barrier around $0.247 at the time of writing on Monday.
- Pi Network trades in green on Monday, nearing a key resistance zone, a breakout above suggests a rally ahead.
- On-chain data shows large whale orders, indicating strengthening accumulation and improving investor confidence.
- The technical outlook suggests a potential upside move, with momentum indicators signaling a bullish bias as buying pressure builds.
Pi Network (PI) begins the week on a positive note, extending its weekend gains and approaching a key technical barrier around $0.247 at the time of writing on Monday. Growing momentum, coupled with increased whale accumulation, has lifted sentiment, putting PI on watch for a potential breakout if buyers step in.
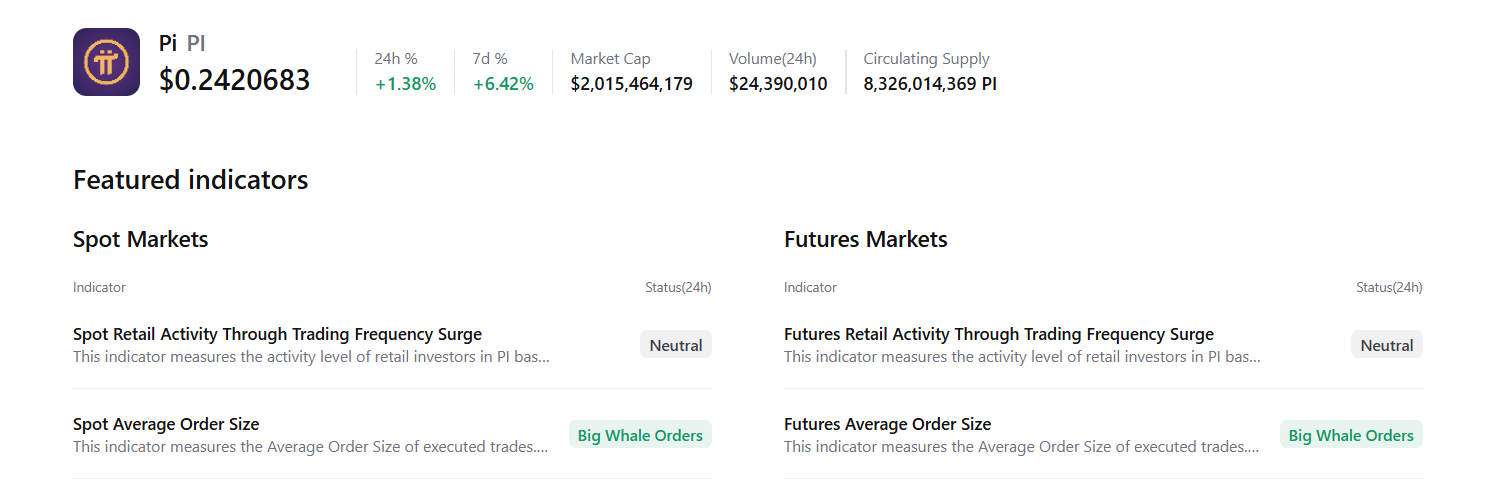
Large whale orders in the spot and futures markets
CryptoQuant summary data supports a positive outlook for Pi Network, as spot and futures markets show large whale orders, signaling that a rally may be forming.
Pi Price Forecast: PI momentum indicators show bullish bias
Pi Network declined nearly 5% on Friday, retesting the weekly support level at $0.221, and recovered most of its losses over the weekend. At the time of writing on Monday, it nears the 50-day Exponential Moving Average (EMA) at $0.242. This 50-day EMA roughly coincides with the 38.2% Fibonacci retracement level at $0.247 (drawn from the August 30 high of $0.398 to the October 10 low of $0.153) and the descending trendline, making it a key resistance zone to watch.
If PI breaks and closes above the descending trendline on a daily basis, it could extend the rally toward the 50% price retracement level at $0.276.
The Relative Strength Index (RSI) on the daily chart reads 56, above the neutral level of 50, indicating bullish momentum gaining traction. Additionally, the Moving Average Convergence Divergence (MACD) showed a bullish crossover last week, which remains intact, further supporting the bullish thesis.
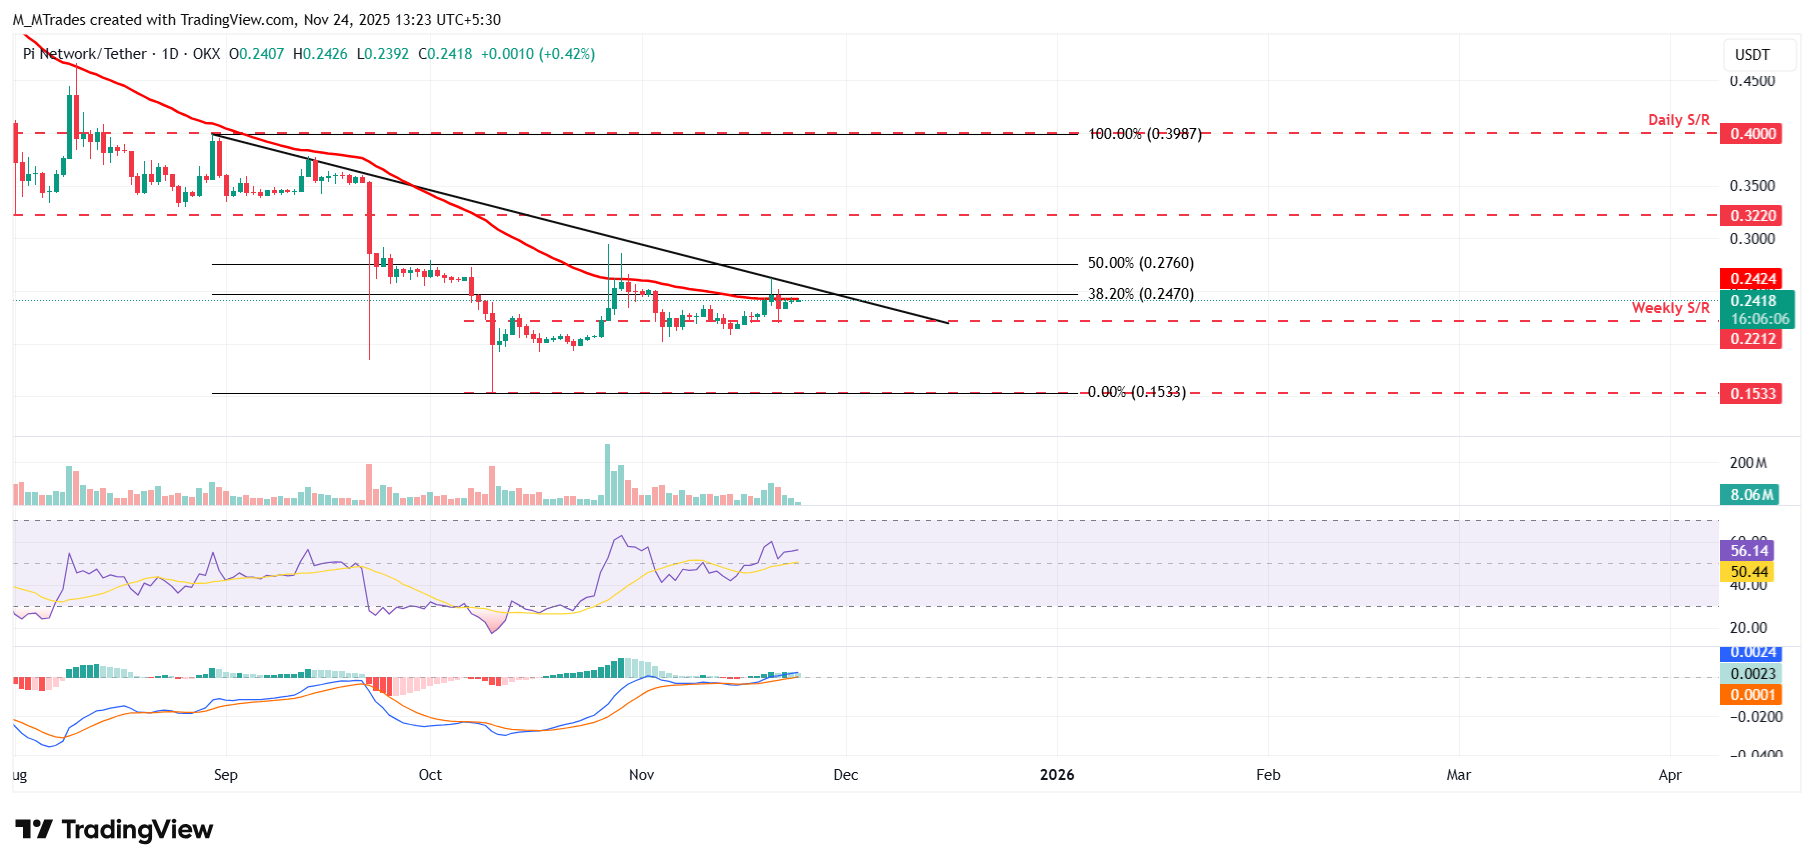
On the other hand, if PI faces rejection from the 50-day EMA at $0.242, it could extend the decline toward the weekly support at $0.221.

FXStreet
100만 명이 넘는 사용자가 FXStreet를 통해 실시간 시장 데이터, 차트 도구, 전문가 인사이트, 포렉스 뉴스를 이용합니다. 포괄적인 경제 캘린더와 교육 웨비나는 트레이더가 정보를 유지하고 신중한 결정을 내리도록 돕습니다. FXStreet는 바르셀로나 본사와 전 세계 지역에 걸쳐 약 60명의 팀으로 구성되어 있습니다.
Read More


