
Trade The World
Pump.fun, Flare, Bittensor lose ground as Bitcoin slips below $109,000
작성자 Vishal Dixit
게시일: 17 Oct 2025 | 수정일: 17 Oct 2025


POPULAR ARTICLES

Pump.fun (PUMP), Flare (FLR), and Bittensor (TAO) emerge as top decliners in the last 24 hours by press time on Friday as Bitcoin (BTC) trades below $109,000.
- Pump.fun risks extending the downtrend for the fourth consecutive day.
- Flare deepens the pullback below $0.02000 level as selling pressure increases.
- Bittensor falls below $400, with bullish momentum on the decline.
Pump.fun (PUMP), Flare (FLR), and Bittensor (TAO) emerge as top decliners in the last 24 hours by press time on Friday as Bitcoin (BTC) trades below $109,000. The altcoins, under pressure, are at risk of further correction as selling pressure resurfaces, erasing the minor gains made earlier this week.
Bitcoin risks further loss towards $102,000
Bitcoin trades near the 200-day Exponential Moving Average (EMA) at $108,067 at press time on Friday, risking further decline to extend the three-day downfall. The pullback has marked the lowest daily close since July 7, adding pressure on the 200-day EMA and the S1 Pivot Point level at $108,235.
A decisive close below these support levels could extend the decline in BTC to the S2 Pivot Point level at $102,422.
The selling pressure is on the rise, according to the Moving Average Convergence Divergence (MACD), which extends the decline with a consecutive increase in the red histogram. At the same time, the Relative Strength Index (RSI) at 37 remains flat but under pressure, risking further decline towards the oversold zone if the intraday price movement turns red.
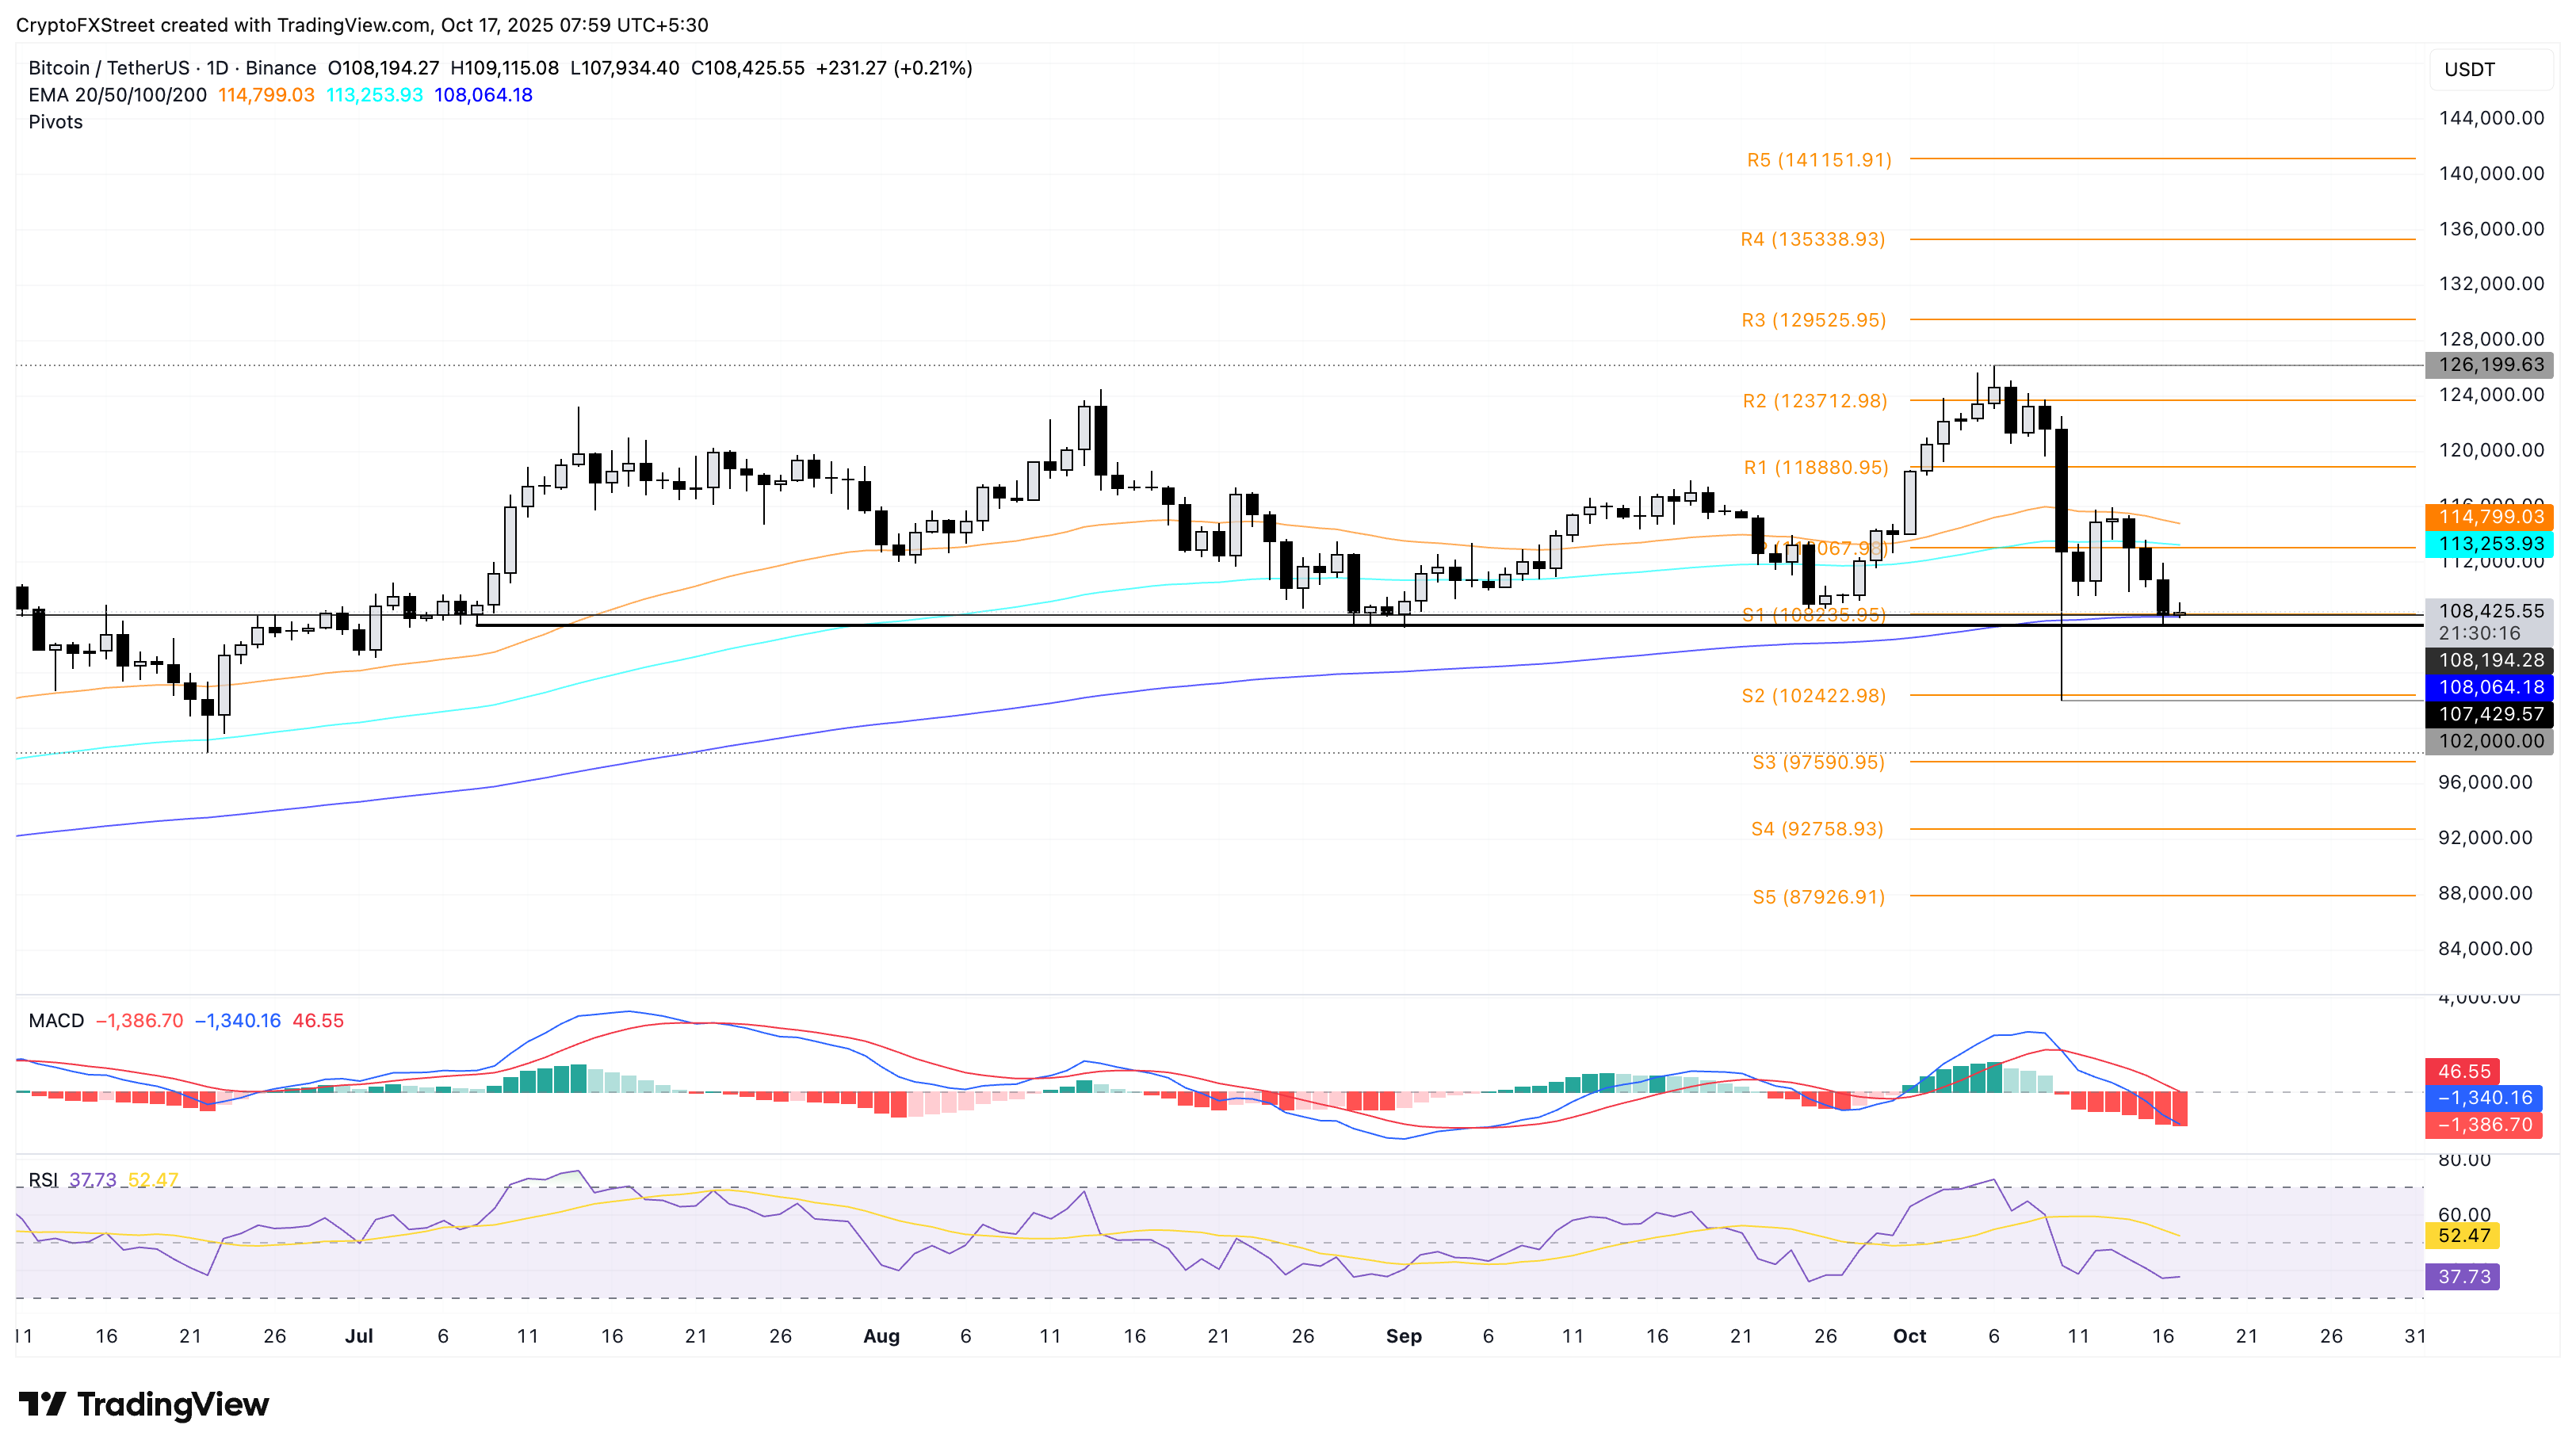
BTC/USDT daily price chart.
A bounce back from the 200-day EMA at $108,067 seems unlikely without an external catalyst. Still, the overhead resistance at the centre Pivot Point level of $113,067, aligning with the 100-day EMA, could be the primary rebound target.
Pump.fun puts pressure on a key support level
Pump.fun leads the losses among the top 100 cryptocurrencies, recording its fourth straight day of trading in the red. At the time of writing, PUMP sinks by 2% on Friday, adding further discount to the 9.50% loss from the previous day.
The downtrend in the launchpad token approaches the S1 Pivot Point level at $0.003134 as the immediate support. If PUMP fractures the underlying support, it could extend the decline to Friday’s low at $0.001496.
The MACD and its signal line are in a freefall, crossing below the zero line, indicating a bearish shift in trend momentum. Additionally, the RSI at 32 floats above the oversold boundary, indicating heightened overhead pressure.
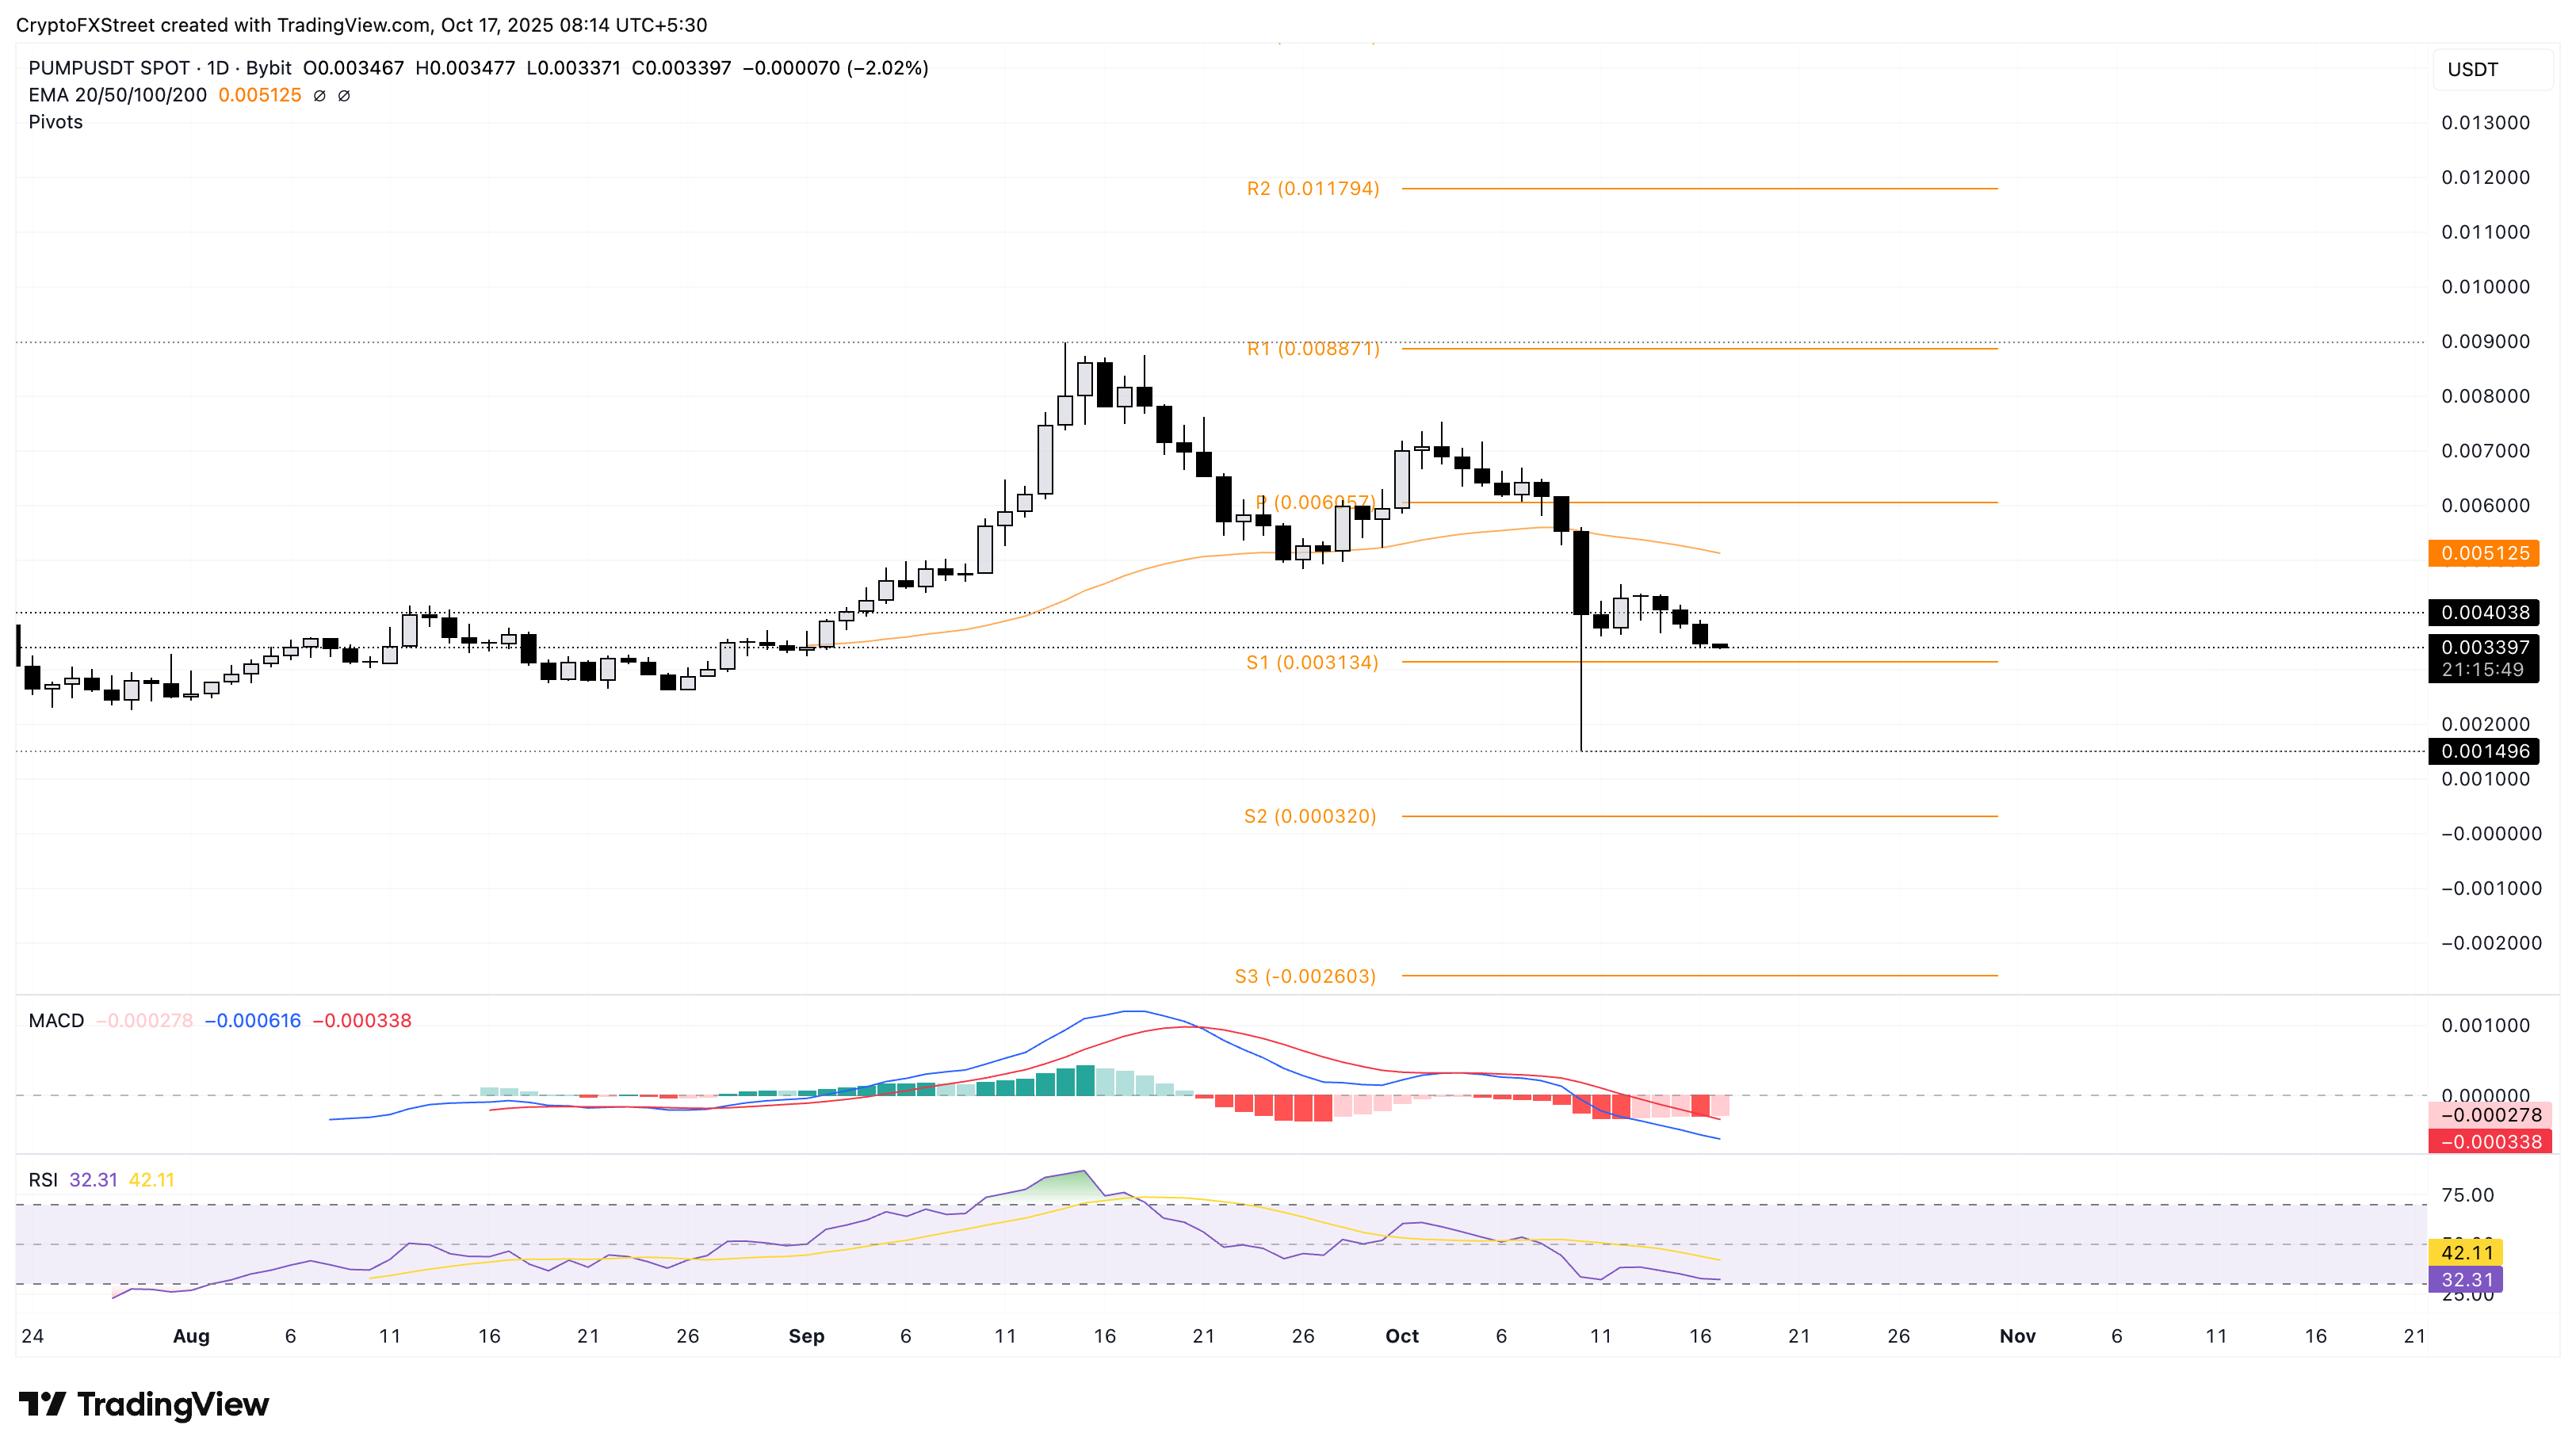
PUMP/USDT daily price chart.
On the flip side, if PUMP rebounds from $0.003134, it could test the $0.005000 psychological level.
Flare under pressure risks further decline
Flare trades above $0.01700 at press time on Friday, extending the reversal from the S1 Pivot Point level at $0.02066. The declining trend in FLR targets the S2 Pivot Point level at $0.01587, while a downside tilt in the 50-day and 100-day EMAs risks a potential bearish crossover.
The MACD and signal line on the daily chart indicate a decline into negative territory, suggesting a surge in selling pressure. Corroborating this, the RSI at 29 slips into the oversold zone.
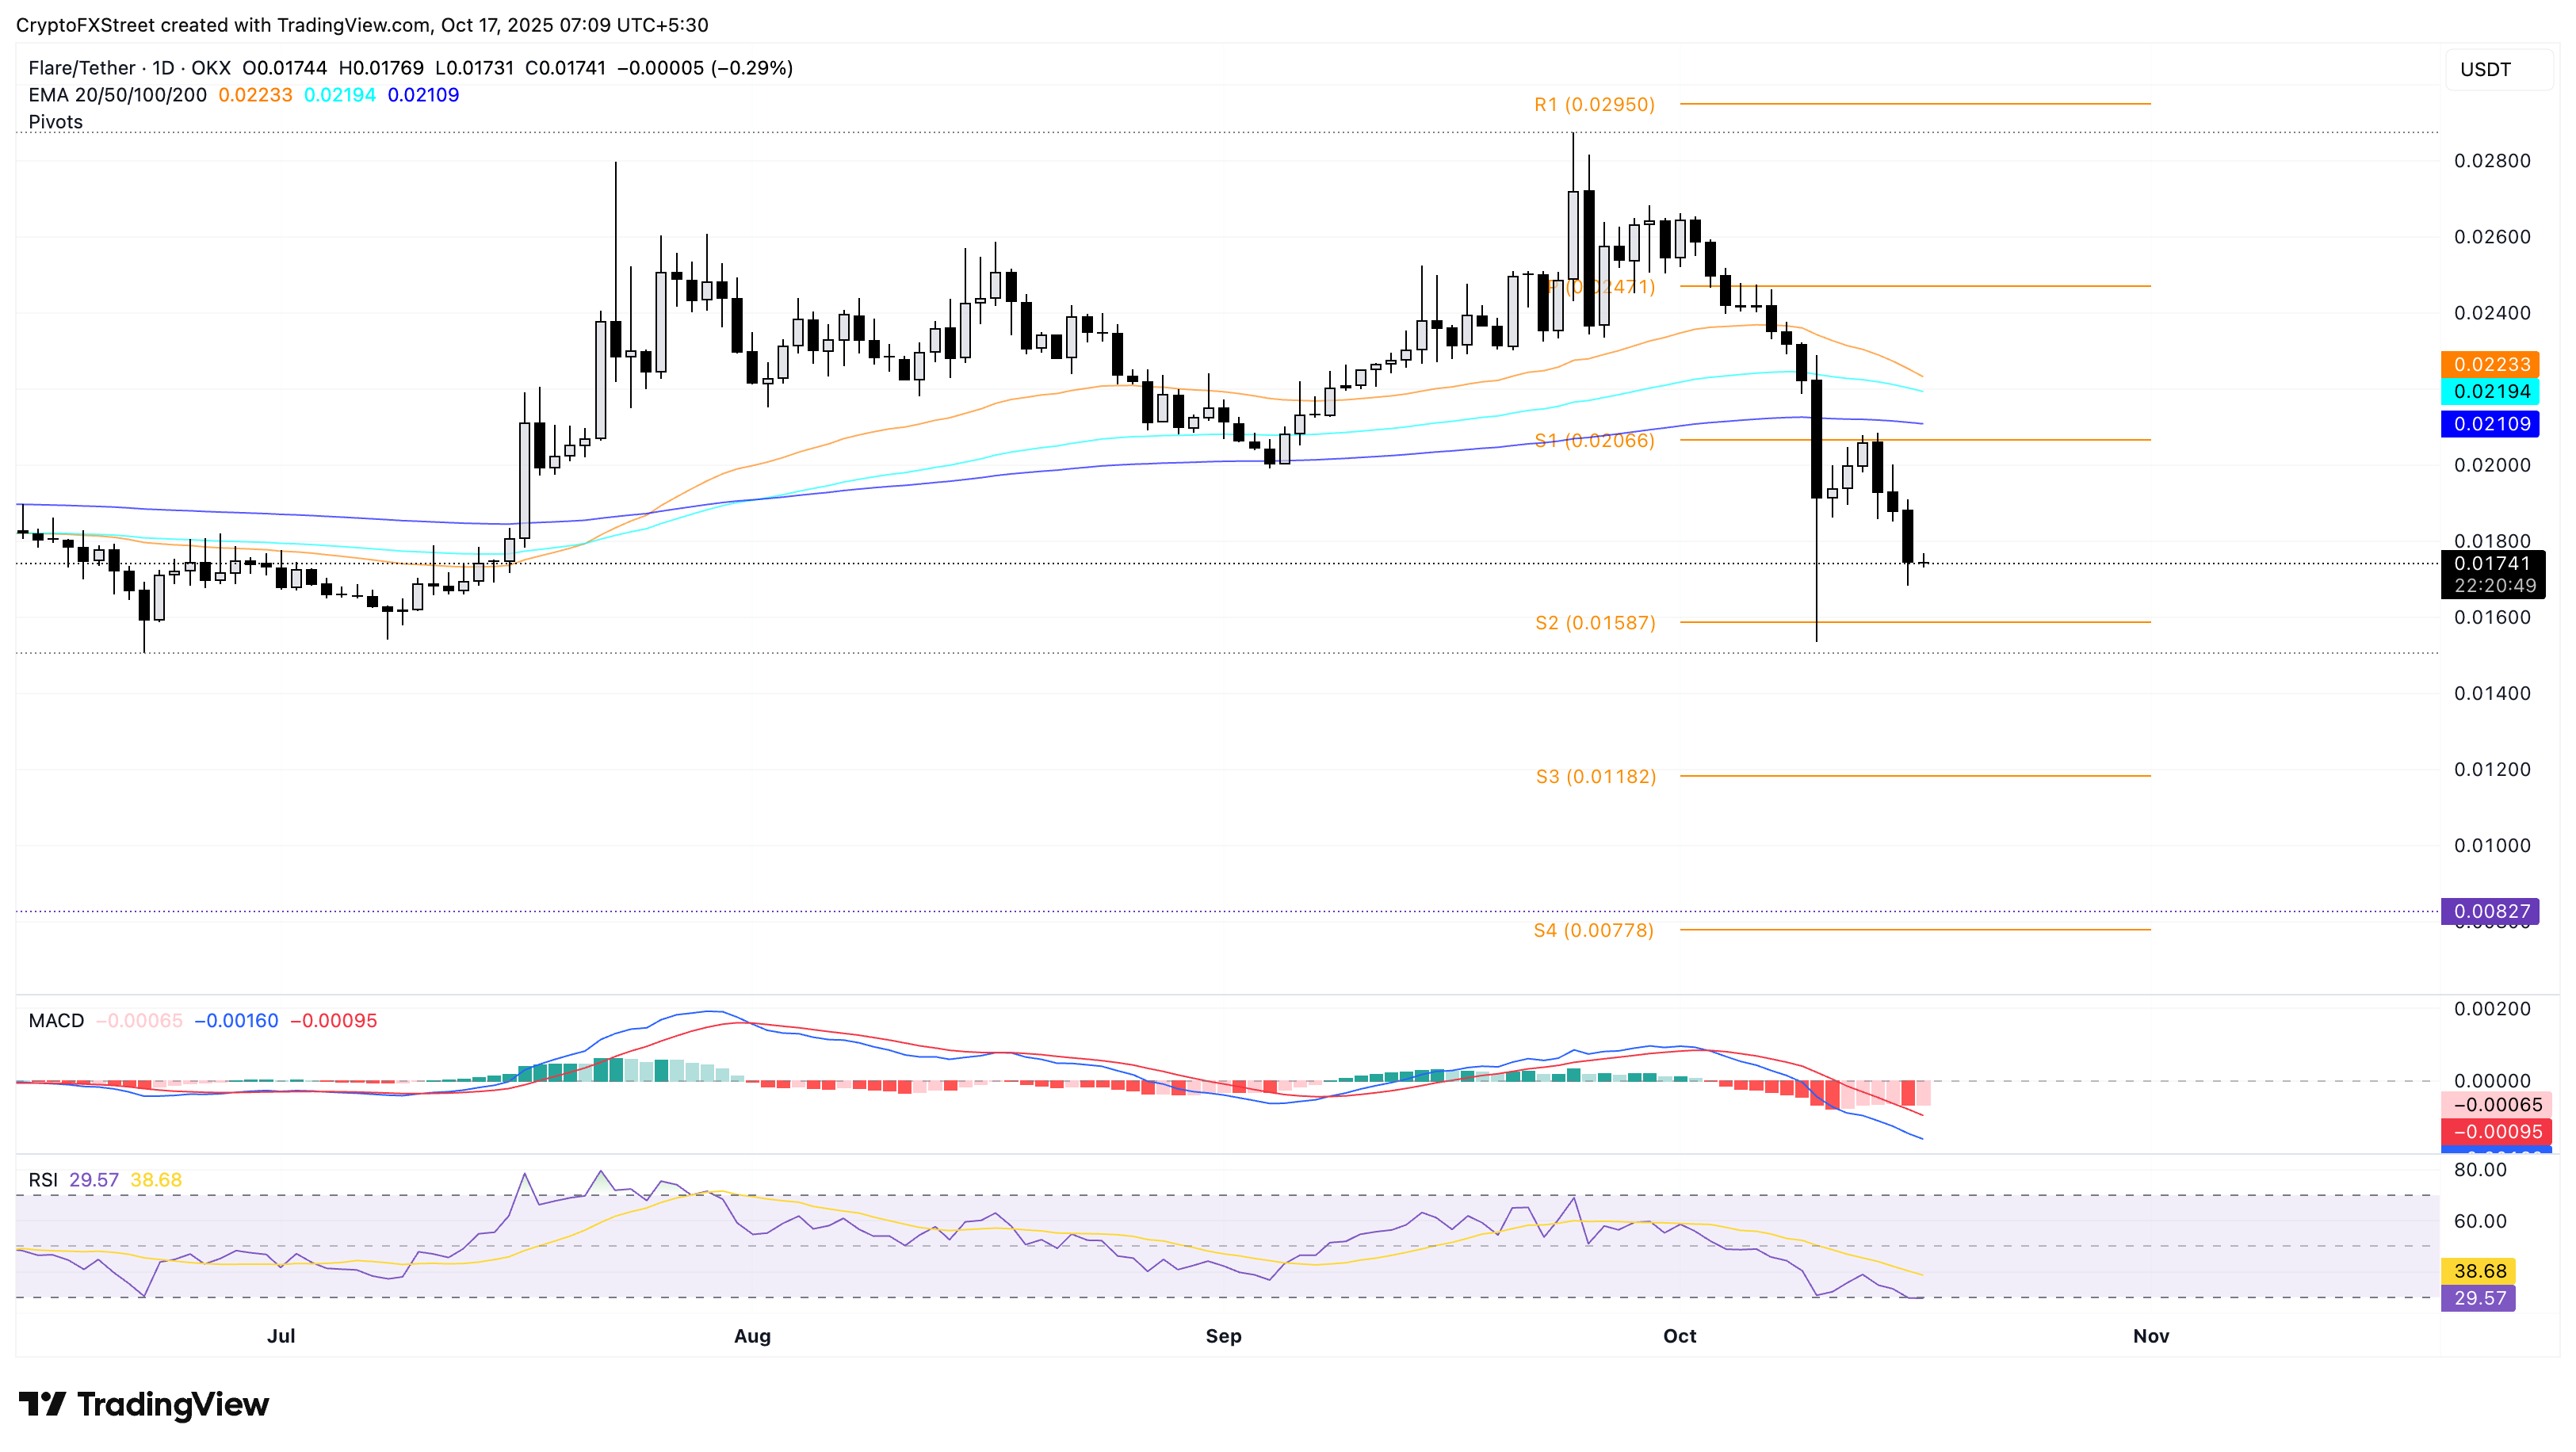
FLR/USDT daily price chart.
Looking up, a bullish comeback seems unlikely but could test the $0.02000 psychological level if the broader market rebounds.
Bittensor’s decline eyes the 200-day EMA
Bittensor drops below the $400 psychological level after an 8% drop on Thursday. At the time of writing, TAO extends the loss by 1% on Friday, marking its third bearish candle on the daily chart.
The AI token eyes the 200-day EMA as the immediate support at $359, which could absorb the incoming supply wave.
The momentum indicators on the daily chart suggest a decline in buying pressure as the MACD and signal line approach a potential bearish crossover. At the same time, the RSI at 53 marks a decline from the overbought zone to neutral levels.

TAO/USDT daily price chart.
A potential reversal from the 200-day EMA at $350 could test the R2 Pivot Point level at $405.

FXStreet
100만 명이 넘는 사용자가 FXStreet를 통해 실시간 시장 데이터, 차트 도구, 전문가 인사이트, 포렉스 뉴스를 이용합니다. 포괄적인 경제 캘린더와 교육 웨비나는 트레이더가 정보를 유지하고 신중한 결정을 내리도록 돕습니다. FXStreet는 바르셀로나 본사와 전 세계 지역에 걸쳐 약 60명의 팀으로 구성되어 있습니다.
Read More


