
Trade The World
Pump.fun, Virtuals Protocol, and Ethena log double-digit losses amid market-wide sell-off
작성자 Vishal Dixit
게시일: 31 Oct 2025 | 수정일: 31 Oct 2025


POPULAR ARTICLES

Pump.fun (PUMP), Virtuals Protocol (VRITUAL), and Ethena (ENA) are leading the decline as the broader cryptocurrency market faces a sell-off wave.
- Pump.fun flips to the downside from a key resistance trendline, recording double-digit losses in the last 24 hours.
- Virtuals Protocol rebounds 6% on Friday as bulls attempt recovery after a 17% decline in the previous session.
- Ethena extends the support trendline breakdown, with bears aiming for the $0.3459 level.
Pump.fun (PUMP), Virtuals Protocol (VRITUAL), and Ethena (ENA) are leading the decline as the broader cryptocurrency market faces a sell-off wave. Technically, the PUMP, VIRTUAL, and ENA tokens are approaching key support levels, but market-wide fear, uncertainty, and doubt (FUD) risks may further exacerbate losses.
Pump.fun’s declining trend tests a key support
Pump.fun’s PUMP token price is down by nearly 1% at press time on Friday, extending the 15% losses from the previous day. The launchpad token failed to surpass the R1 Pivot Point $0.005275 and the local resistance trendline formed by connecting the September 14 and October 3 peaks on the 4-hour price chart.
The key support levels during the ongoing pullback are the S1 and S2 Pivot Points, located at $0.003864 and $0.002933, respectively.
The momentum indicators on the 4-hour chart maintain a bearish incline as the Moving Average Convergence Divergence (MACD) slope downwards with its signal line, indicating a rise in supply pressure.
Additionally, the Relative Strength Index (RSI) reads 43 on the same chart, indicating further room for downside movement before reaching the overbought zone.
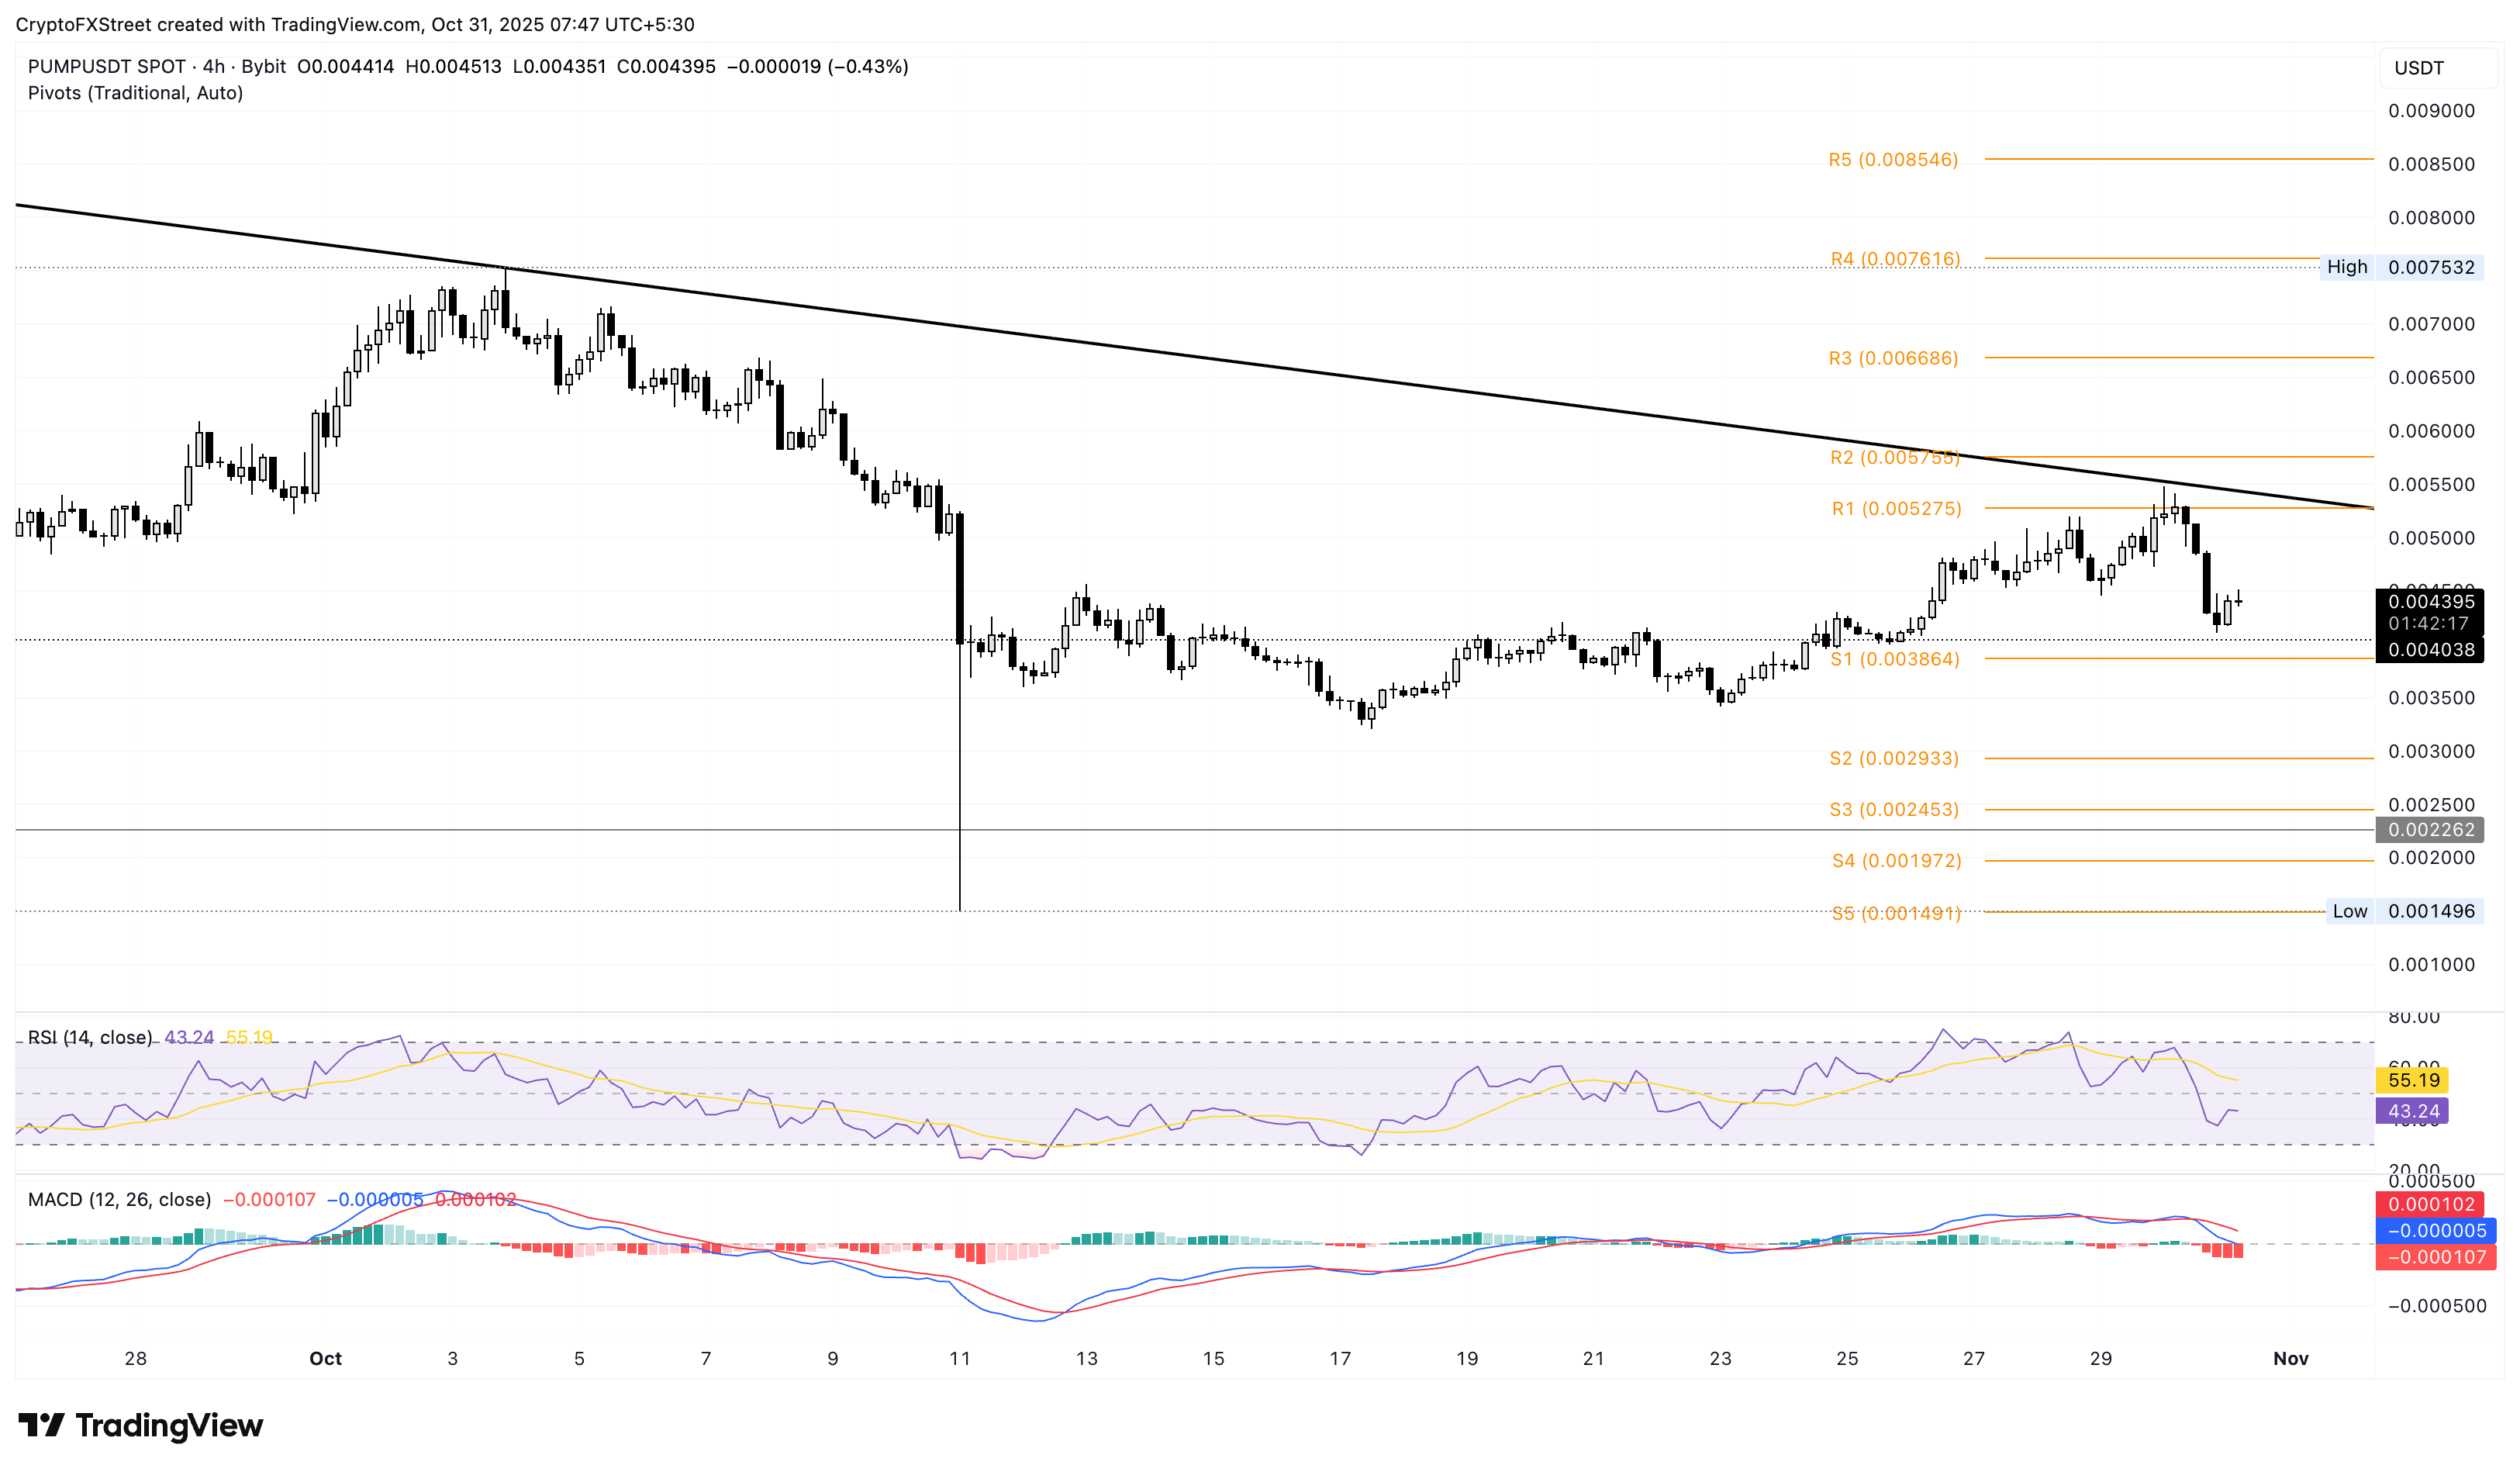
PUMP/USDT 4-hour price chart.
Looking up, the key resistance for PUMP remains the local resistance trendline near the R1 Pivot Point at $0.005275.
Virtuals Protocol bulls hold at a crucial stronghold
Virtuals Protocol recovers over 5% at the time of writing on Friday, from the 17% loss on the previous day. The AI agent token has failed to surpass the $1.6898 level earlier this week and is now maintaining a position above the $1.1821 support level.
If VIRTUAL slips below this level, it could test the $1.0000 psychological support.
Adding to the downside risk, the indicators on the daily chart suggest a decline in buying pressure. The MACD approaches its signal line for a potential bearish crossover while the RSI slips to 59 from the overbought zone.
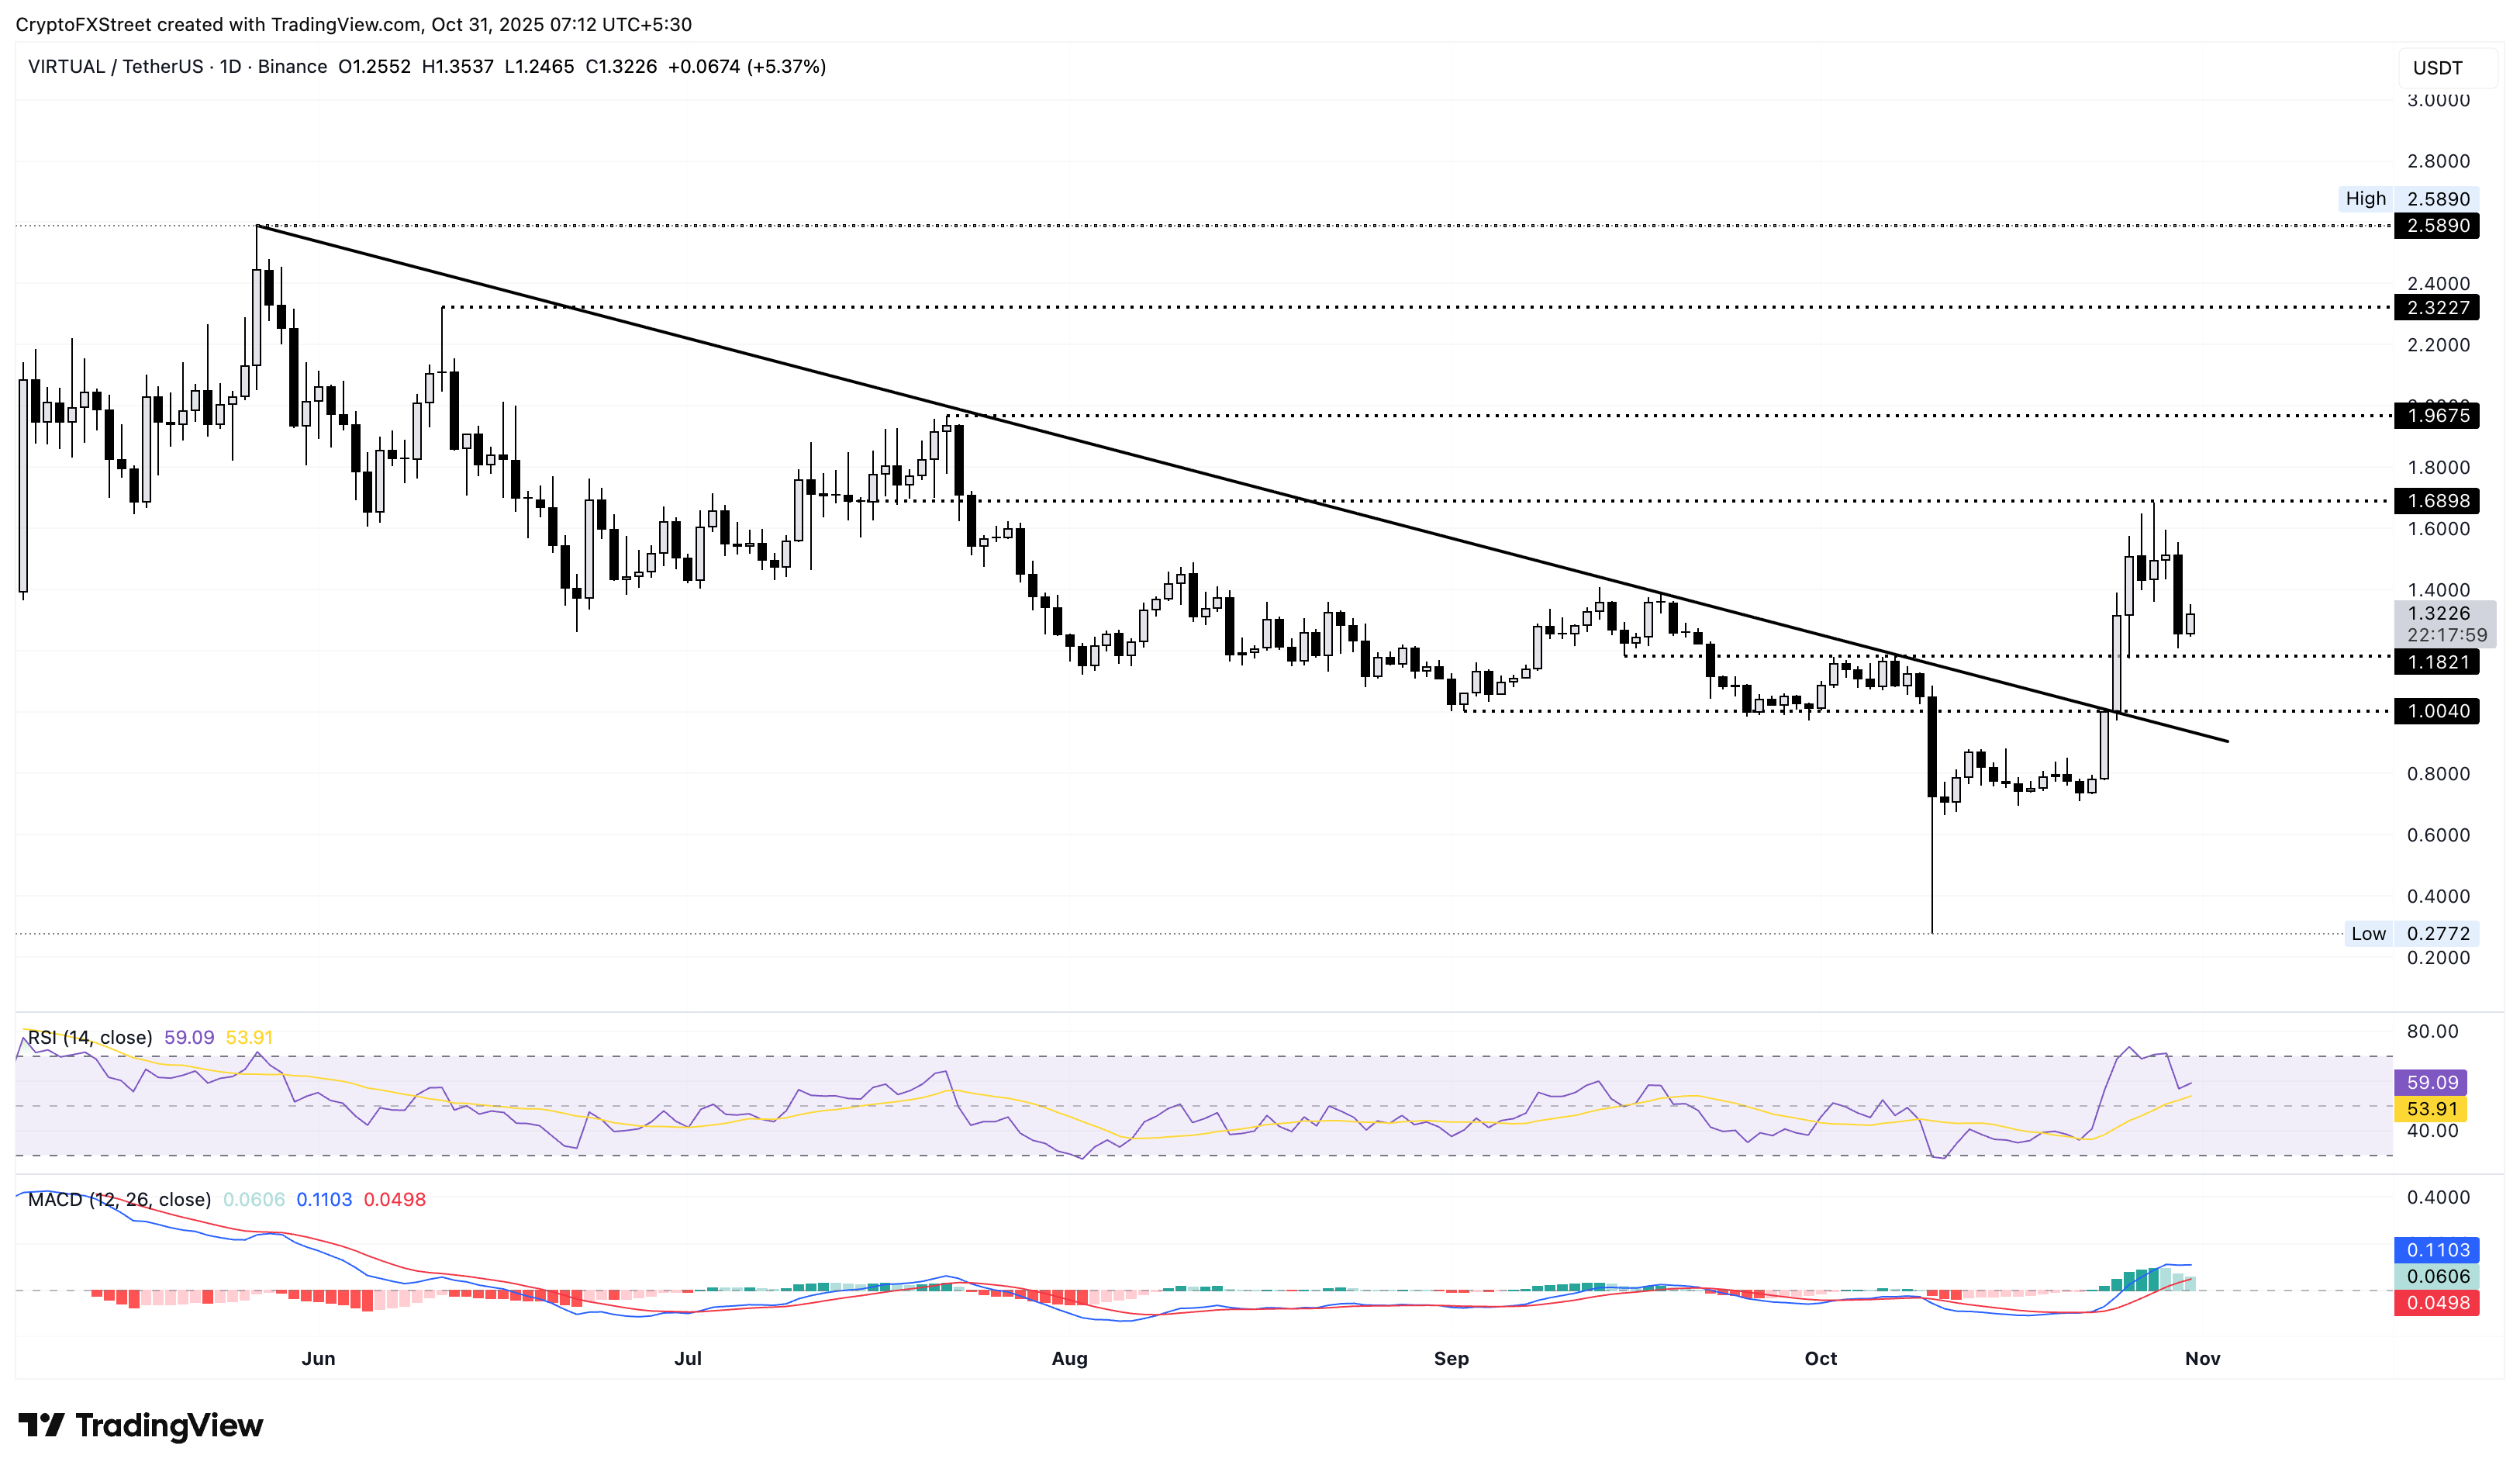
VIRTUAL/USDT daily price chart.
On the upside, a bounce back could retest the $1.6898 resistance with the $1.9675 level as the potential breakout target.
Ethena’s key support is at risk
Ethena trades below the $0.4000 level at press time on Friday, after four consecutive days of losses. The bearish flip in ENA from the $0.5343 resistance broke below a local support trendline to test the S2 Pivot Point at $0.3823, as previously anticipated by FXStreet.
If the synthetic dollar token fails to hold above this level, it could extend the correction to $0.3459, the low of October 12, followed by the S4 Pivot Point at $0.3102.
Technically, the selling pressure on the 4-hour timeframe is at extreme levels as the RSI at 25 flashes oversold signals while the MACD and its signal line fall freely into the negative zone.
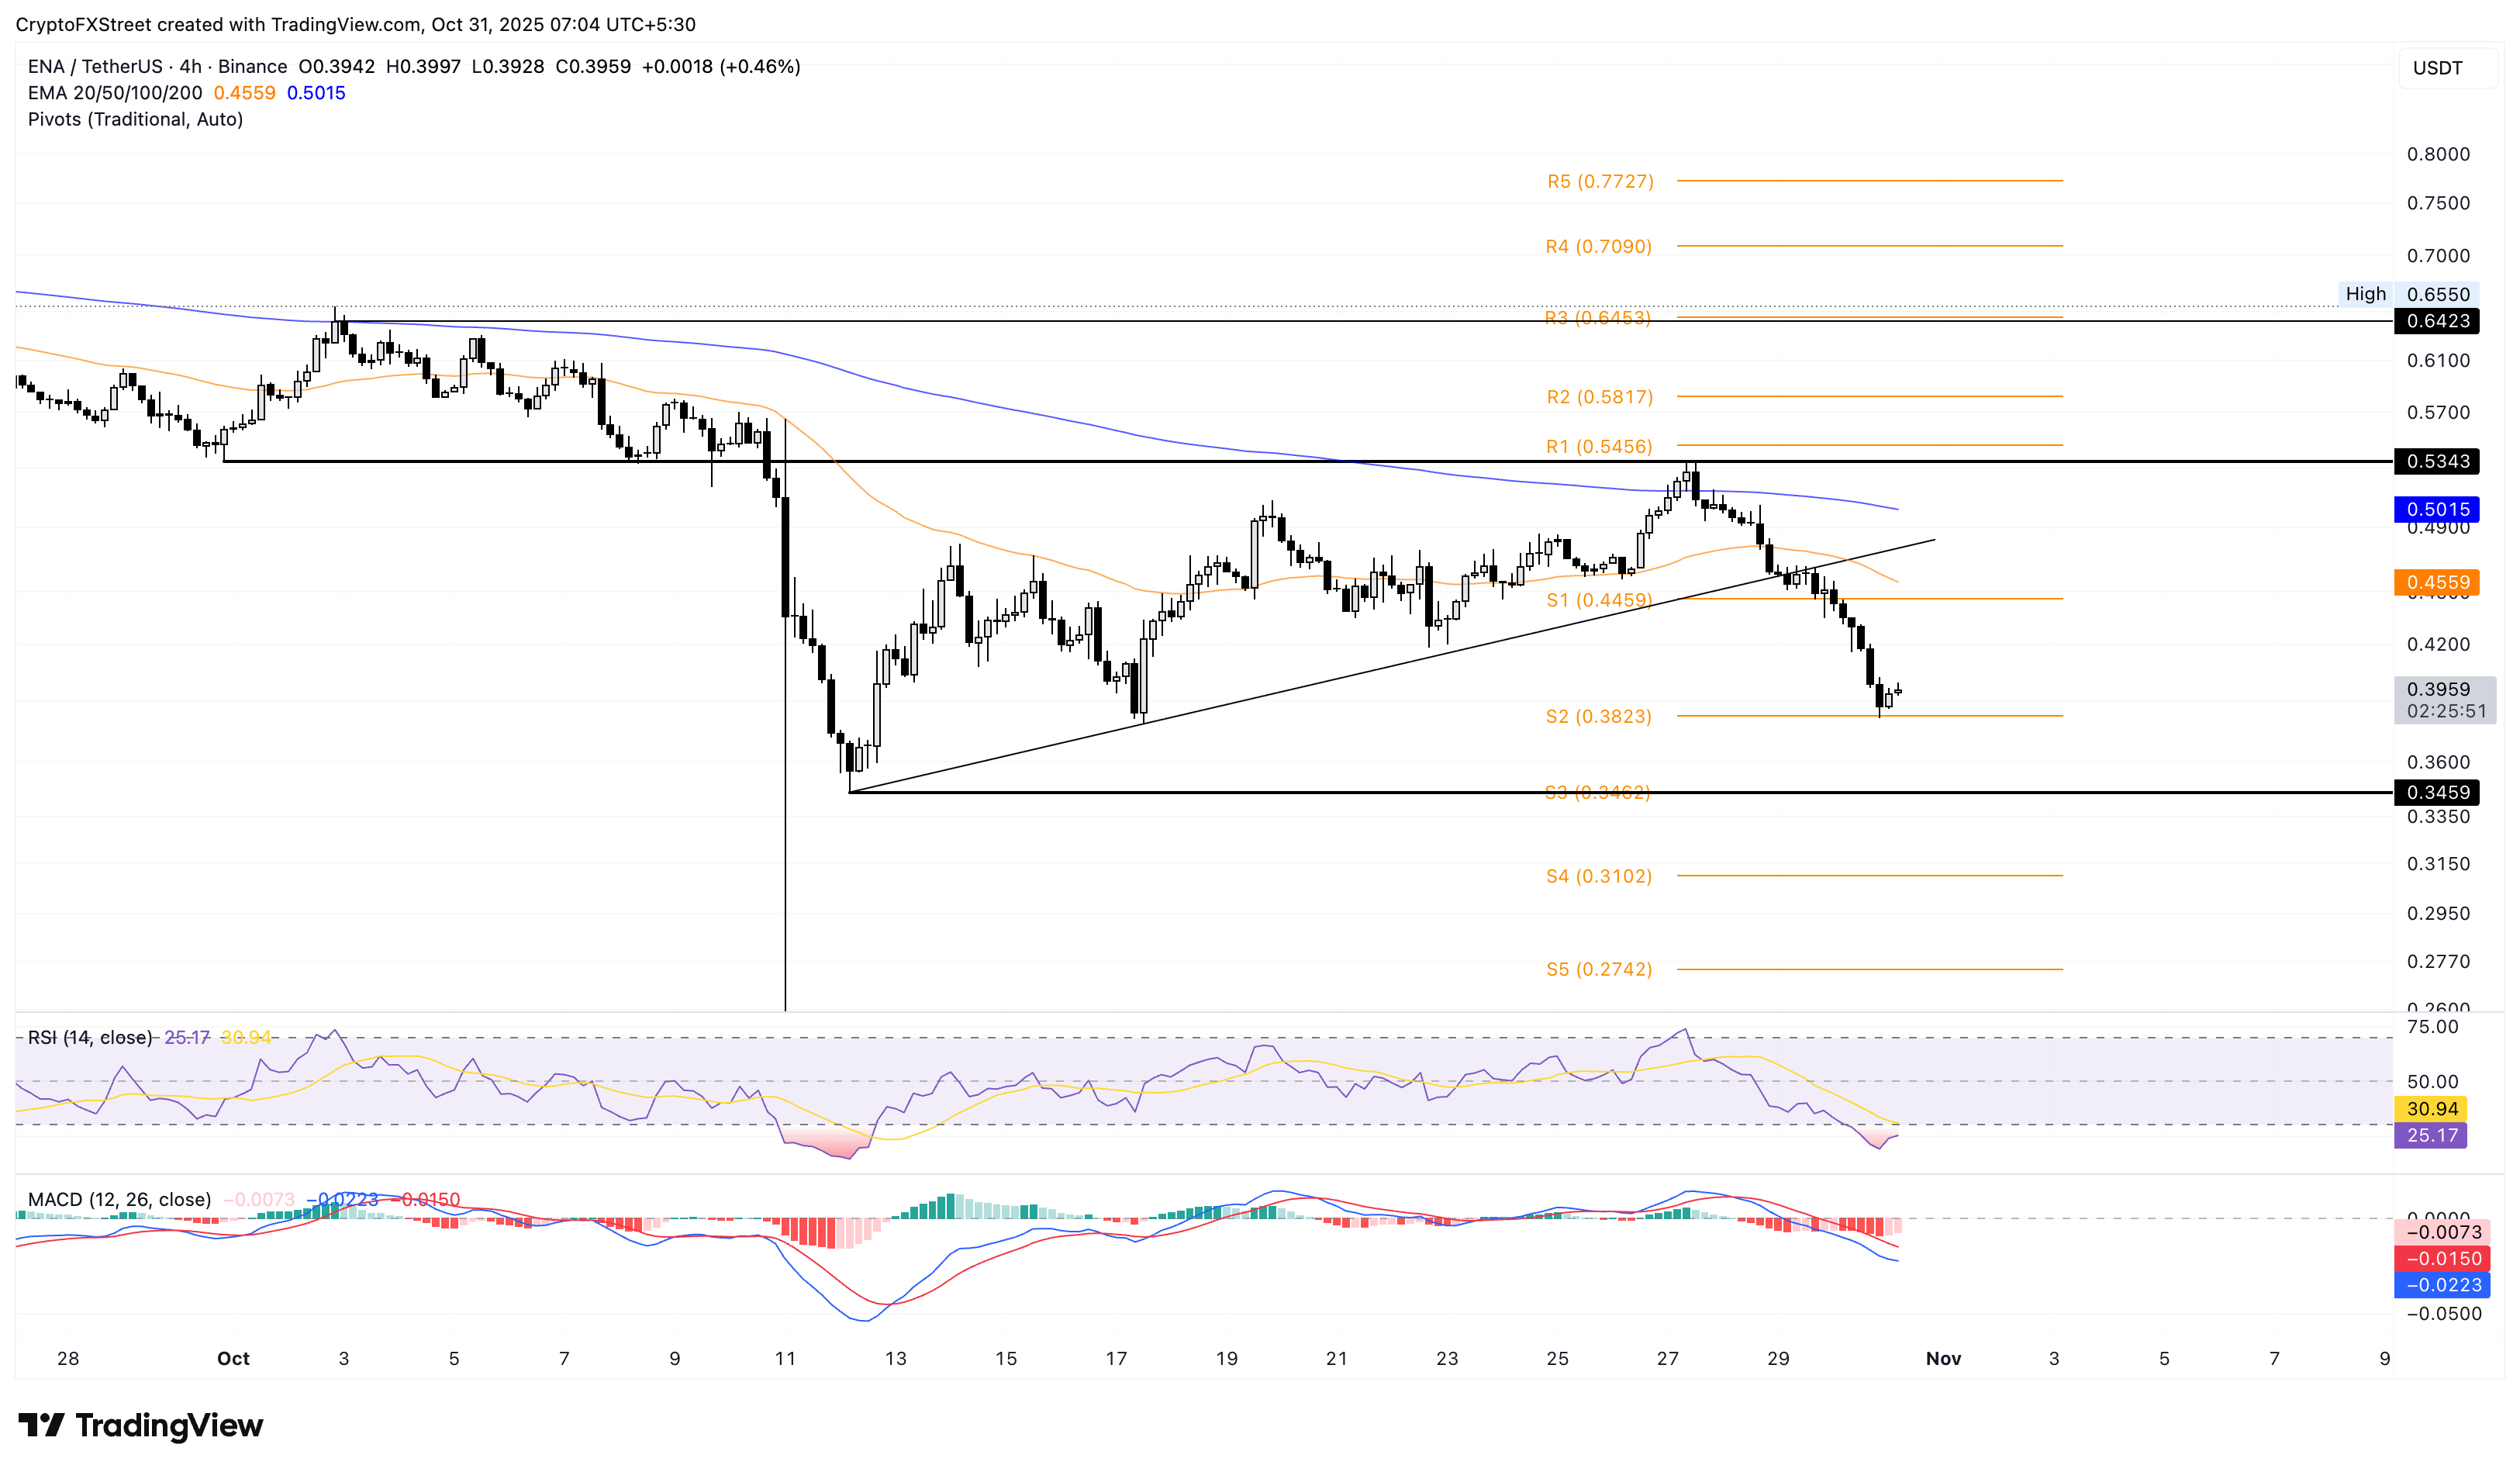
ENA/USDT 4-hour price chart.
A potential bounce back in ENA could retest the S1 Pivot Point at $0.4459.

FXStreet
100만 명이 넘는 사용자가 FXStreet를 통해 실시간 시장 데이터, 차트 도구, 전문가 인사이트, 포렉스 뉴스를 이용합니다. 포괄적인 경제 캘린더와 교육 웨비나는 트레이더가 정보를 유지하고 신중한 결정을 내리도록 돕습니다. FXStreet는 바르셀로나 본사와 전 세계 지역에 걸쳐 약 60명의 팀으로 구성되어 있습니다.
Read More


