
Trade The World
Render Price Forecast: RENDER surpasses $1.2 billion market cap as rally accelerates
작성자 Manish Chhetri
게시일: 6 Jan 2026 | 수정일: 6 Jan 2026


POPULAR ARTICLES

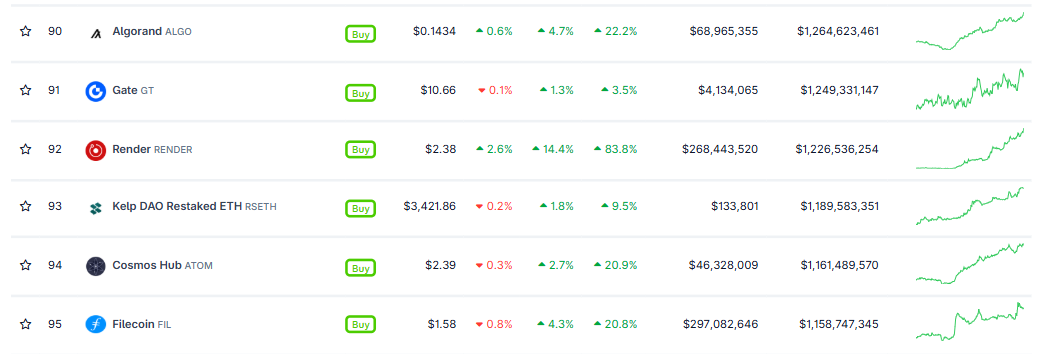
Render (RENDER) continues its rally, trading above $2.36 on Tuesday after surging more than 50% last week. This price rally pushed RENDER’s market capitalization above $1.2 billion, surpassing that of other popular altcoins, such as Cosmos (ATOM) and Filecoin (FIL).
- Render price is trading 7% higher on Tuesday, continuing its rally after surging more than 50% in the previous week.
- RENDER’s market capitalization surpasses $1.2 billion, overtaking popular altcoins such as ATOM and FIL.
- On-chain and derivatives metrics support further gains, with rising daily active addresses, trading volume, and open interest, indicating growing market participation.
Render (RENDER) continues its rally, trading above $2.36 on Tuesday after surging more than 50% last week. This price rally pushed RENDER’s market capitalization above $1.2 billion, surpassing that of other popular altcoins, such as Cosmos (ATOM) and Filecoin (FIL). Meanwhile, improving on-chain activity and derivatives data points to continued upward momentum for RENDER.
RENDER market capitalization reaches $1.2 billion
Render, a decentralized network that provides decentralized (Graphics Processing Unit) GPU compute services, has soared more than 83.8% in the last seven days. According to CoinGecko data, the altcoin has rallied over 14.4% in the last 24 hours. This price rally pushed Render’s market capitalization above $1.2 billion, surpassing that of other popular coins, such as ATOM and FIL.
Render’s bullish on-chain and derivatives data
Santiment data indicate that the RENDER ecosystem’s trading volume (the aggregate trading volume generated by all exchange applications on the chain) reached $181.36 million on Tuesday, the highest since November 7, and has been steadily rising since last month. This volume rise indicates a surge in traders’ interest and liquidity in RENDER, boosting its bullish outlook.
 [11-1767684678093-1767684678094.19.58, 06 Jan, 2026].png)
Santiment’s Daily Active Addresses index, which tracks network activity over time, also paints a bullish picture for Render. A rise in the metric signals increased blockchain usage, while a decline in addresses indicates lower demand for the network.
In RENDER’s case, Daily Active Addresses rose from 54 on December 26 to 536 on Tuesday, the highest level since October 12. This indicates that demand for RENDER’s blockchain usage is increasing, which bodes well for Render’s price.
 [11-1767684763692-1767684763694.20.07, 06 Jan, 2026].png)
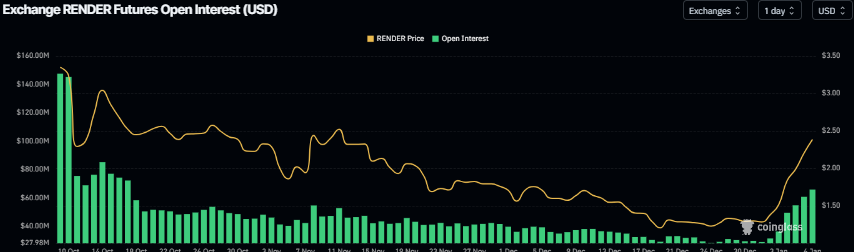
On the derivatives side, Coinglass’ data show that RENDER futures Open Interest (OI) at exchanges rose from $28.90 million on Thursday to $65.89 million on Tuesday, the highest level since October 17. An increasing OI indicates new or additional money entering the market and increased buying, which could fuel the current rally in the Render.
Render Price Forecast: RENDER bulls aiming for a higher leg
Render price broke above the falling wedge pattern (formed by connecting multiple highs and lows with two trendlines since October) on January 2. It rose 45% through Monday, closing above its 50-day EMA and 100-day EMA at $1.70 and $2.08, respectively. As of Tuesday, RENDER is trading 7% higher.
If RENDER continues its upward trend, it could extend the rally toward the 200-day EMA at $2.73.
The Relative Strength Index (RSI) on the daily chart is at 81, above its overbought level, indicating strong bullish momentum. In addition, the Moving Average Convergence Divergence (MACD) indicator shows a bullish crossover and rising green histogram bars above the neutral level, further supporting the bullish outlook.
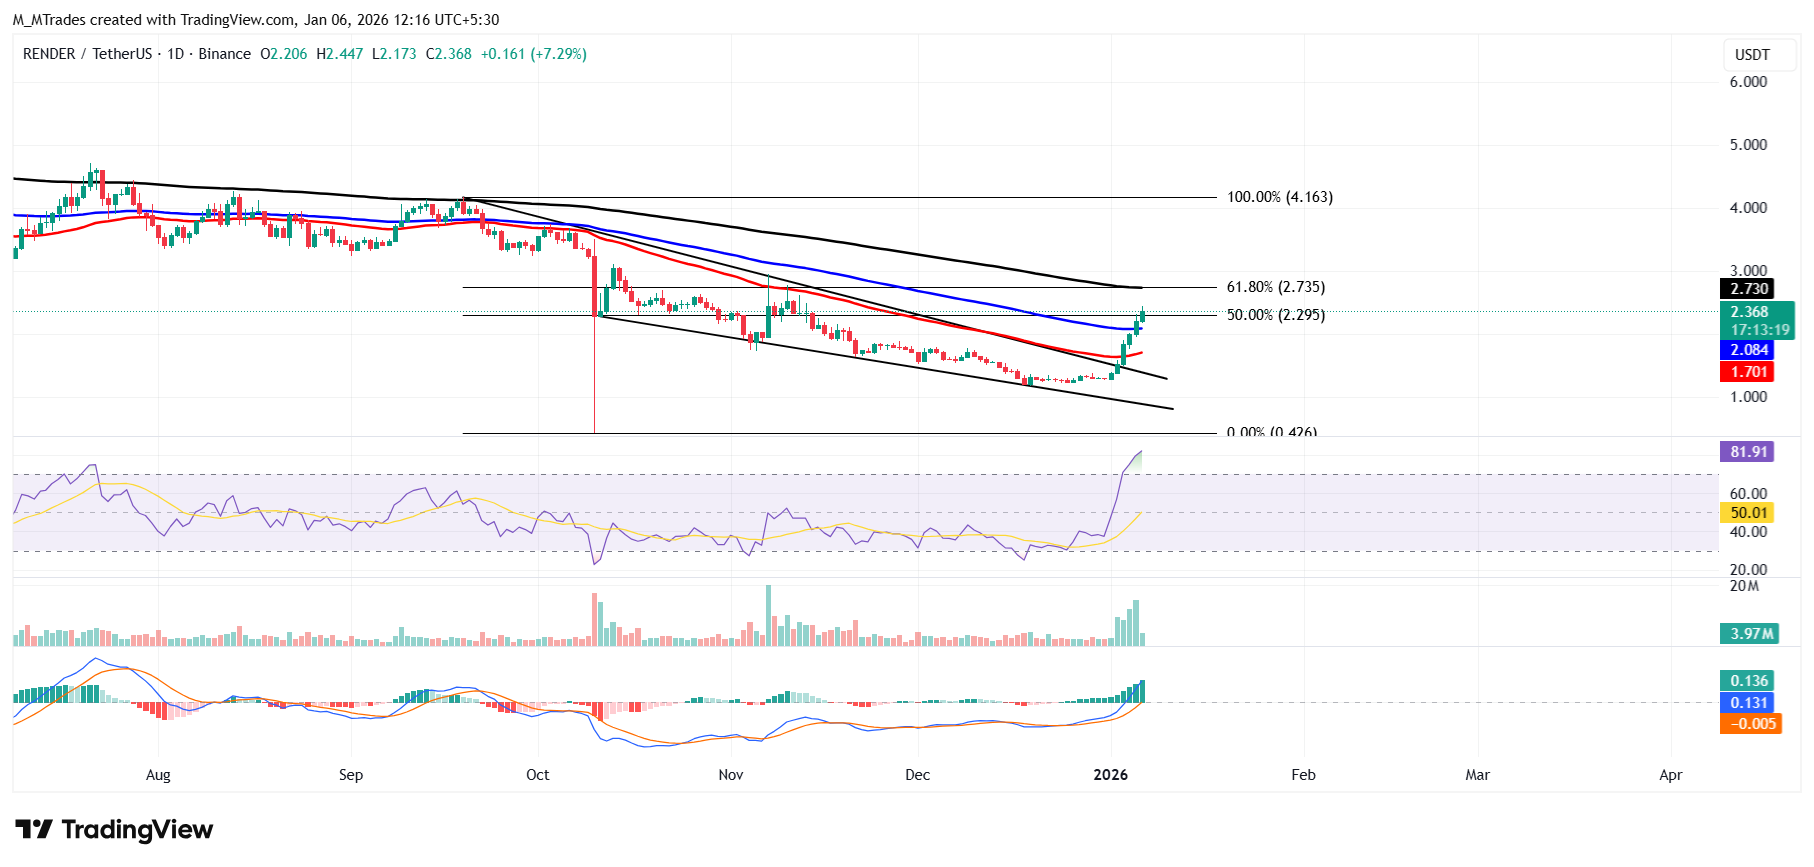
However, if Render corrects, it could extend thedecline toward the 100-day EMA at $2.08.

FXStreet
100만 명이 넘는 사용자가 FXStreet를 통해 실시간 시장 데이터, 차트 도구, 전문가 인사이트, 포렉스 뉴스를 이용합니다. 포괄적인 경제 캘린더와 교육 웨비나는 트레이더가 정보를 유지하고 신중한 결정을 내리도록 돕습니다. FXStreet는 바르셀로나 본사와 전 세계 지역에 걸쳐 약 60명의 팀으로 구성되어 있습니다.
Read More


