
Trade The World
XRP price outlook dims as on-chain activity and futures weaken
작성자 John Isige
게시일: 13 Jan 2026 | 수정일: 13 Jan 2026


POPULAR ARTICLES

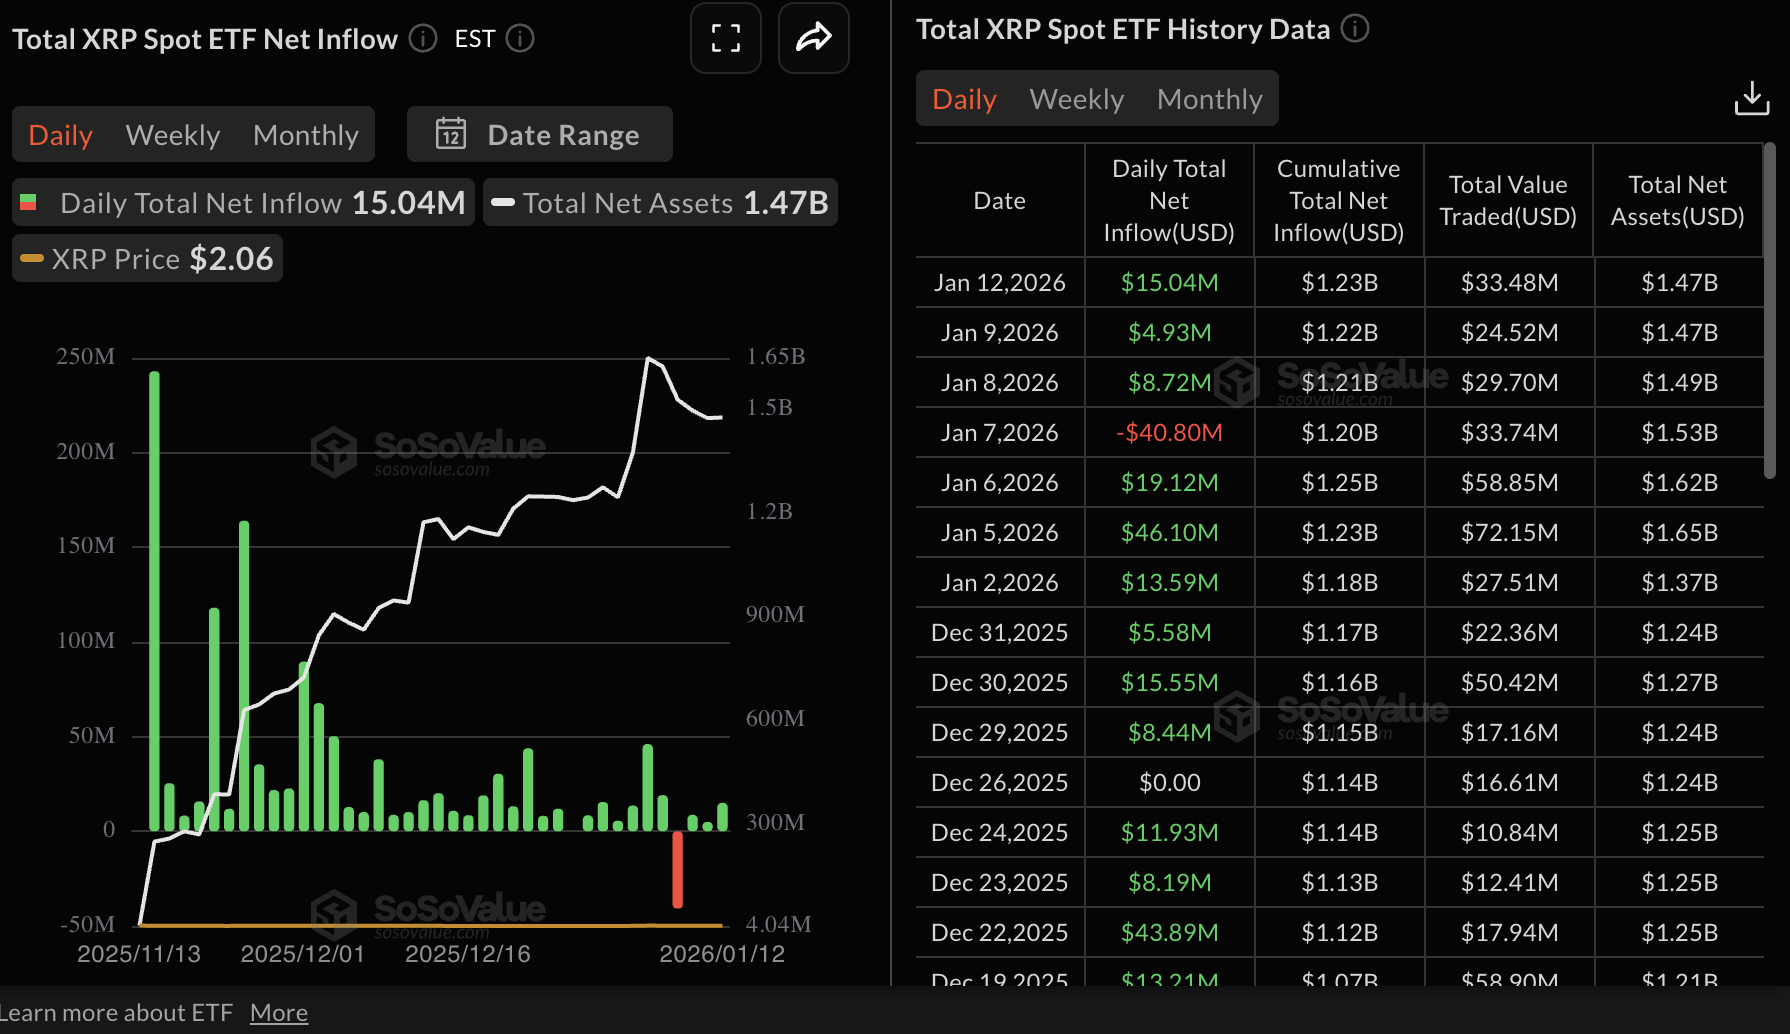
Ripple (XRP) is trading sideways above support at $2.00 at the time of writing on Tuesday. Recovery has remained elusive despite steady inflows into spot Exchange Traded Funds (ETFs), which have cumulatively attracted $1.23 billion.
- XRP holds steady above the $2.00 support but remains below key moving averages, including the 50-day EMA.
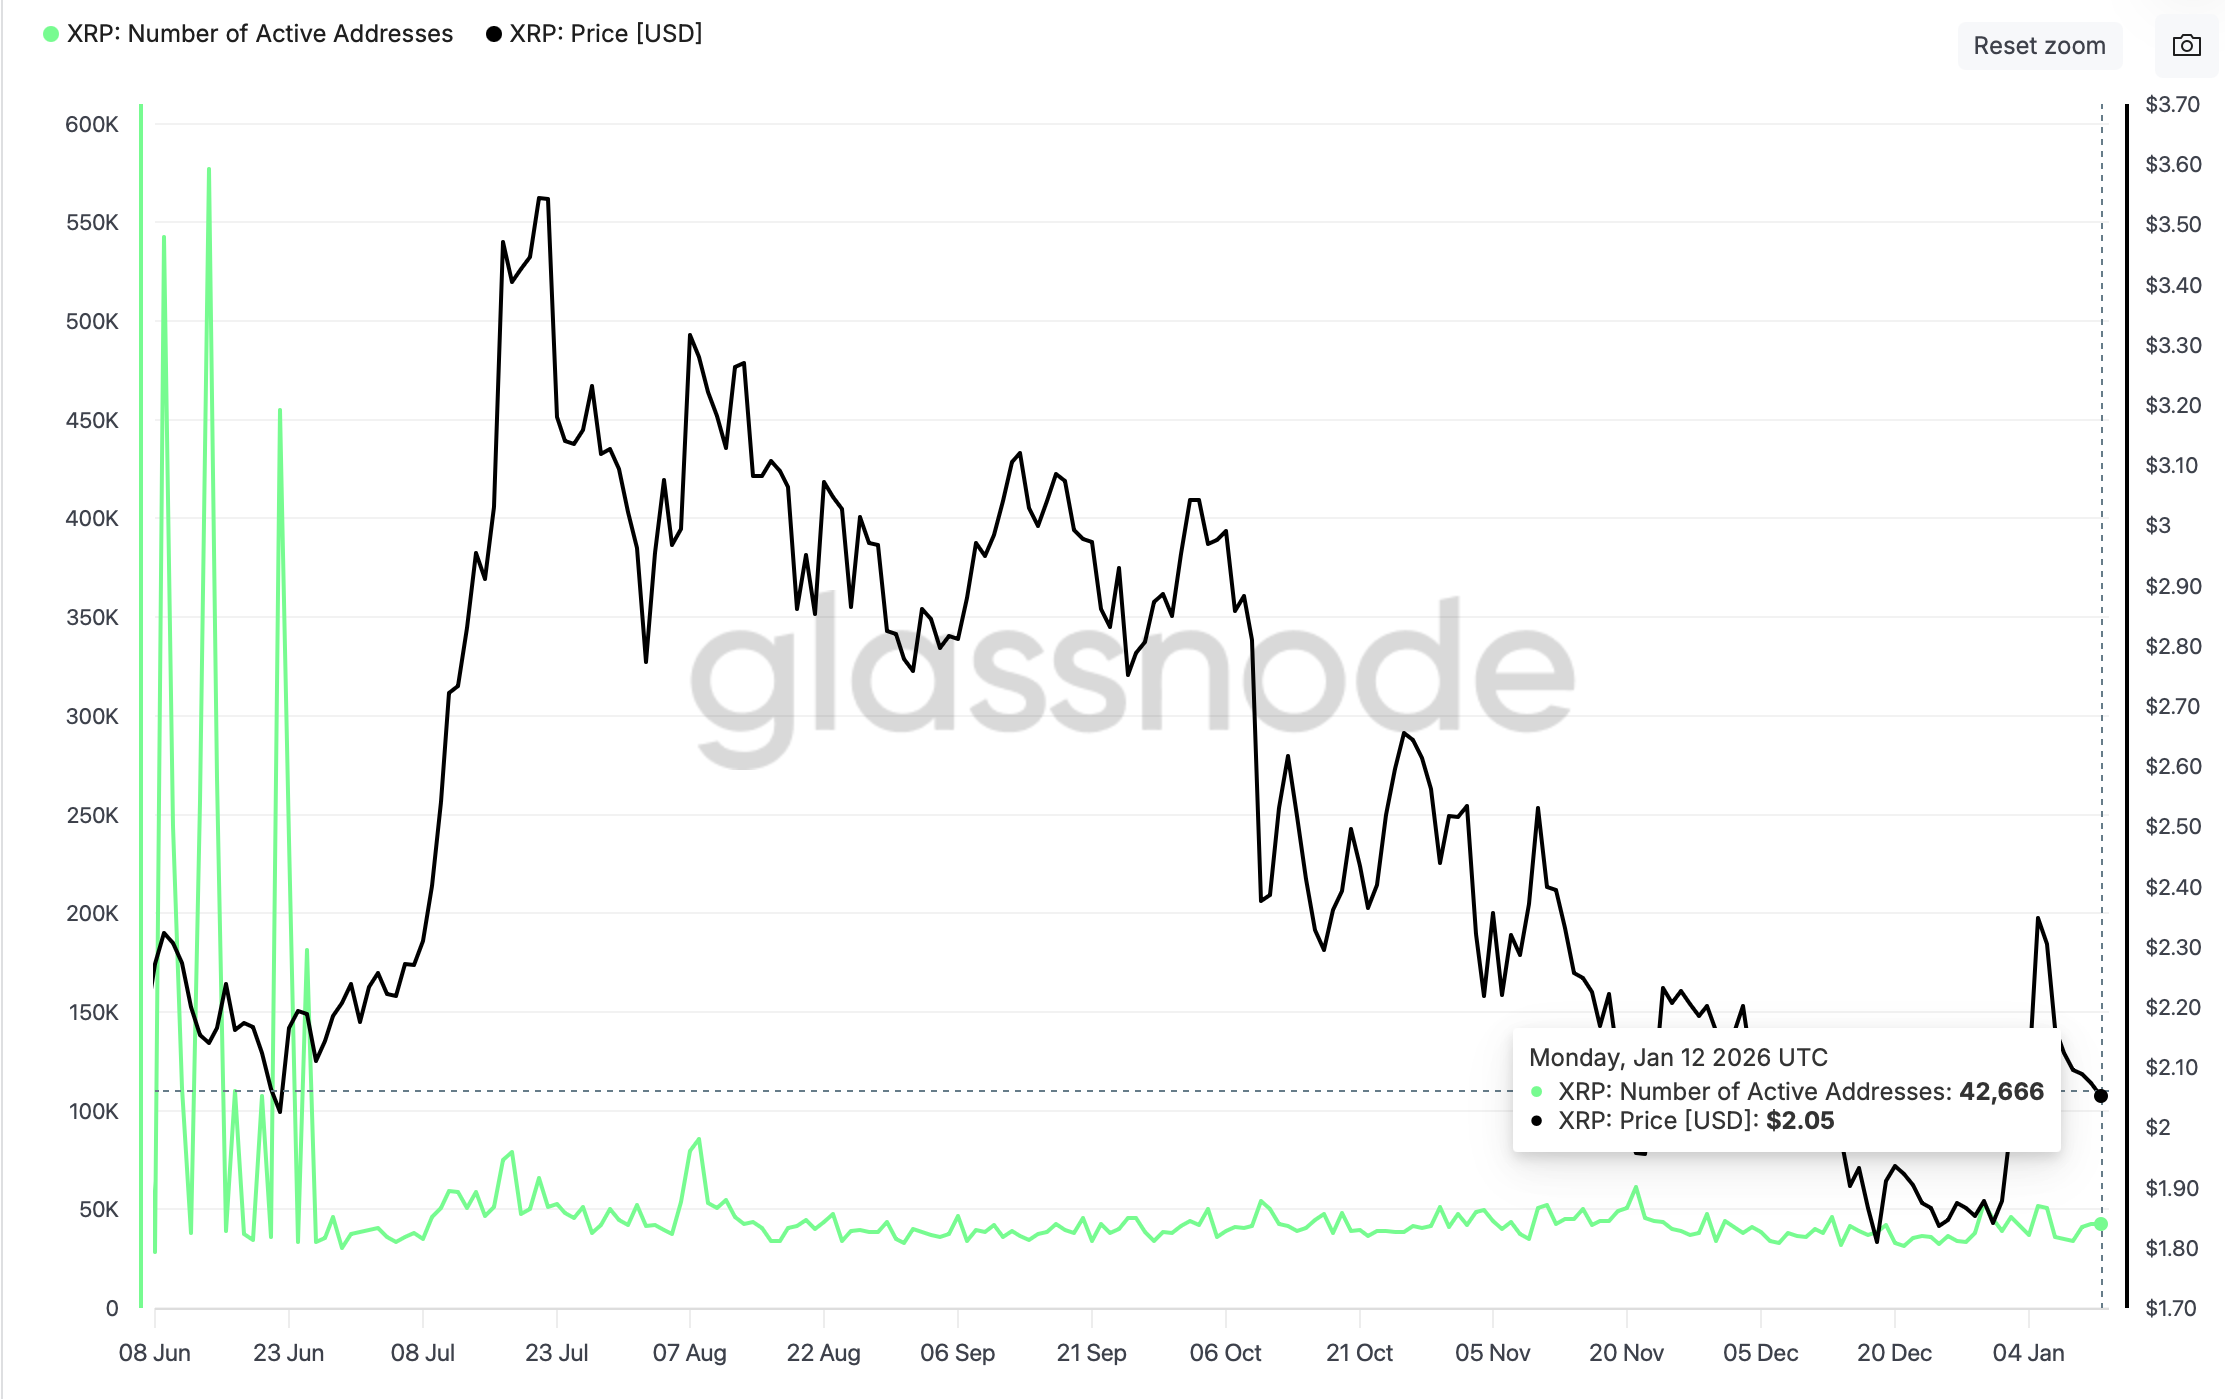
- The XRP Ledger is seeing declining activity, with the number of active addresses falling by 17.5% over the past week.
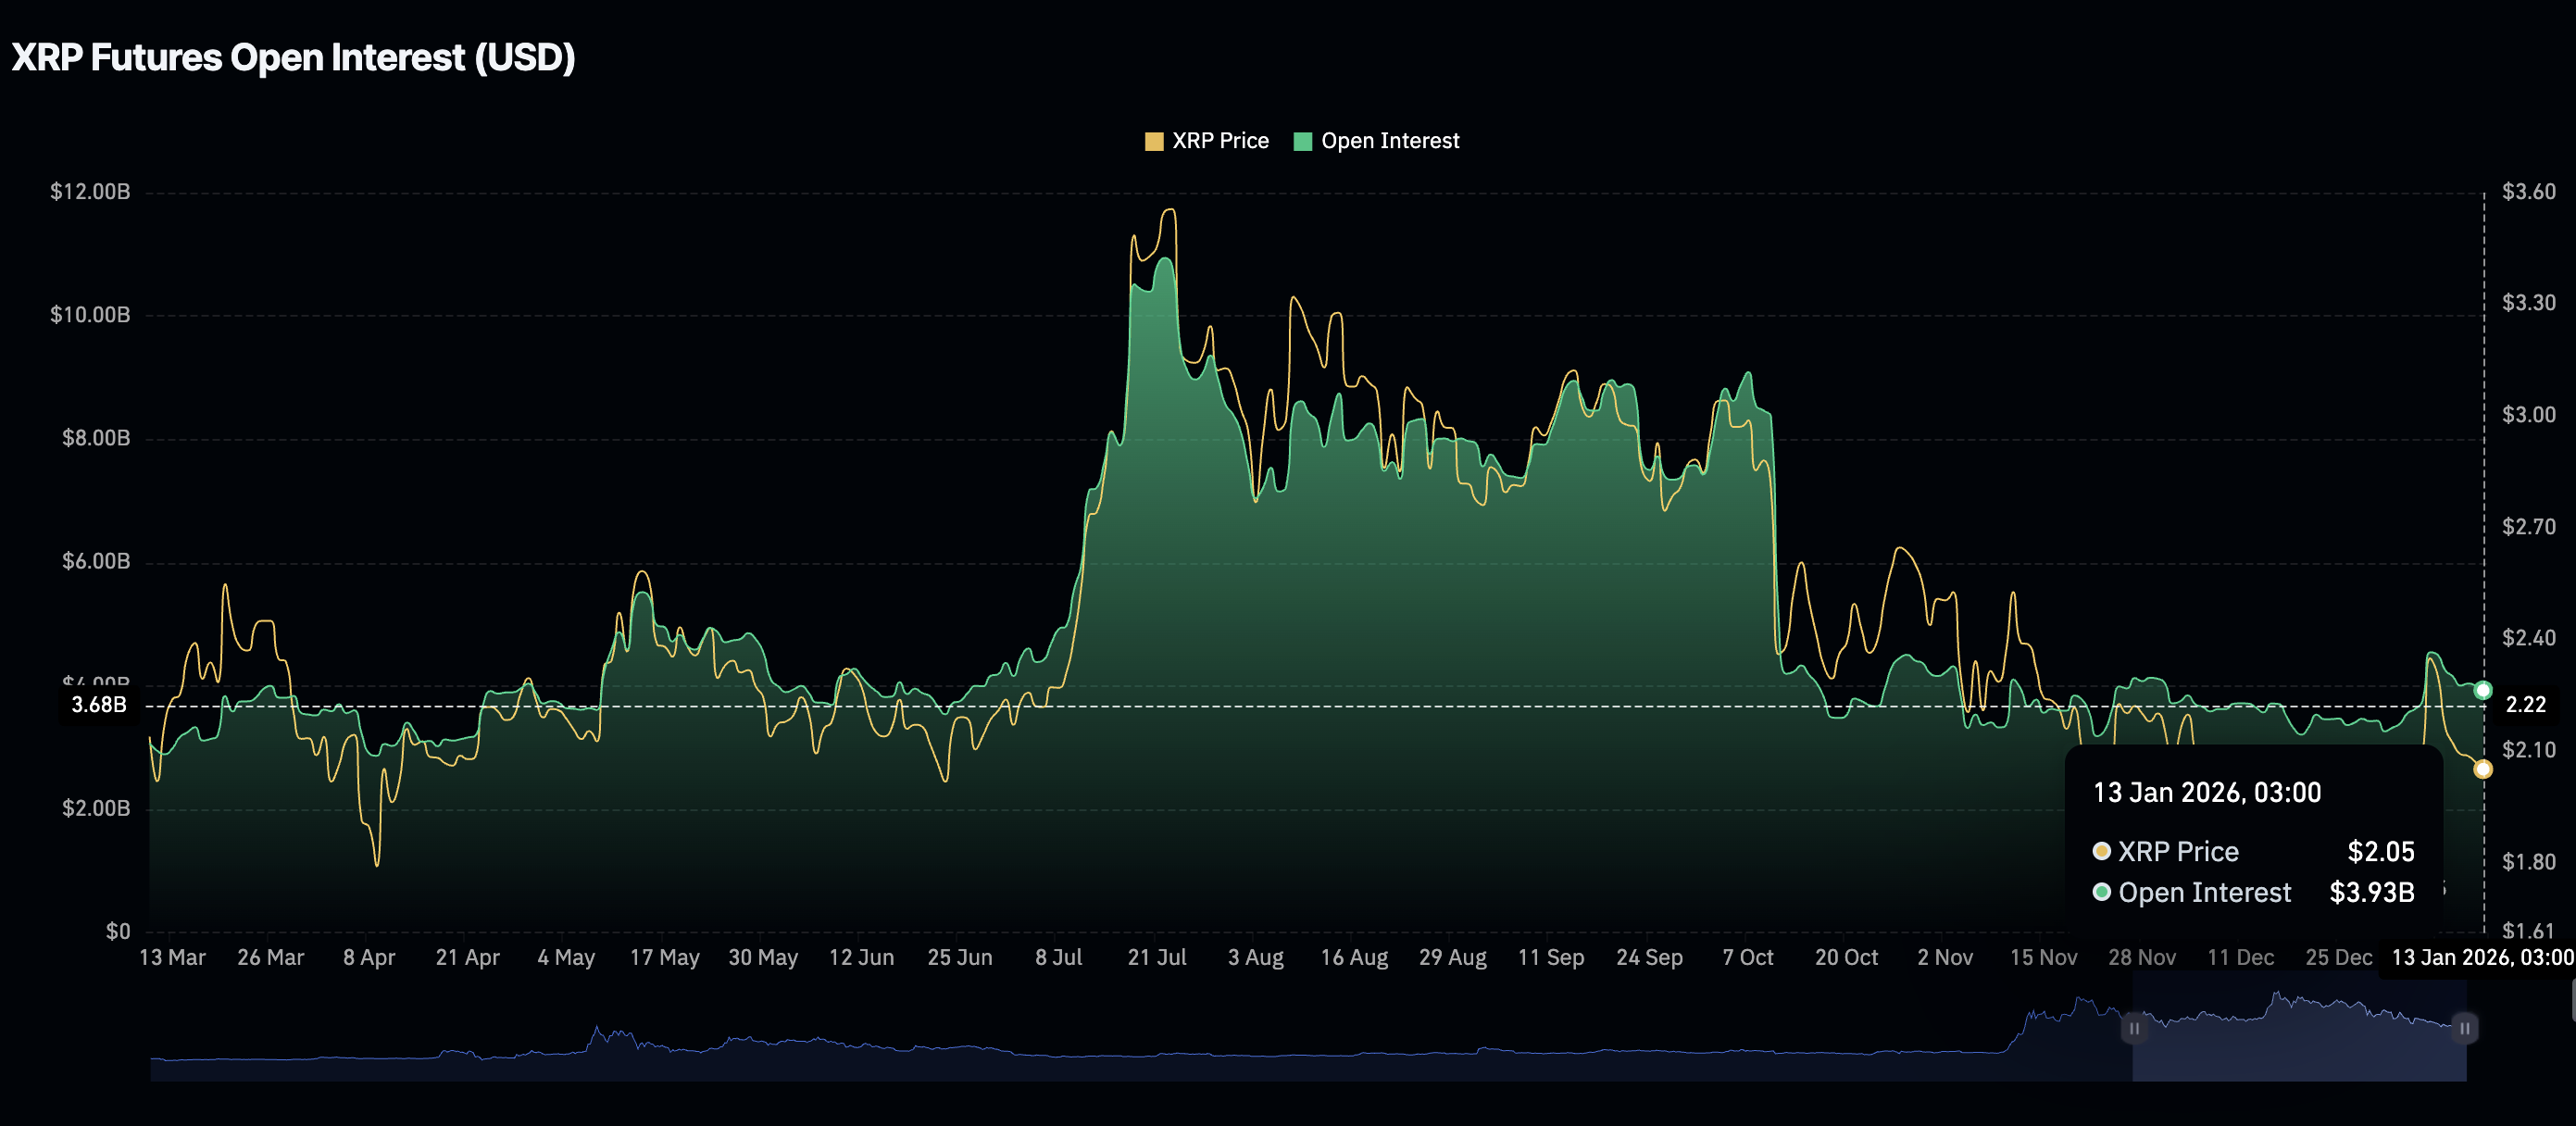
- The XRP derivatives market remains relatively weak, with futures Open Interest shrinking to $3.93 billion on Tuesday.
Ripple (XRP) is trading sideways above support at $2.00 at the time of writing on Tuesday. Recovery has remained elusive despite steady inflows into spot Exchange Traded Funds (ETFs), which have cumulatively attracted $1.23 billion.
Despite the steady inflows reported, low retail demand, slowing on-chain activity, and macroeconomic uncertainty are among the factors likely to be contributing to slugging price action.
Low on-chain activity weighs on XRP price outlook
The number of addresses actively transacting on the XRP Ledger (XRPL) has declined by 17.5% to approximately 42,600 as of Monday from 51,500 recorded on January 5, according to Glassnode’s data.
Address activity on the protocol has persistently declined since July, from above 66,000, signaling reduced user engagement. Further decline would mean low retail demand, thereby depriving XRP of the tailwind needed to sustain the recovery.
Meanwhile, the XRP derivatives market has continued to weaken since January 6, when futures Open Interest (OI) surged to $4.55 billion. CoinGlass data shows the OI, representing the outstanding value of futures contracts, averaging $3.93 billion on Tuesday, reflecting the gradual decay.
This persistent decline suggests investors are losing confidence in XRP’s ability to sustain the uptrend and may be employing risk management measures to limit further losses.
Technical outlook: XRP consolidates amid mixed signals
XRP is trading within a small range with support at $2.00 and resistance at the 50-day Exponential Moving Average (EMA) at $2.07 at the time of writing on Tuesday. The Relative Strength Index (RSI) on the daily chart is at 52, indicating lack of momentum. However, due to a slight negative divergence, sellers could continue having an edge over buyers in the short term.
The Moving Average Convergence Divergence (MACD) indicator on the same chart is posted to flash a sell signal if the blue MACD line crosses below the red signal line. The presence of a red histogram expanding below the mean line would prompt traders to reduce risk exposure – a move likely to add to selling pressure.
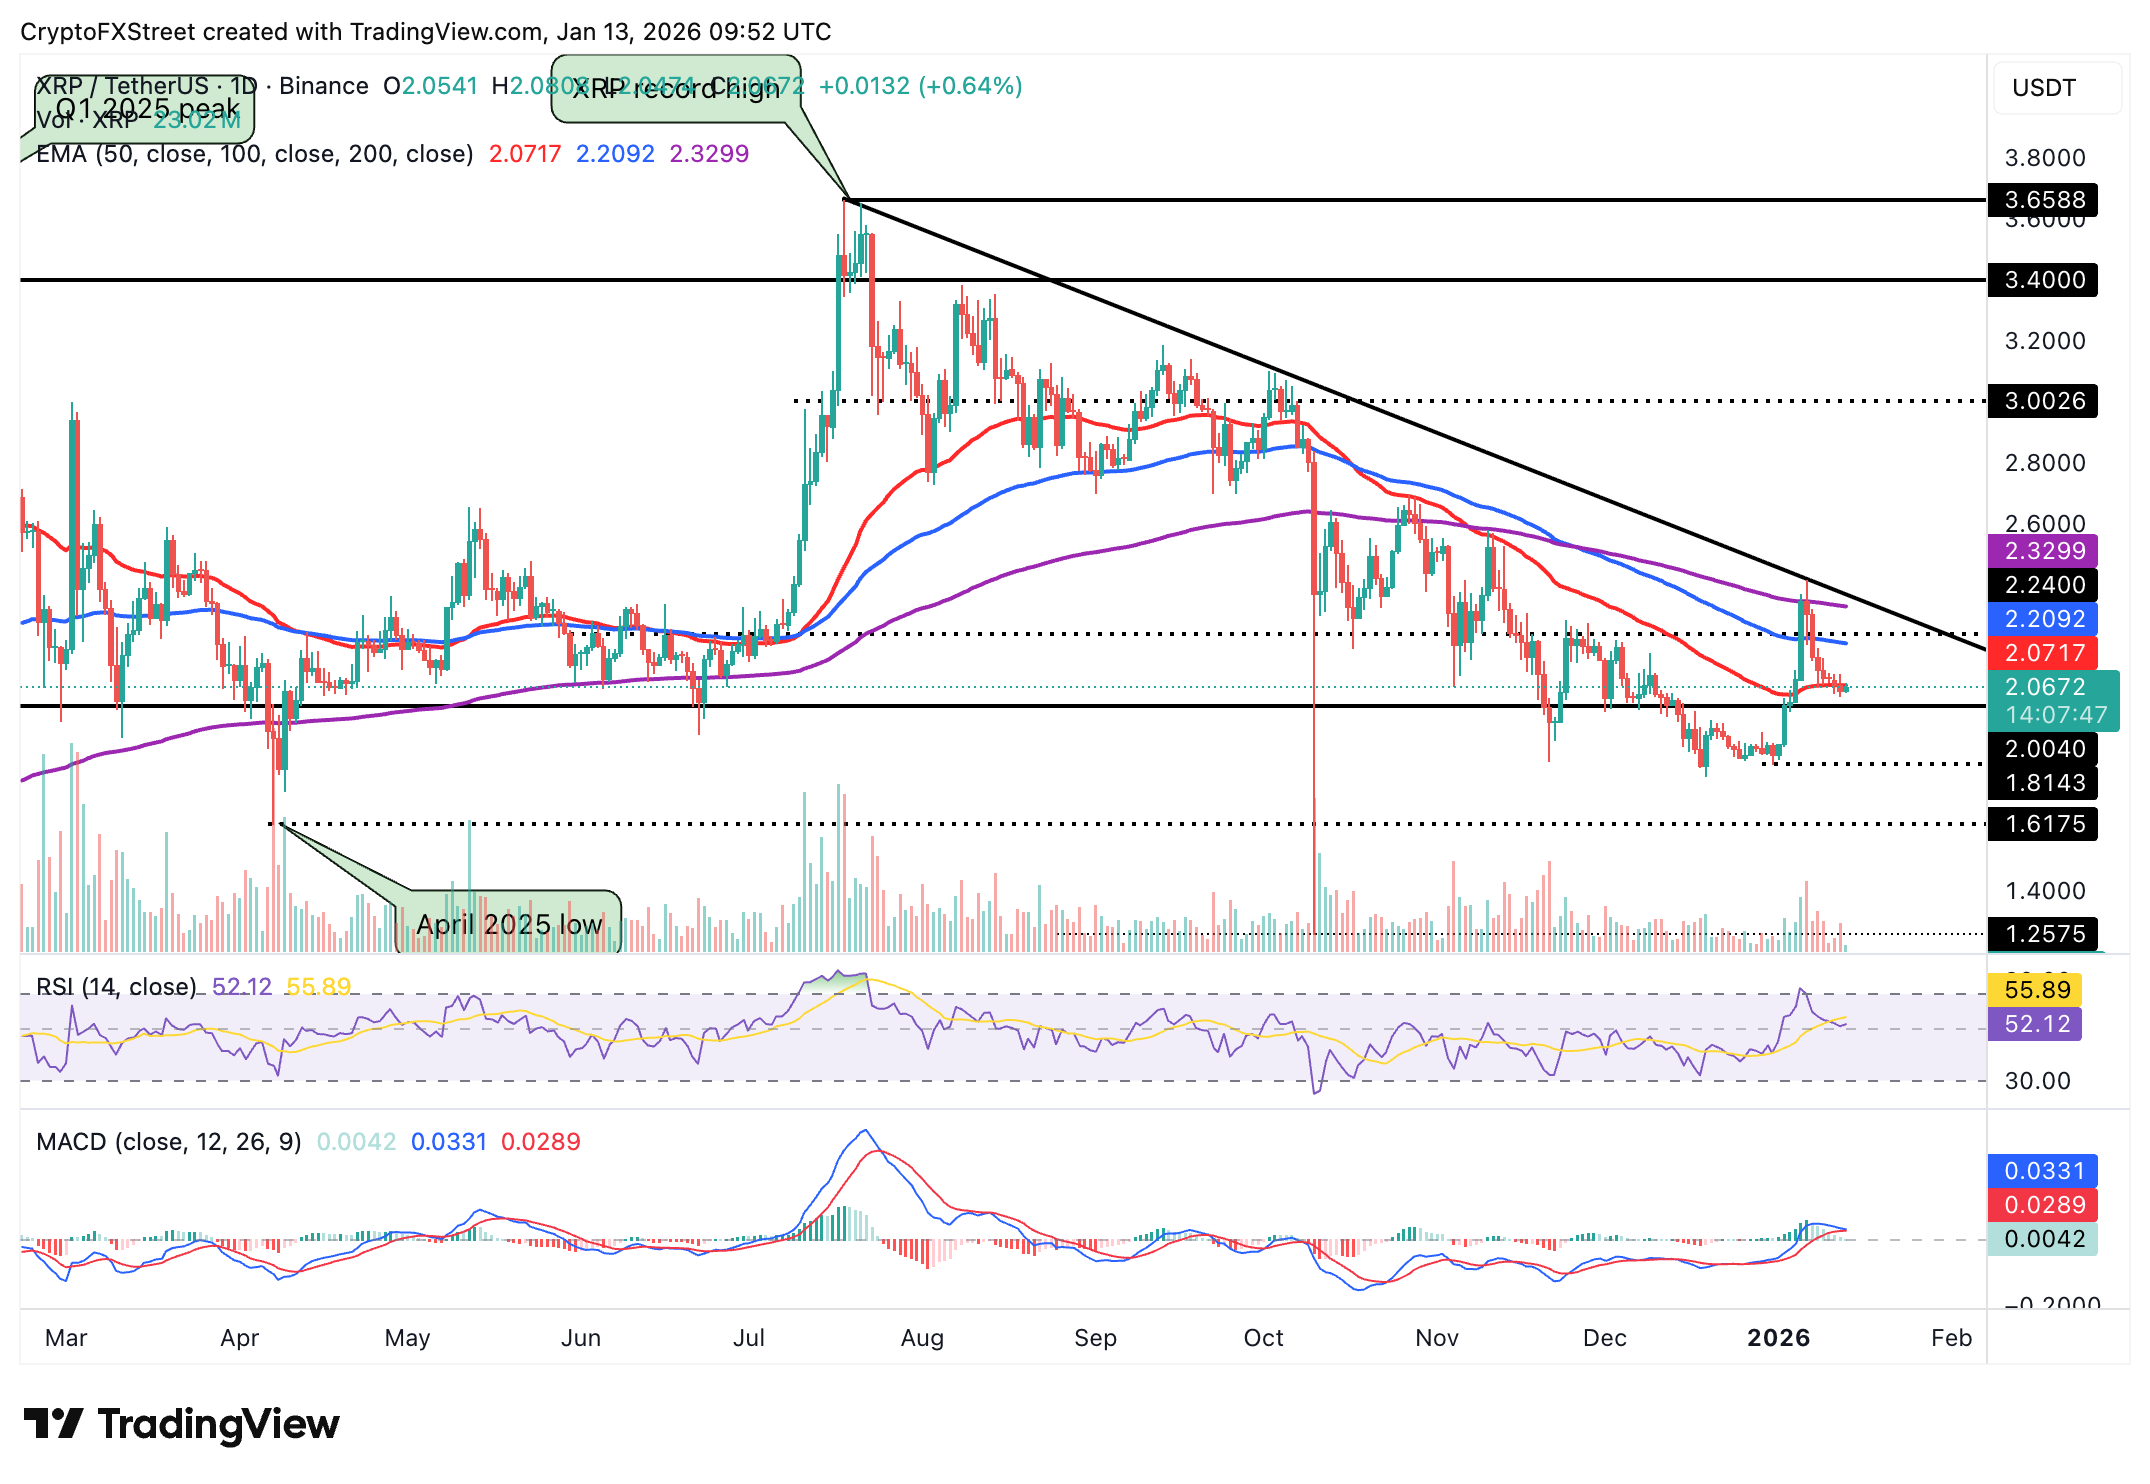
A close below the 50-day EMA would reinforce XRP’s short-term bearish outlook and increase the odds of the token extending its decline below $2.00. The next demand zone lies at $1.81, tested on January 1.
Still, if bulls push past the 50-day EMA, a 9% breakout could occur, targeting the 100-day EMA at $2.21 and the 200-day EMA at $2.33.
Open Interest, funding rate FAQs
Higher Open Interest is associated with higher liquidity and new capital inflow to the market. This is considered the equivalent of increase in efficiency and the ongoing trend continues. When Open Interest decreases, it is considered a sign of liquidation in the market, investors are leaving and the overall demand for an asset is on a decline, fueling a bearish sentiment among investors.
Funding fees bridge the difference between spot prices and prices of futures contracts of an asset by increasing liquidation risks faced by traders. A consistently high and positive funding rate implies there is a bullish sentiment among market participants and there is an expectation of a price hike. A consistently negative funding rate for an asset implies a bearish sentiment, indicating that traders expect the cryptocurrency’s price to fall and a bearish trend reversal is likely to occur.

FXStreet
100만 명이 넘는 사용자가 FXStreet를 통해 실시간 시장 데이터, 차트 도구, 전문가 인사이트, 포렉스 뉴스를 이용합니다. 포괄적인 경제 캘린더와 교육 웨비나는 트레이더가 정보를 유지하고 신중한 결정을 내리도록 돕습니다. FXStreet는 바르셀로나 본사와 전 세계 지역에 걸쳐 약 60명의 팀으로 구성되어 있습니다.
Read More


