
Trade The World
XRP downside risks emerge despite rising derivatives volume, Open Interest
작성자 John Isige
게시일: 11 Nov 2025 | 수정일: 11 Nov 2025


POPULAR ARTICLES

Ripple (XRP) has pulled back to $2.43 at the time of writing on Tuesday, after rising for two consecutive days. The minor sell-off from an intraday high of $2.57 reflects a bearish outlook in the broader crypto market, as investors book early profits.
- XRP corrects after testing the confluence of the 50- and 200-day EMAs at $2.58.
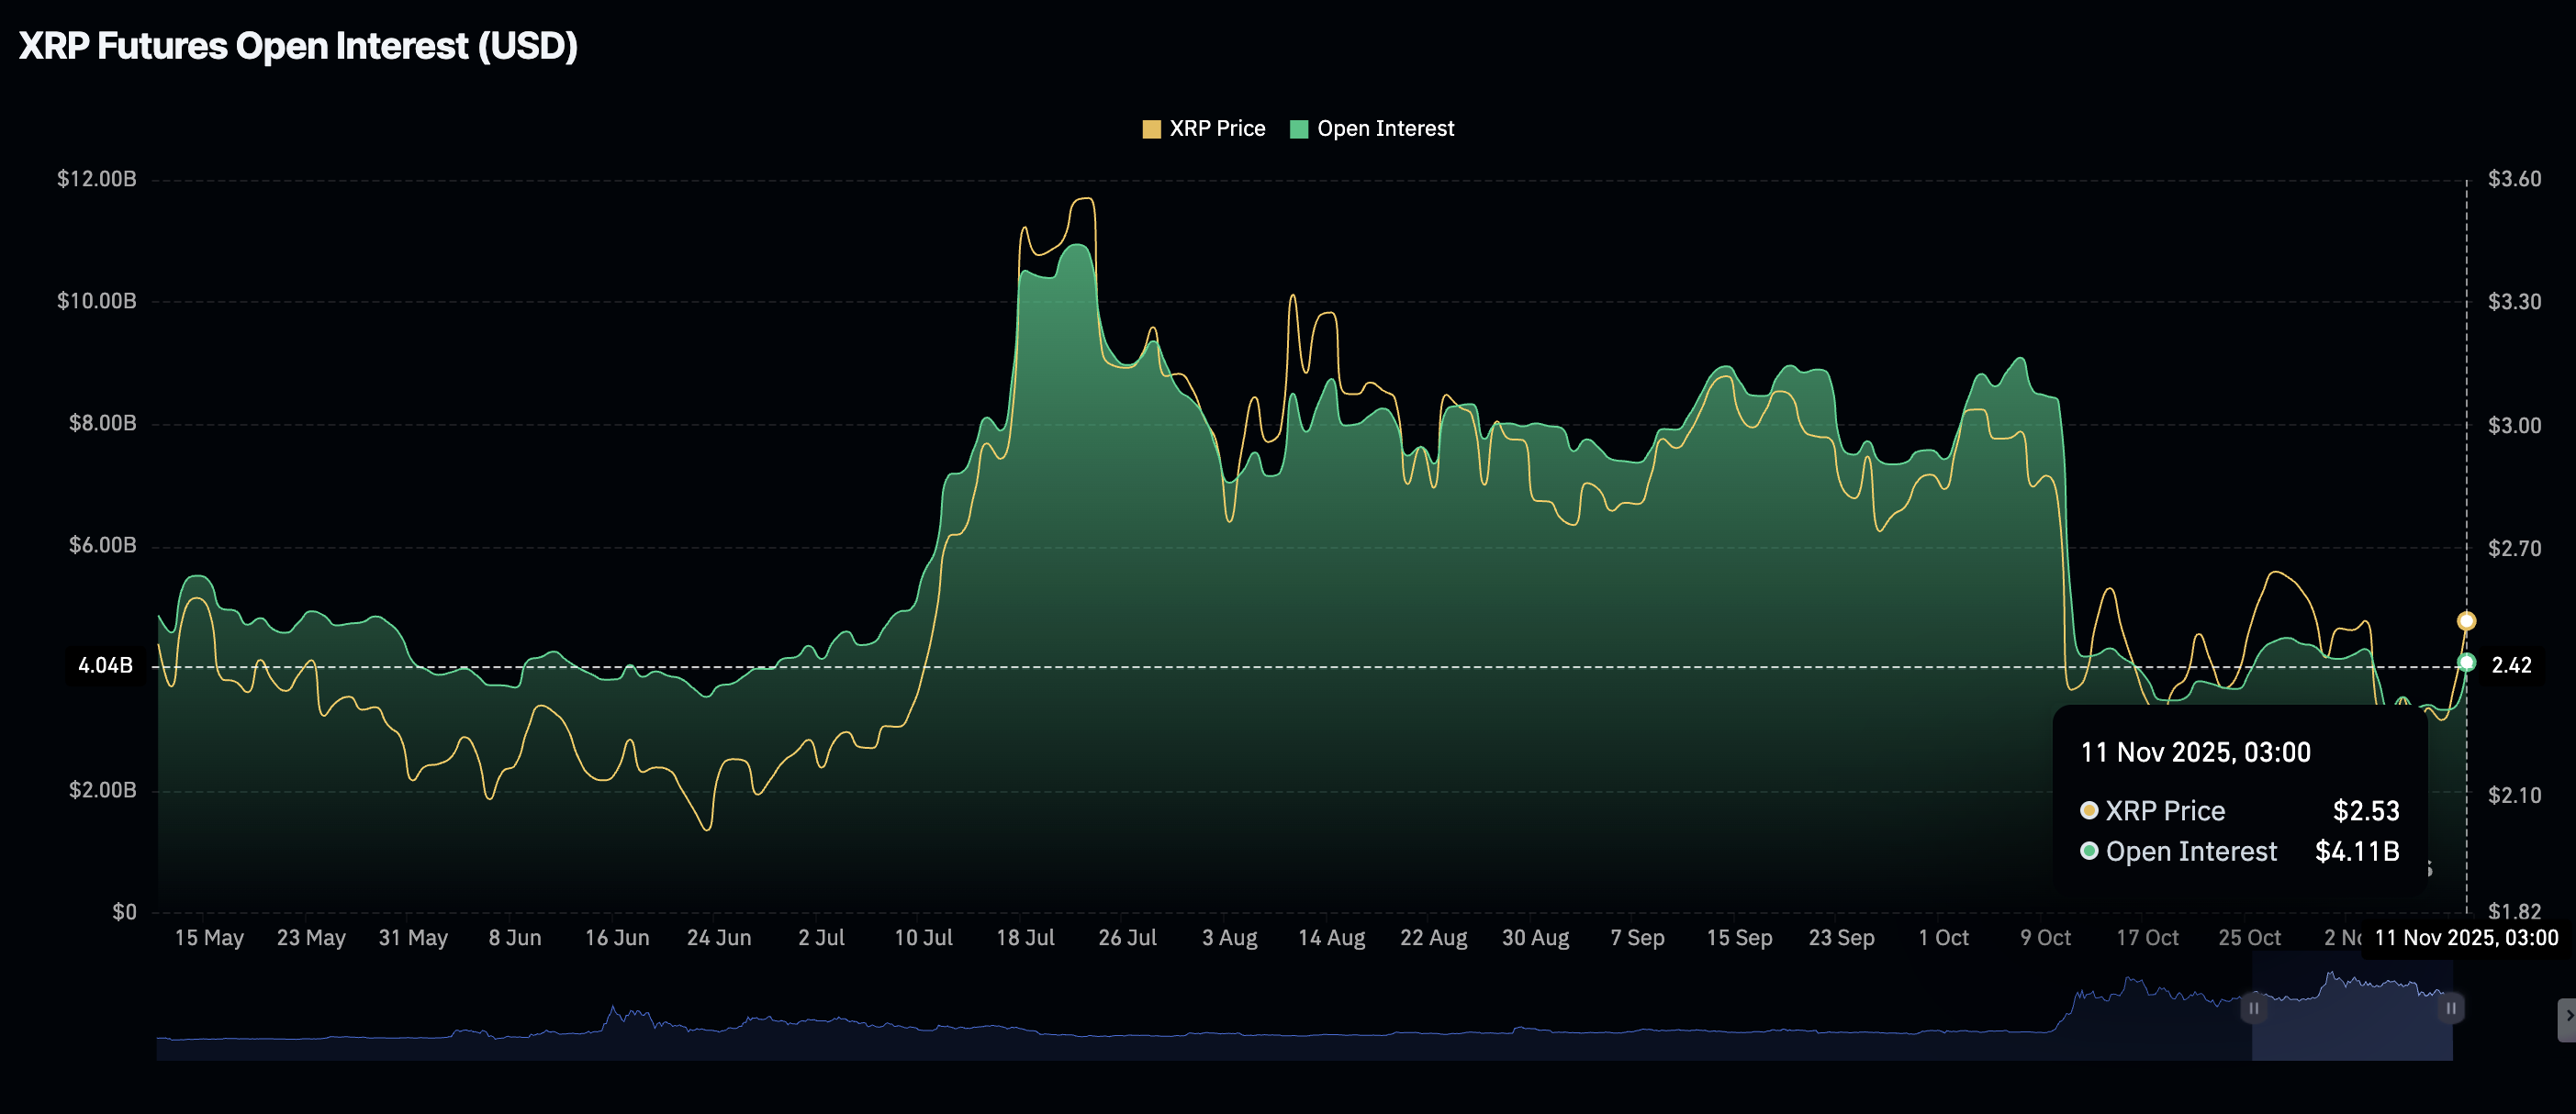
- XRP derivatives market rebounds slightly as the futures Open Interest reclaims the $4 billion mark.
- The MACD indicator maintains a buy signal, reinforcing XRP’s short-term bullish outlook.
Ripple (XRP) has pulled back to $2.43 at the time of writing on Tuesday, after rising for two consecutive days. The minor sell-off from an intraday high of $2.57 reflects a bearish outlook in the broader crypto market, as investors book early profits.
Macroeconomic uncertainty and the absence of strong bullish triggers within the industry continue to weigh on sentiment. Still, if the derivatives market holds recent gains, XRP could stabilize and resume its move toward $3.00.
XRP derivatives market rebounds
The XRP derivatives market has experienced a notable increase in retail interest, with Open Interest (OI) climbing to $4.11 billion on Tuesday from $3.36 billion the previous day.
This uptick occurred alongside a move in the price of XRP to a weekly high of $2.58, underscoring the influence retail traders have in driving prices higher.
OI is critical in gauging investor interest in XRP, as it represents the notional value of outstanding futures contracts. A steady uptrend suggests that investors are confident that the XRP price will keep rising in the short term and are willing to increase their risk exposure.
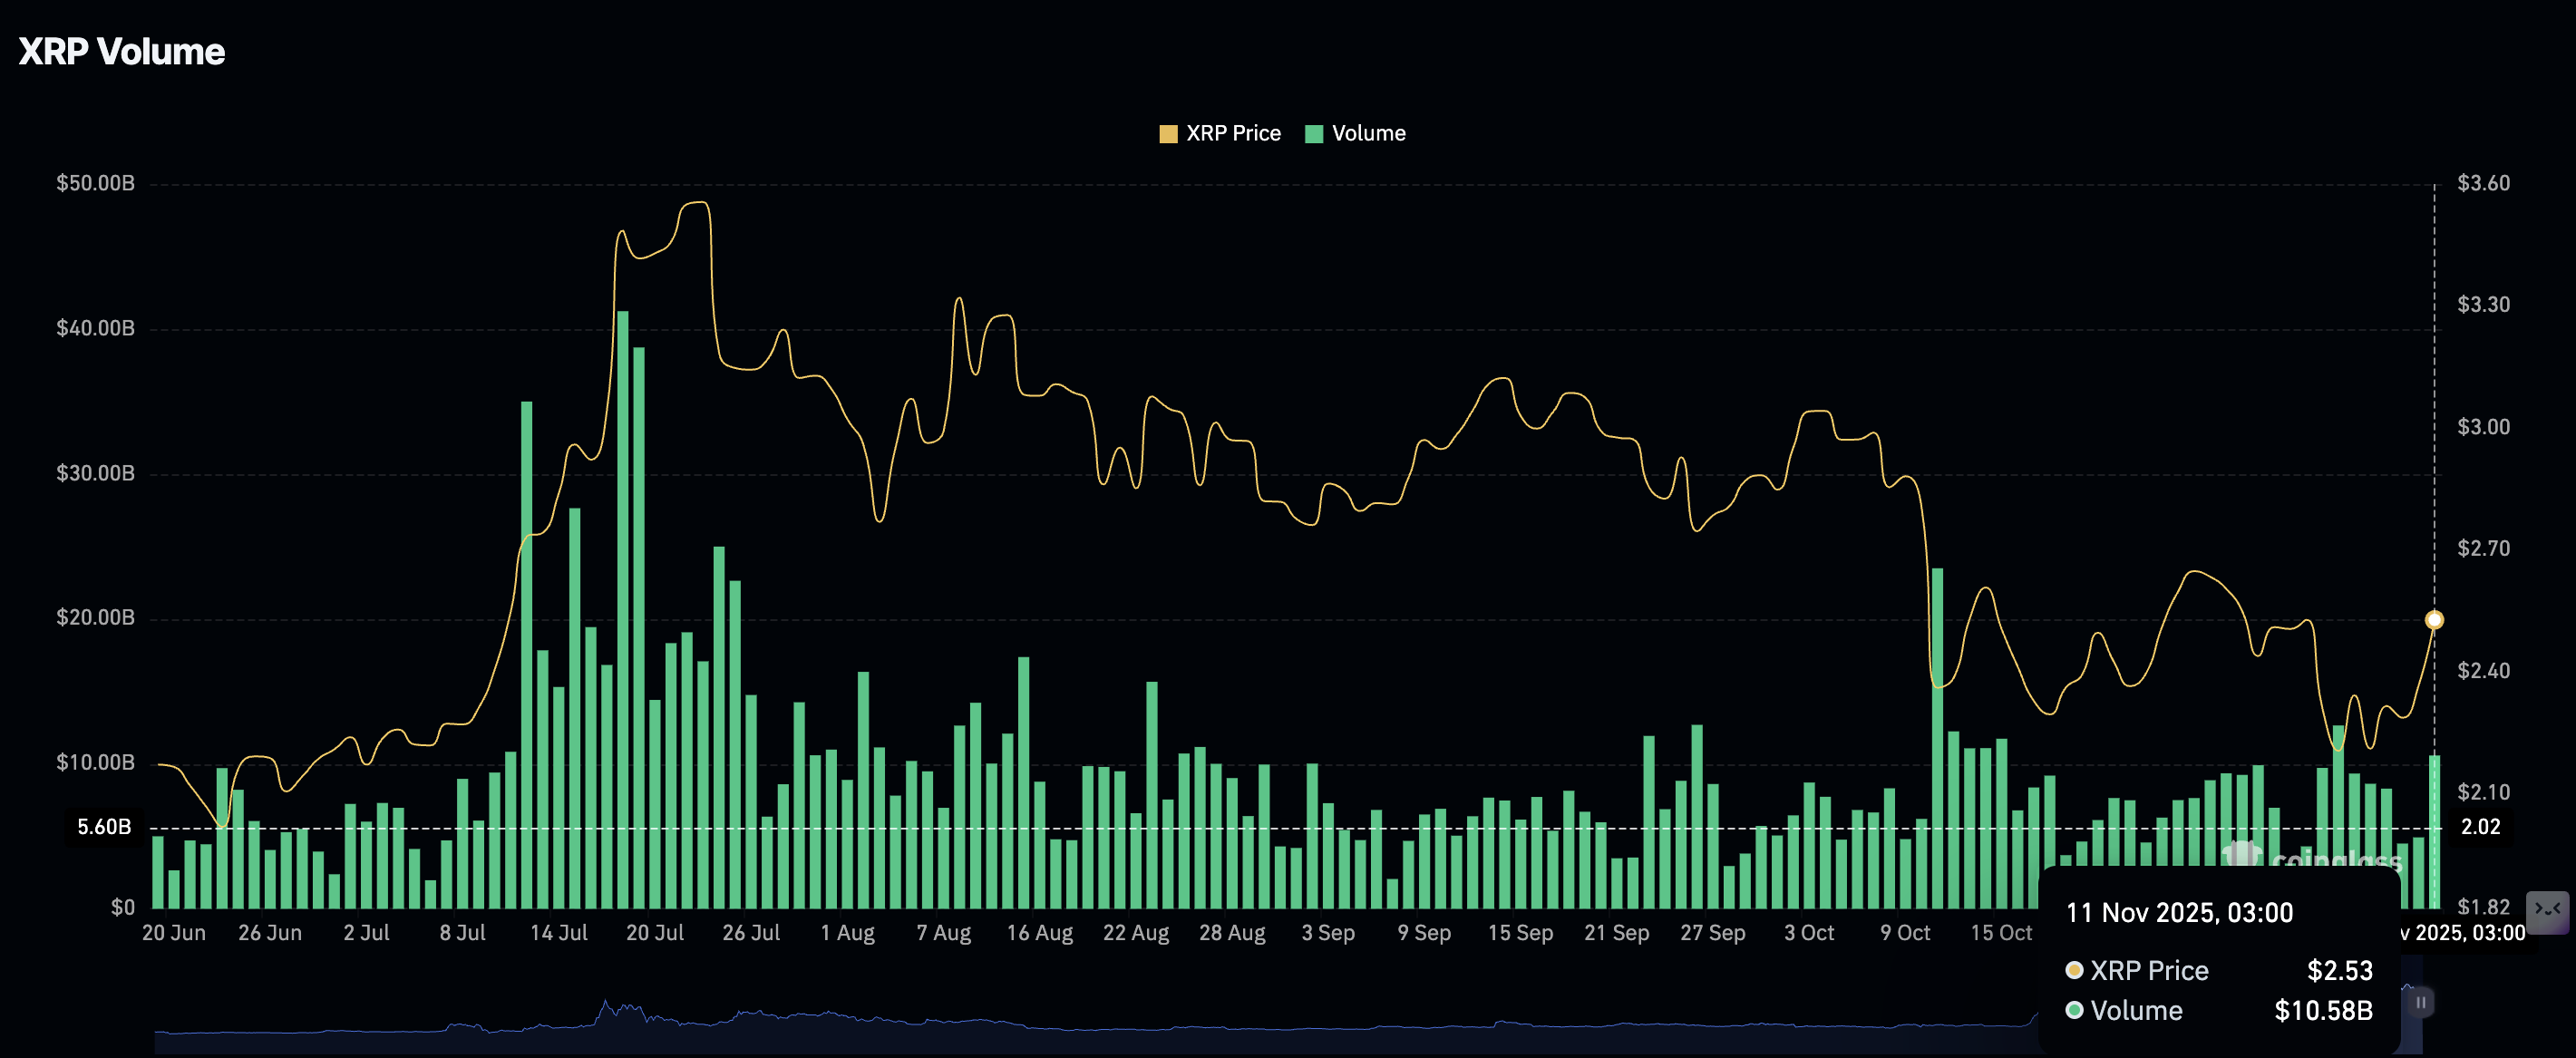
A subsequent increase in the trading volume to $10.58 billion indicates that fresh money is entering the market. The volume and OI should increase in tandem to support a short-term bullish trend.
Technical outlook: XRP recovery in jeopardy amid mixed signals
XRP edges lower, down nearly 3% to $2.45 at the time of writing on Tuesday. The cross-border remittance token is also positioned below key moving averages, including the 50-day EMA at $2.56, the 200-day EMA at $2.58, and the 100-day EMA at $2.64, all of which highlight key resistance levels.
The Relative Strength Index (RSI) currently sits at 48, down from Monday’s reading of 52. This suggests easing bullish momentum, which may curtail the short-term bullish outlook toward $3.00. Key areas of interest for traders are $2.24, tested on Sunday and $2.07, tested on November 4.
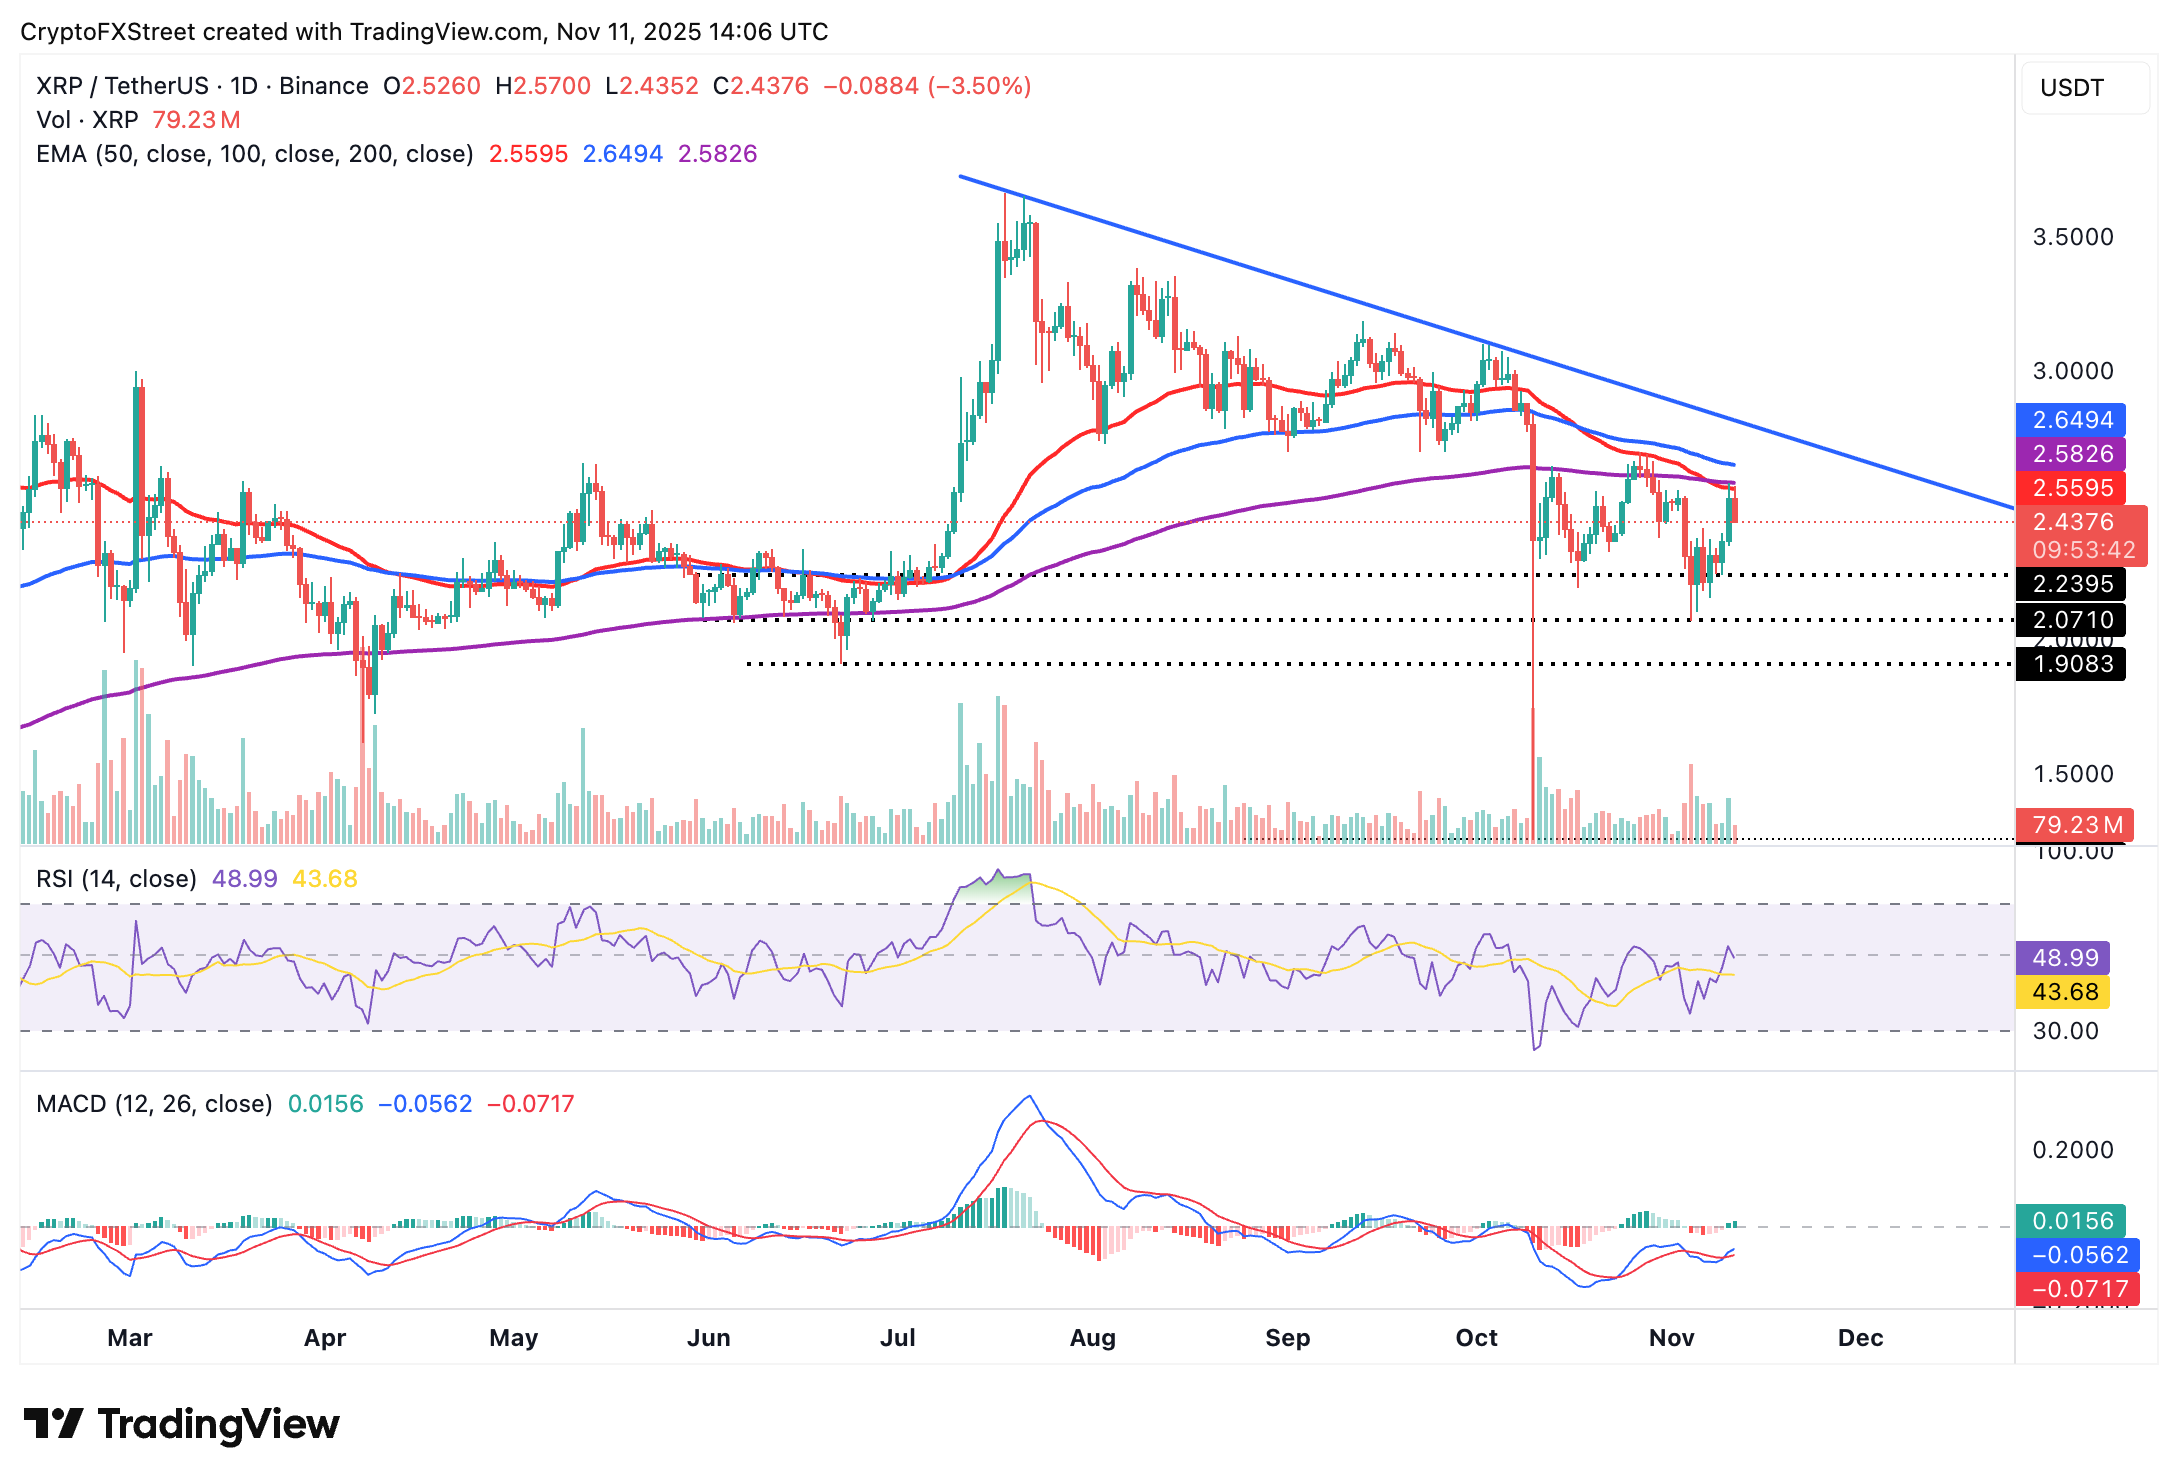
XRP/USDT daily chart
On the other hand, the Moving Average Convergence Divergence (MACD) indicator has maintained a buy signal since Monday, suggesting investors increase their risk exposure. However, recovery above the 50-day and 200-day EMAs may help uphold a bullish outlook, with an eye on $3.00.
Cryptocurrency metrics FAQs
The developer or creator of each cryptocurrency decides on the total number of tokens that can be minted or issued. Only a certain number of these assets can be minted by mining, staking or other mechanisms. This is defined by the algorithm of the underlying blockchain technology. On the other hand, circulating supply can also be decreased via actions such as burning tokens, or mistakenly sending assets to addresses of other incompatible blockchains.
Market capitalization is the result of multiplying the circulating supply of a certain asset by the asset’s current market value.
Trading volume refers to the total number of tokens for a specific asset that has been transacted or exchanged between buyers and sellers within set trading hours, for example, 24 hours. It is used to gauge market sentiment, this metric combines all volumes on centralized exchanges and decentralized exchanges. Increasing trading volume often denotes the demand for a certain asset as more people are buying and selling the cryptocurrency.
Funding rates are a concept designed to encourage traders to take positions and ensure perpetual contract prices match spot markets. It defines a mechanism by exchanges to ensure that future prices and index prices periodic payments regularly converge. When the funding rate is positive, the price of the perpetual contract is higher than the mark price. This means traders who are bullish and have opened long positions pay traders who are in short positions. On the other hand, a negative funding rate means perpetual prices are below the mark price, and hence traders with short positions pay traders who have opened long positions.

FXStreet
100만 명이 넘는 사용자가 FXStreet를 통해 실시간 시장 데이터, 차트 도구, 전문가 인사이트, 포렉스 뉴스를 이용합니다. 포괄적인 경제 캘린더와 교육 웨비나는 트레이더가 정보를 유지하고 신중한 결정을 내리도록 돕습니다. FXStreet는 바르셀로나 본사와 전 세계 지역에 걸쳐 약 60명의 팀으로 구성되어 있습니다.
Read More


